
Institutional Quality Tools for All Options Traders
Option Scanner
Trading
Backtester
Stock Scanner
Signal Builder
Trade Builder
Earnings & Financials
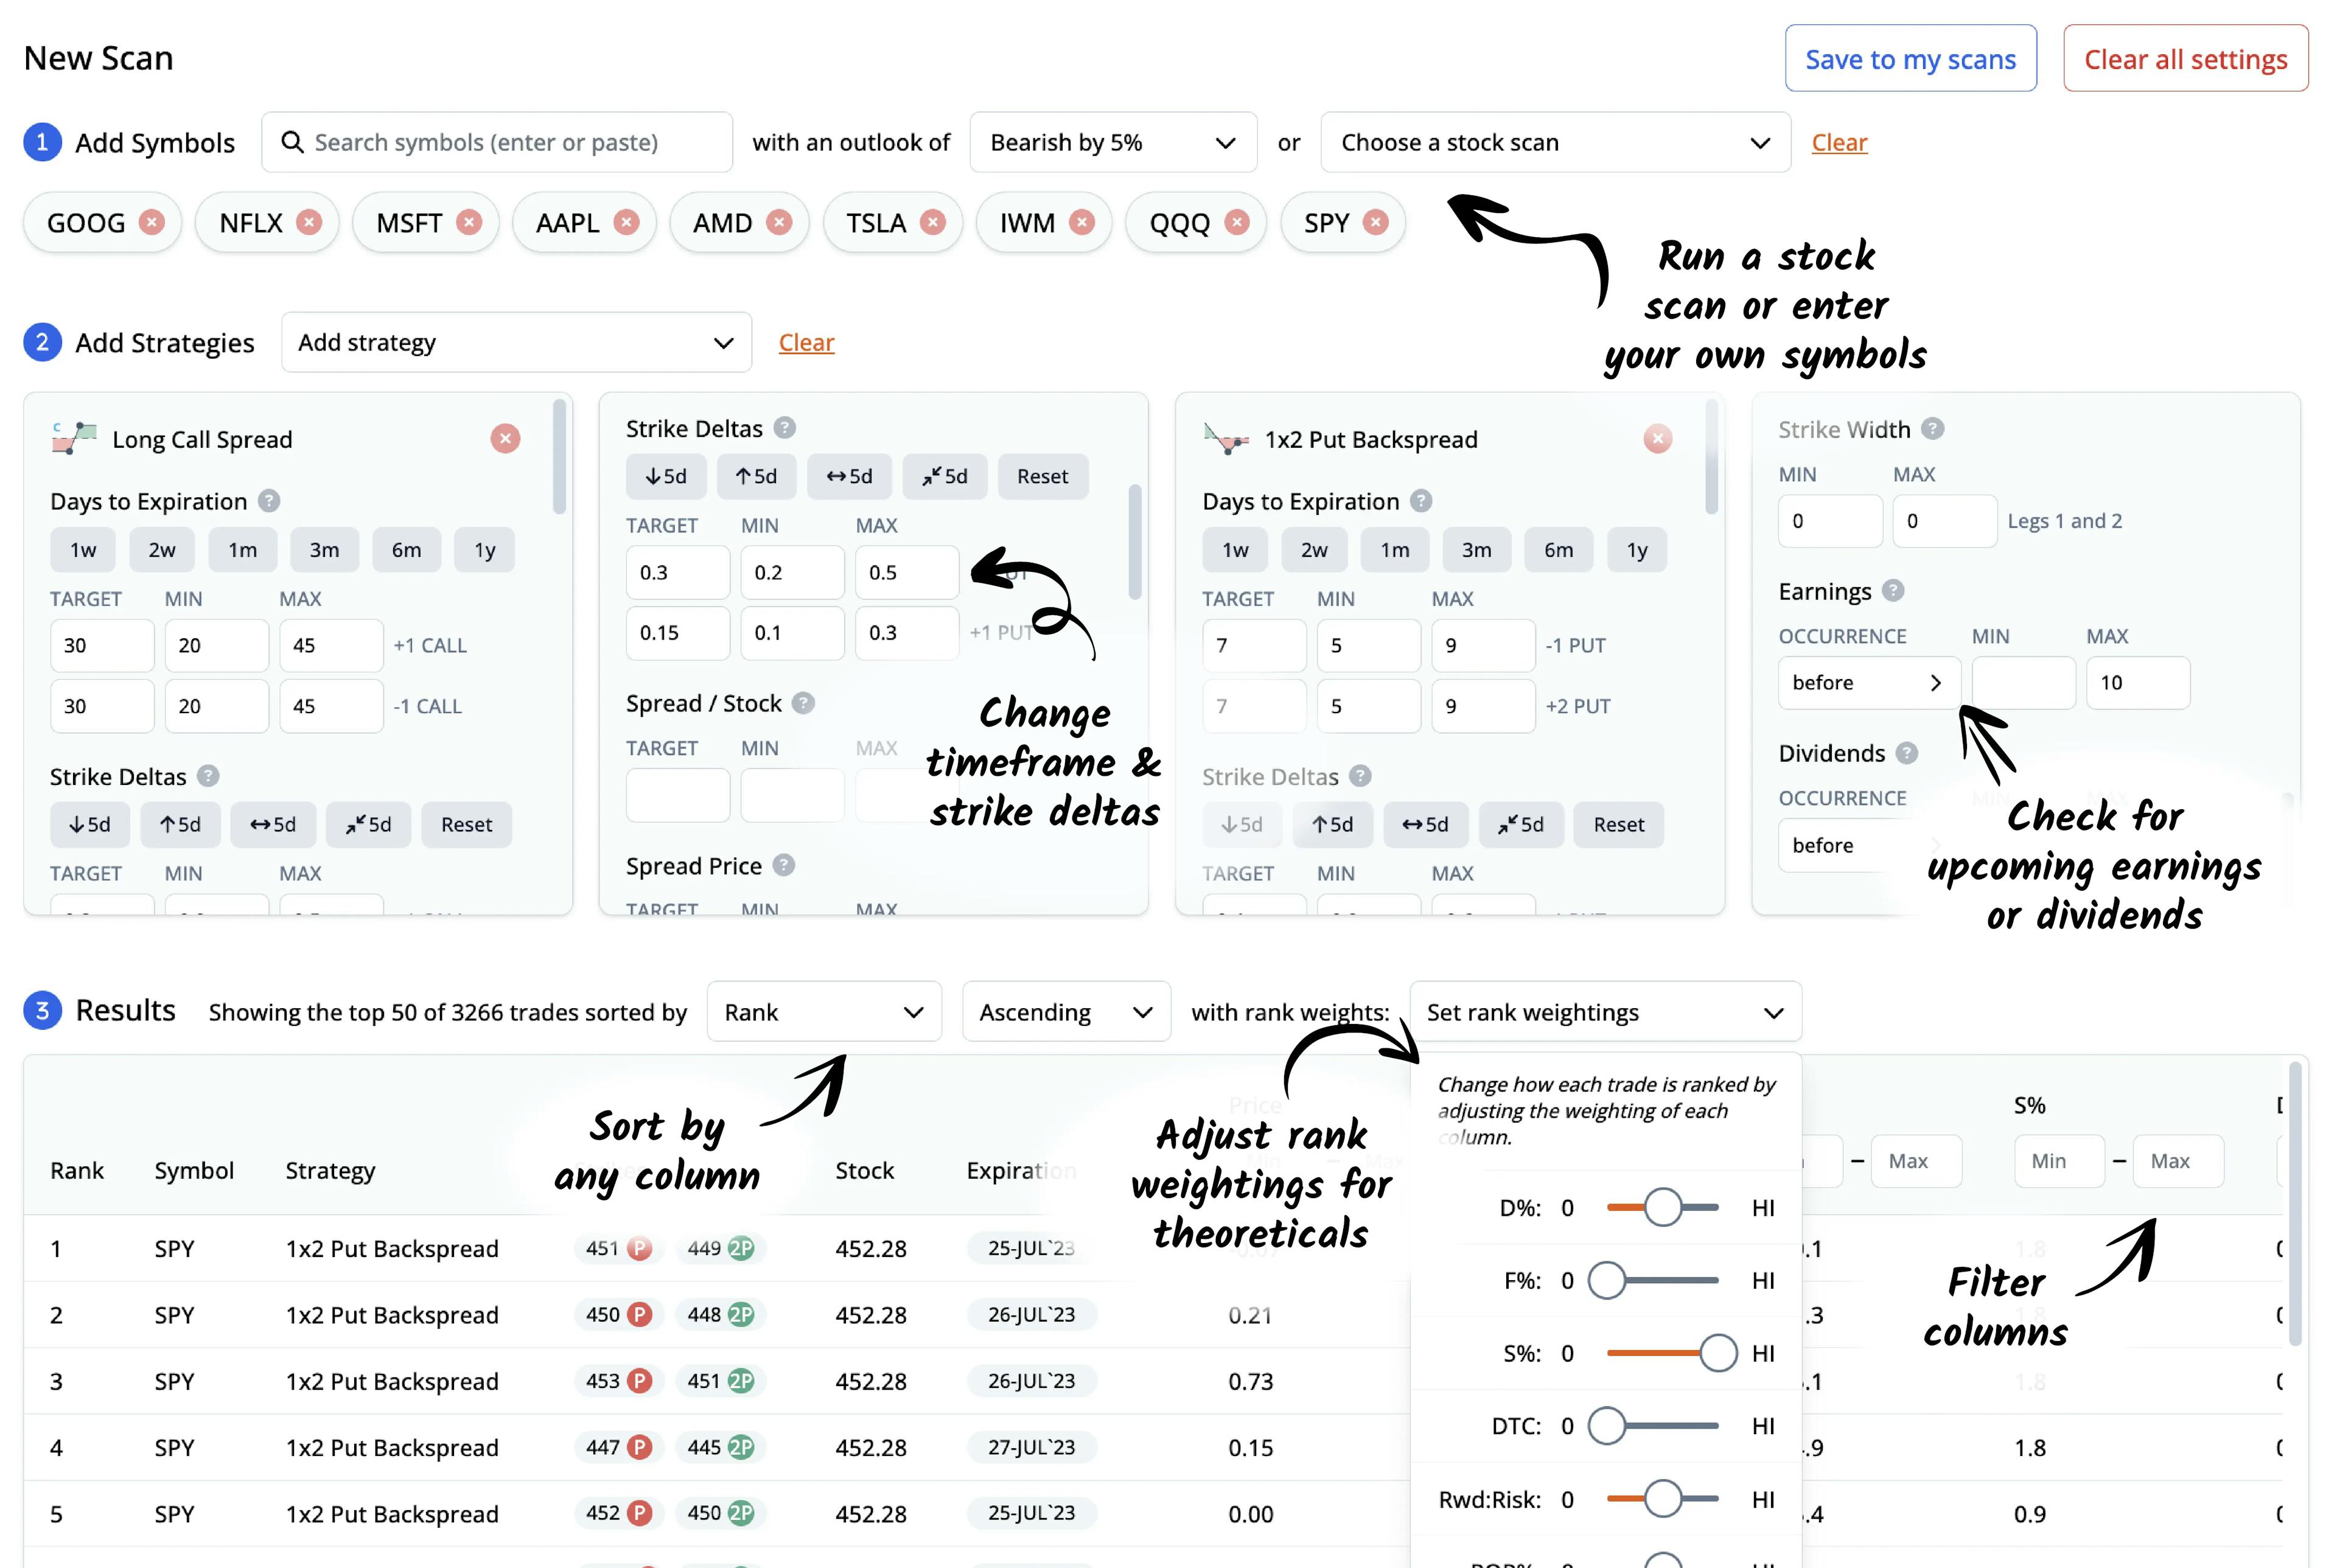
Option Scanner
Scan and rank thousands of option trades based on volatility metrics, delta cost, and other theoretical values. Customize DTE, strikes, and more.
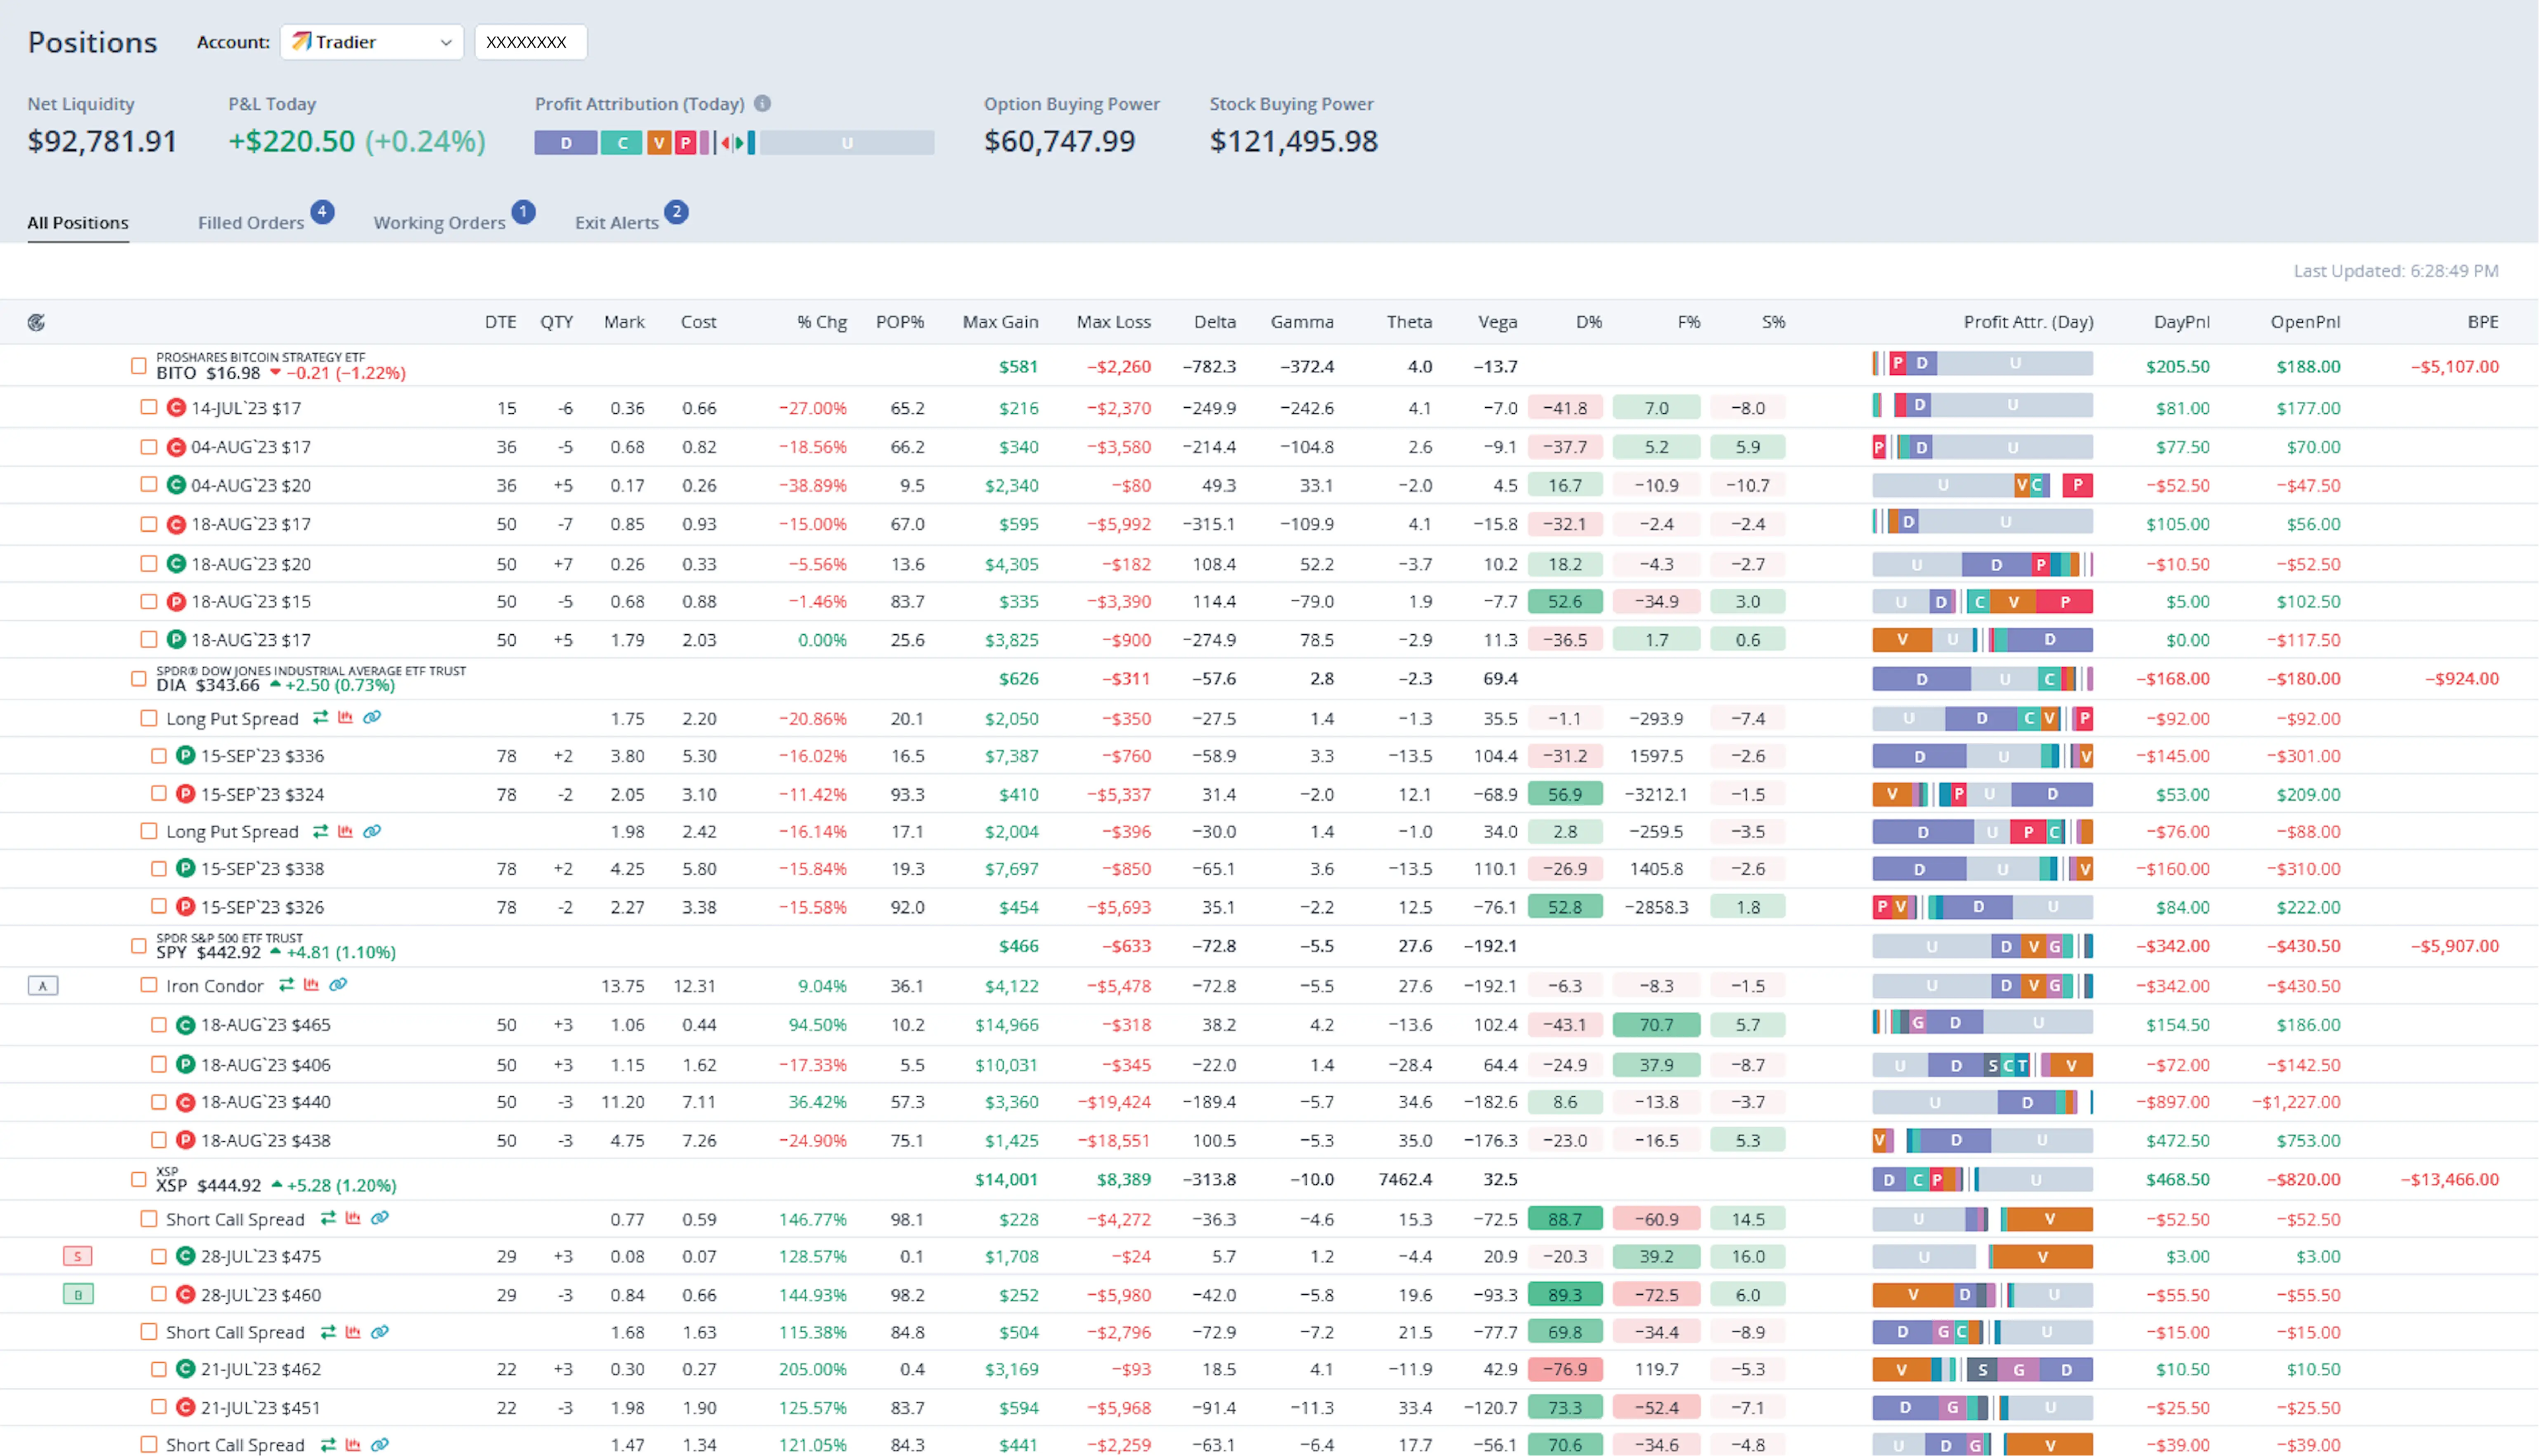
Trading
Send orders through your favorite broker and monitor your positions with text and email alerts. Or, paper trade your strategies in a safe and risk-free environment.
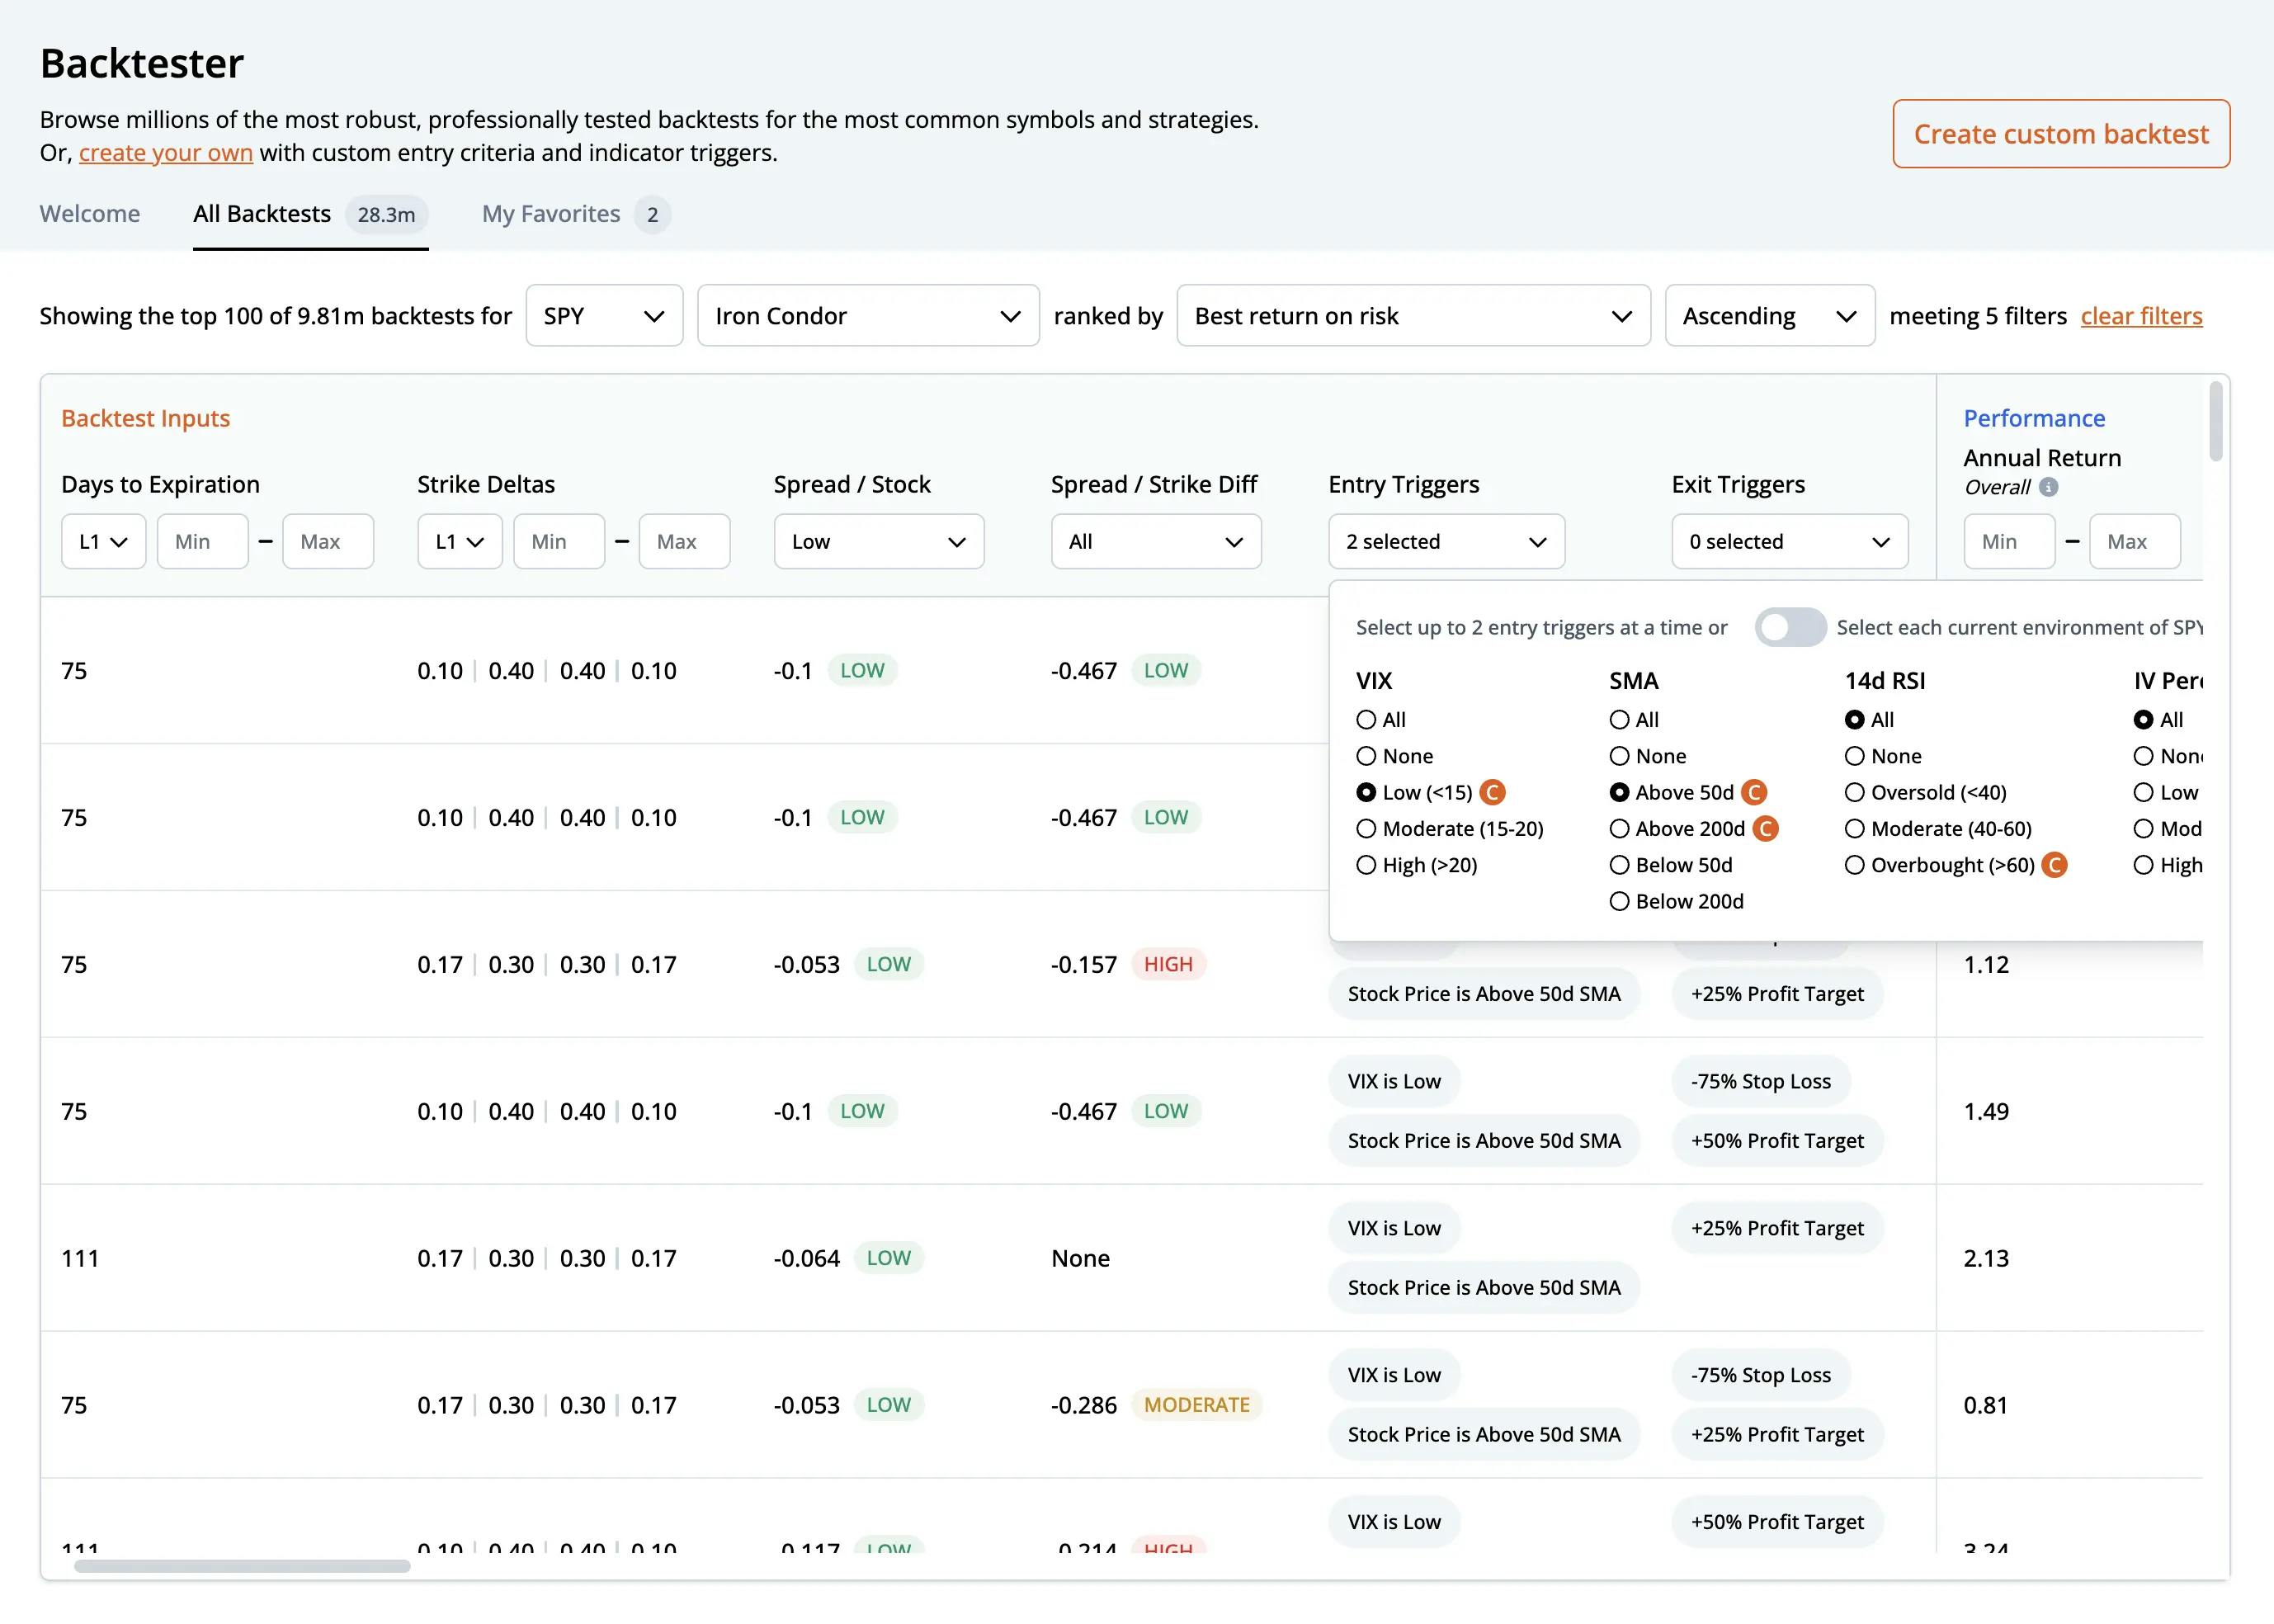
Options Backtester
Browse millions of options backtests! Our best-in-class backtesting engine goes back to 2007. You can also run your own custom backtests for over 5,000 symbols and 25 strategies.
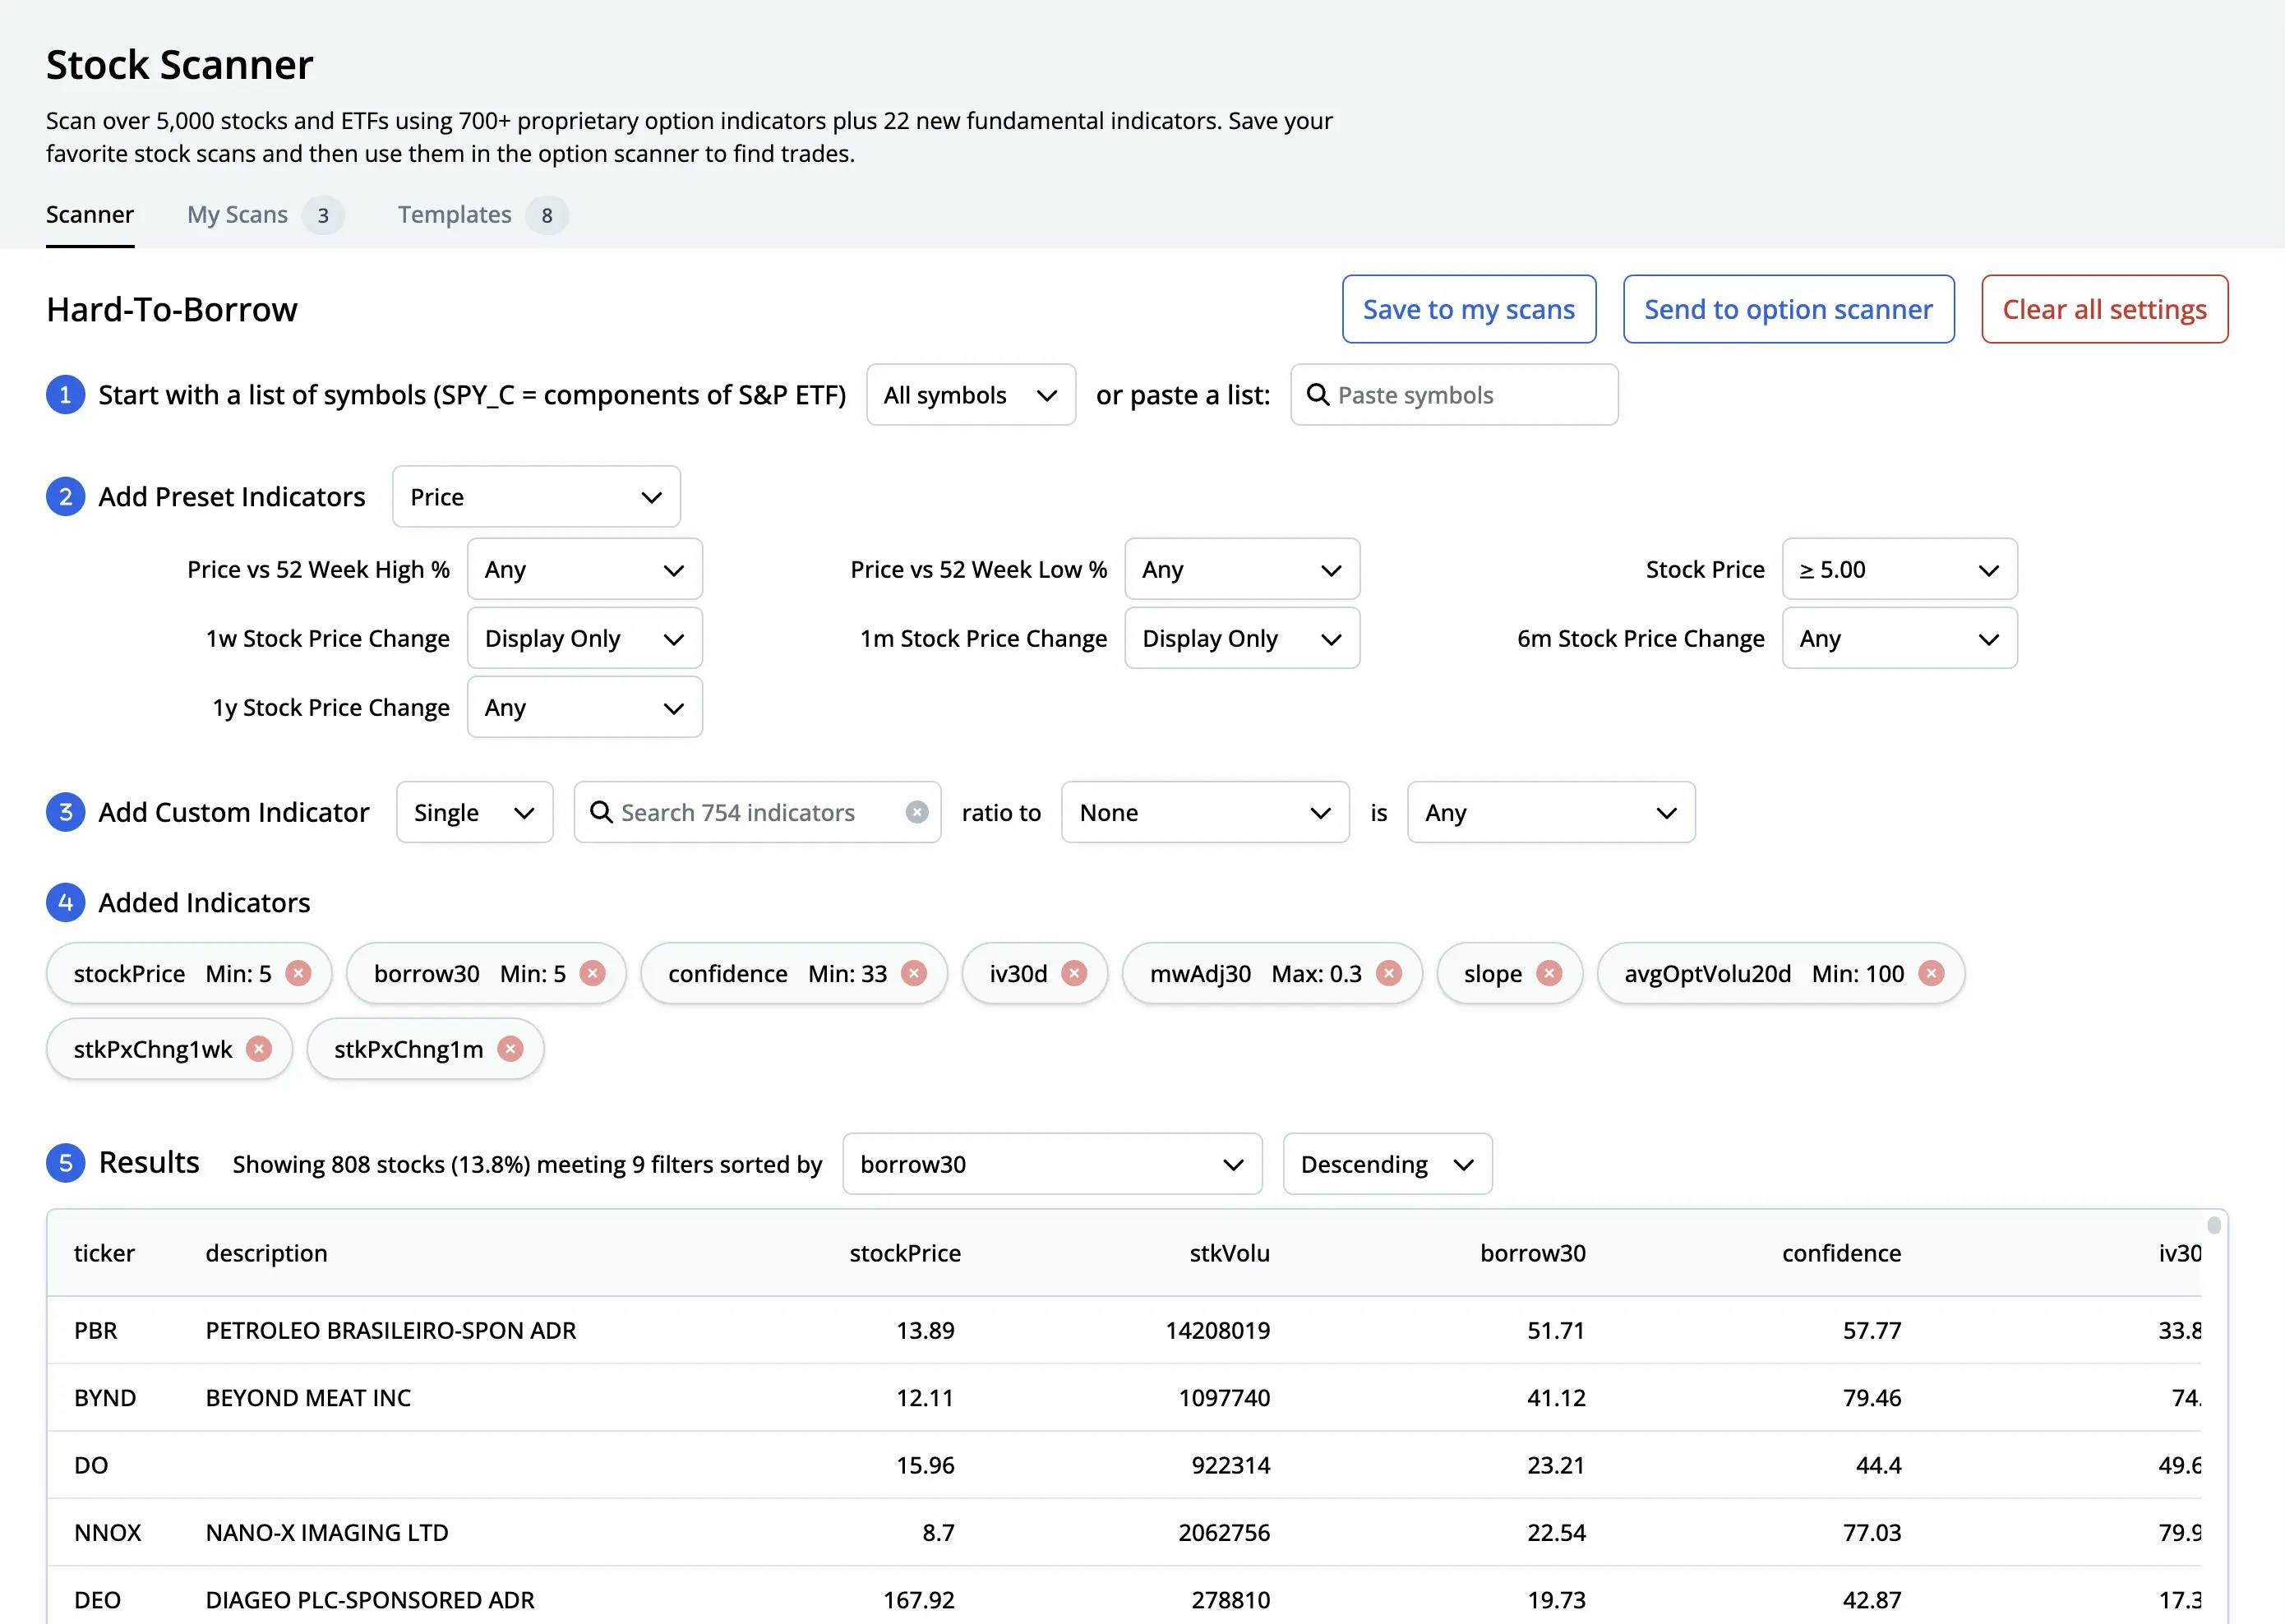
Stock Scanner
Scan over 5,000 stocks and ETFs using 700+ proprietary option indicators plus 22 new fundamental indicators.
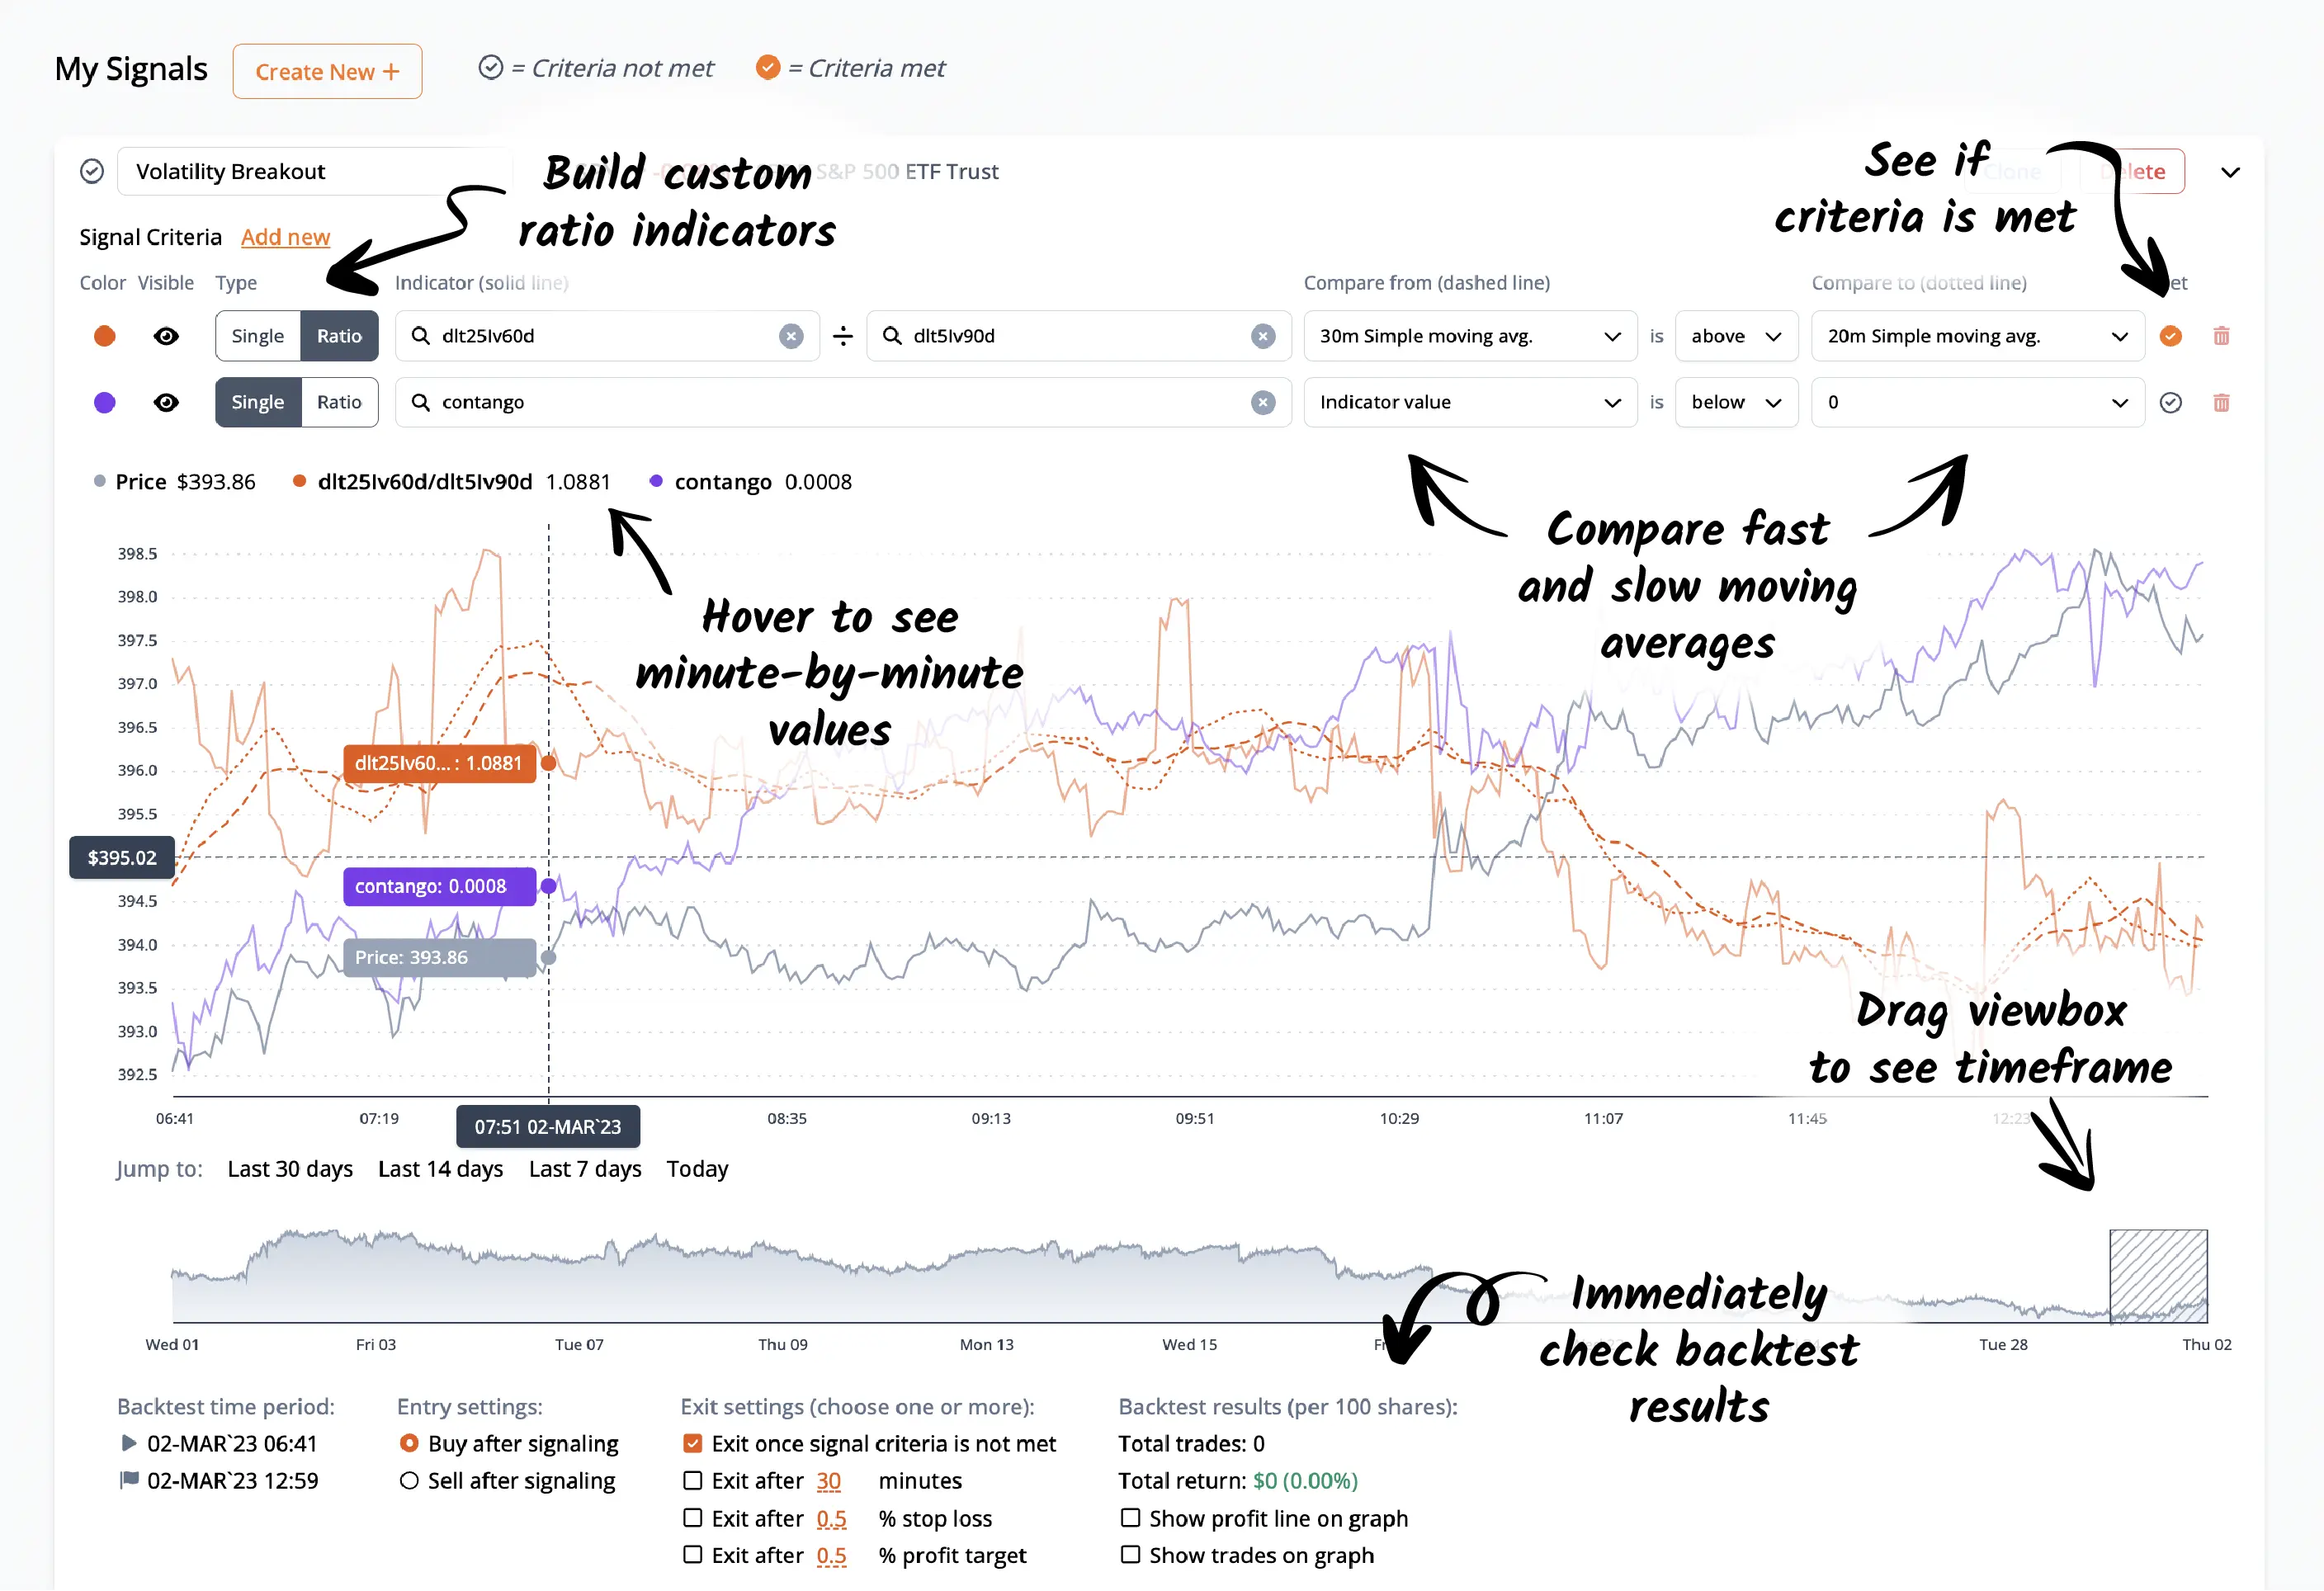
Signal Builder
Create and backtest custom intraday (one-minute) signals with fast and slow moving averages, RSI, and criteria values from over 80 ORATS indicators.
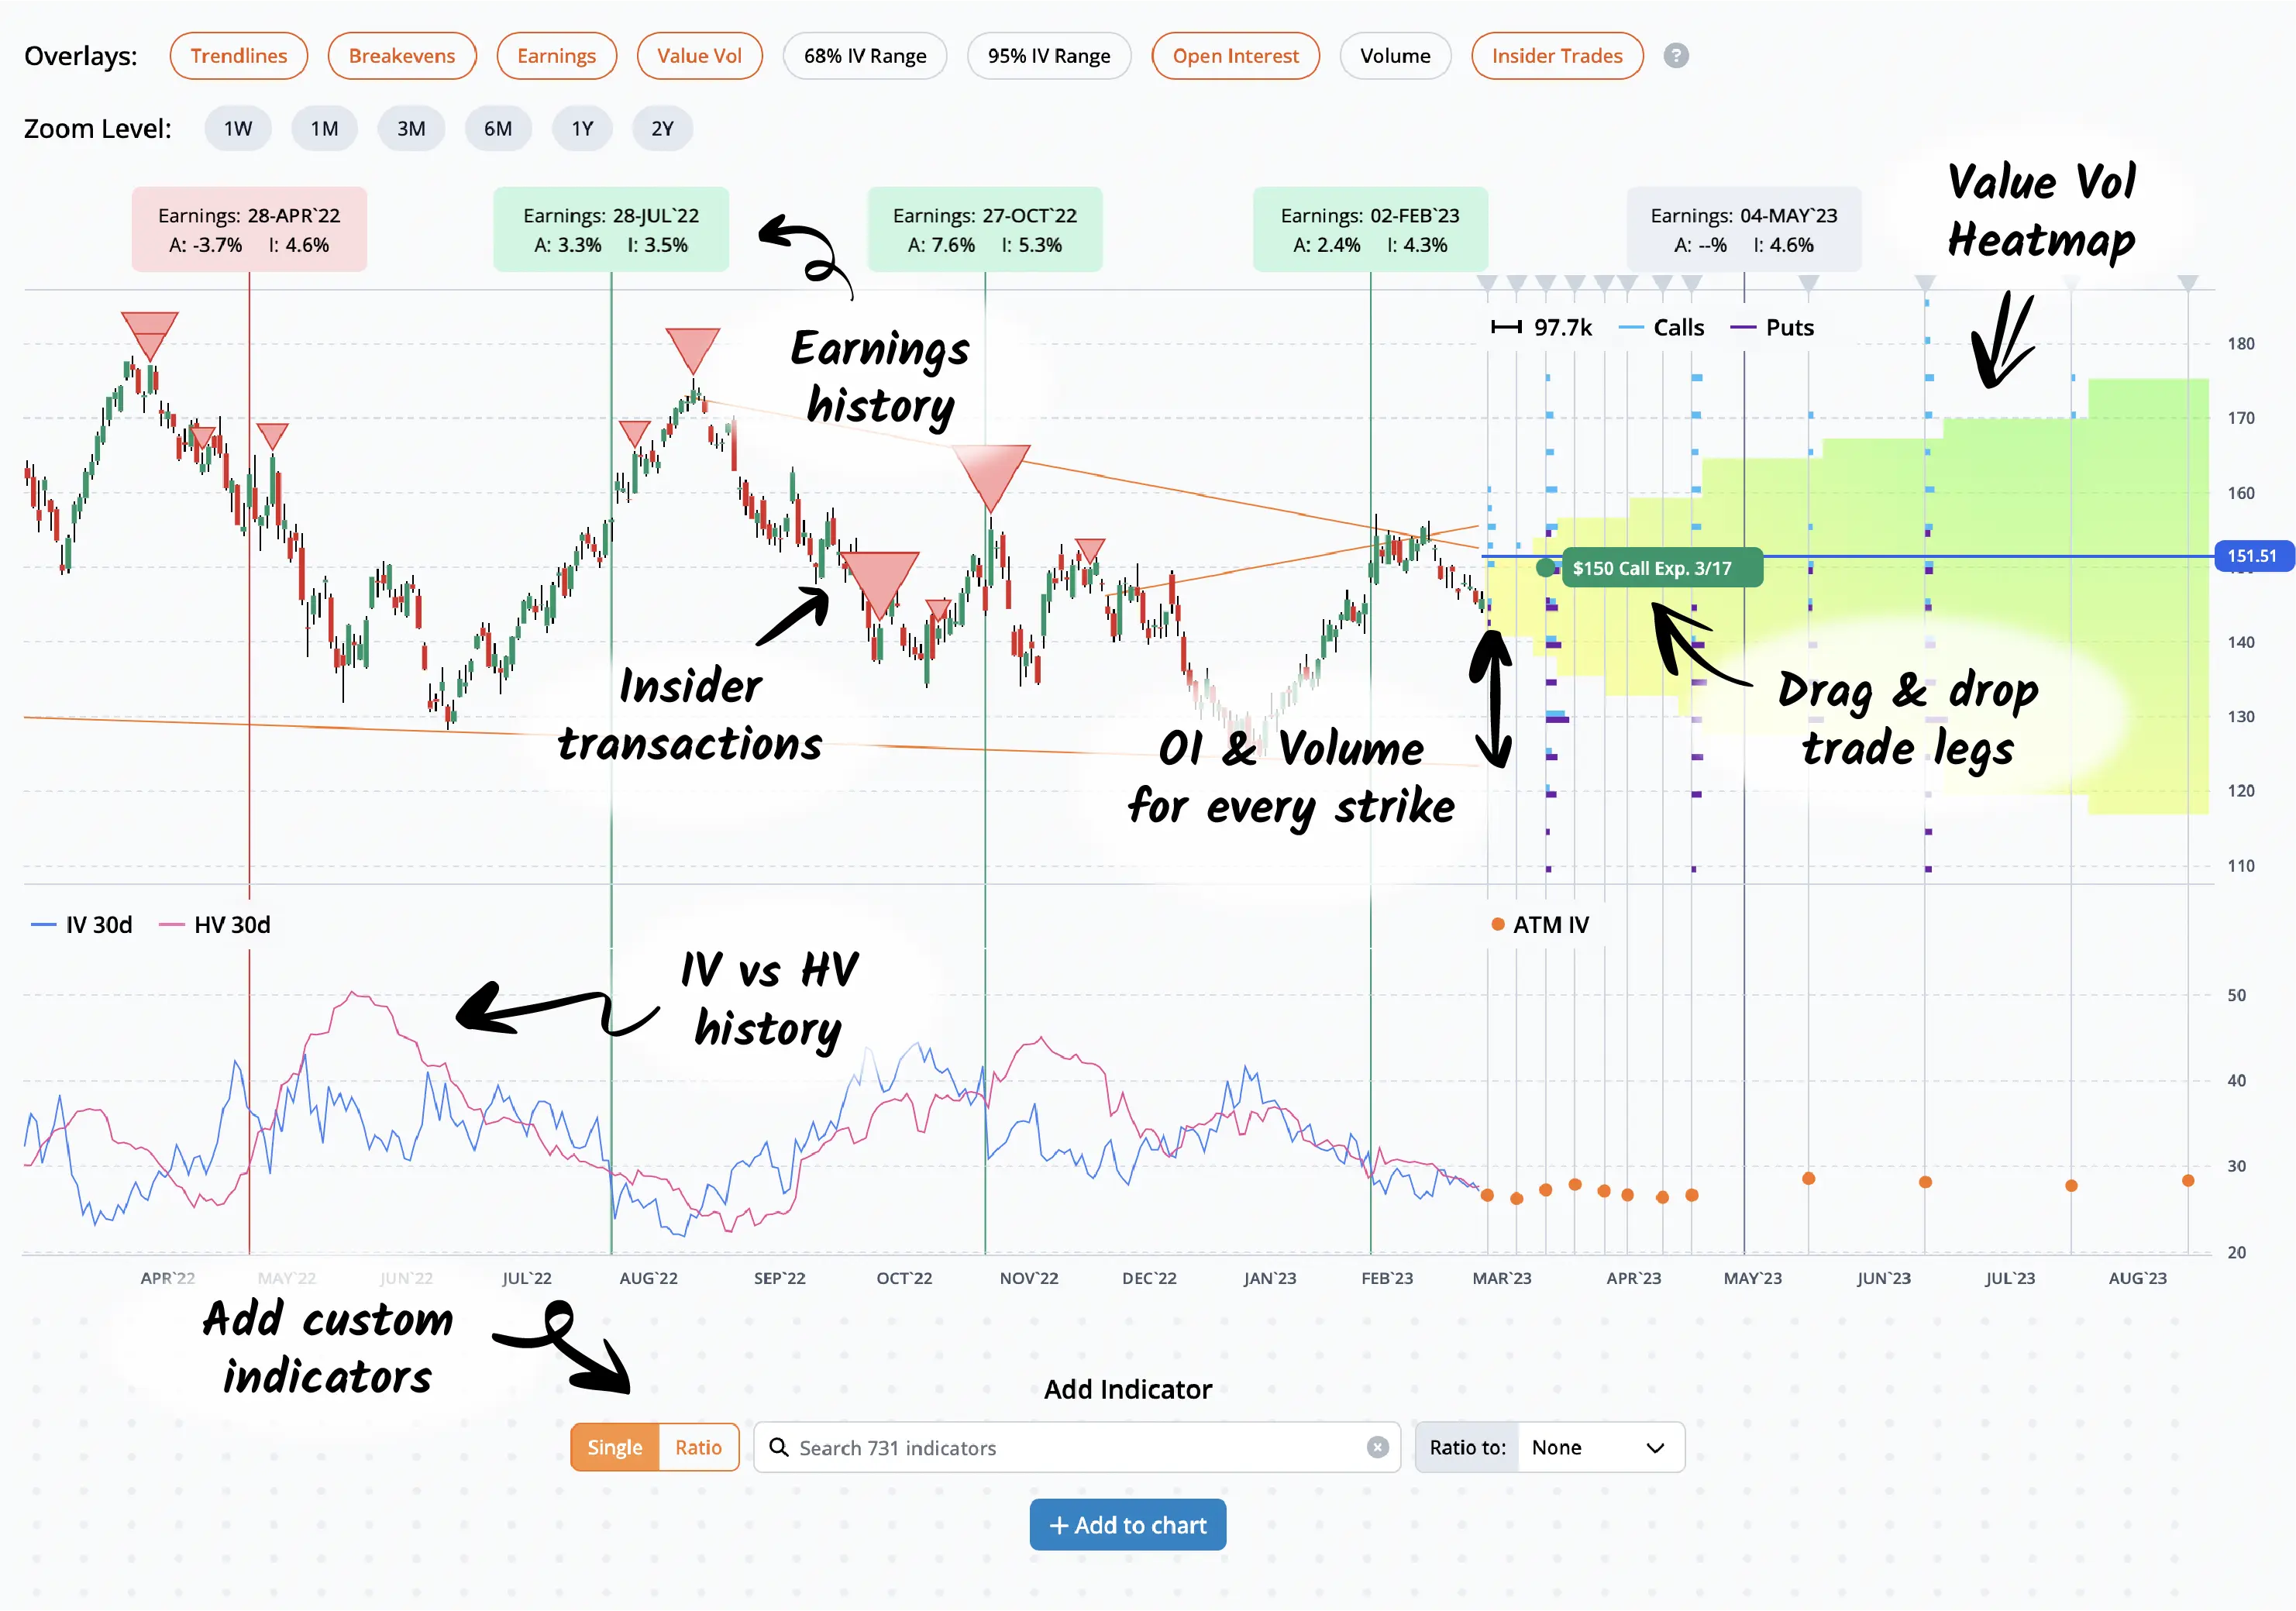
Trade Builder
Chart future expirations and strikes with overlays for earnings, trendlines, volatility, open interest, and more.
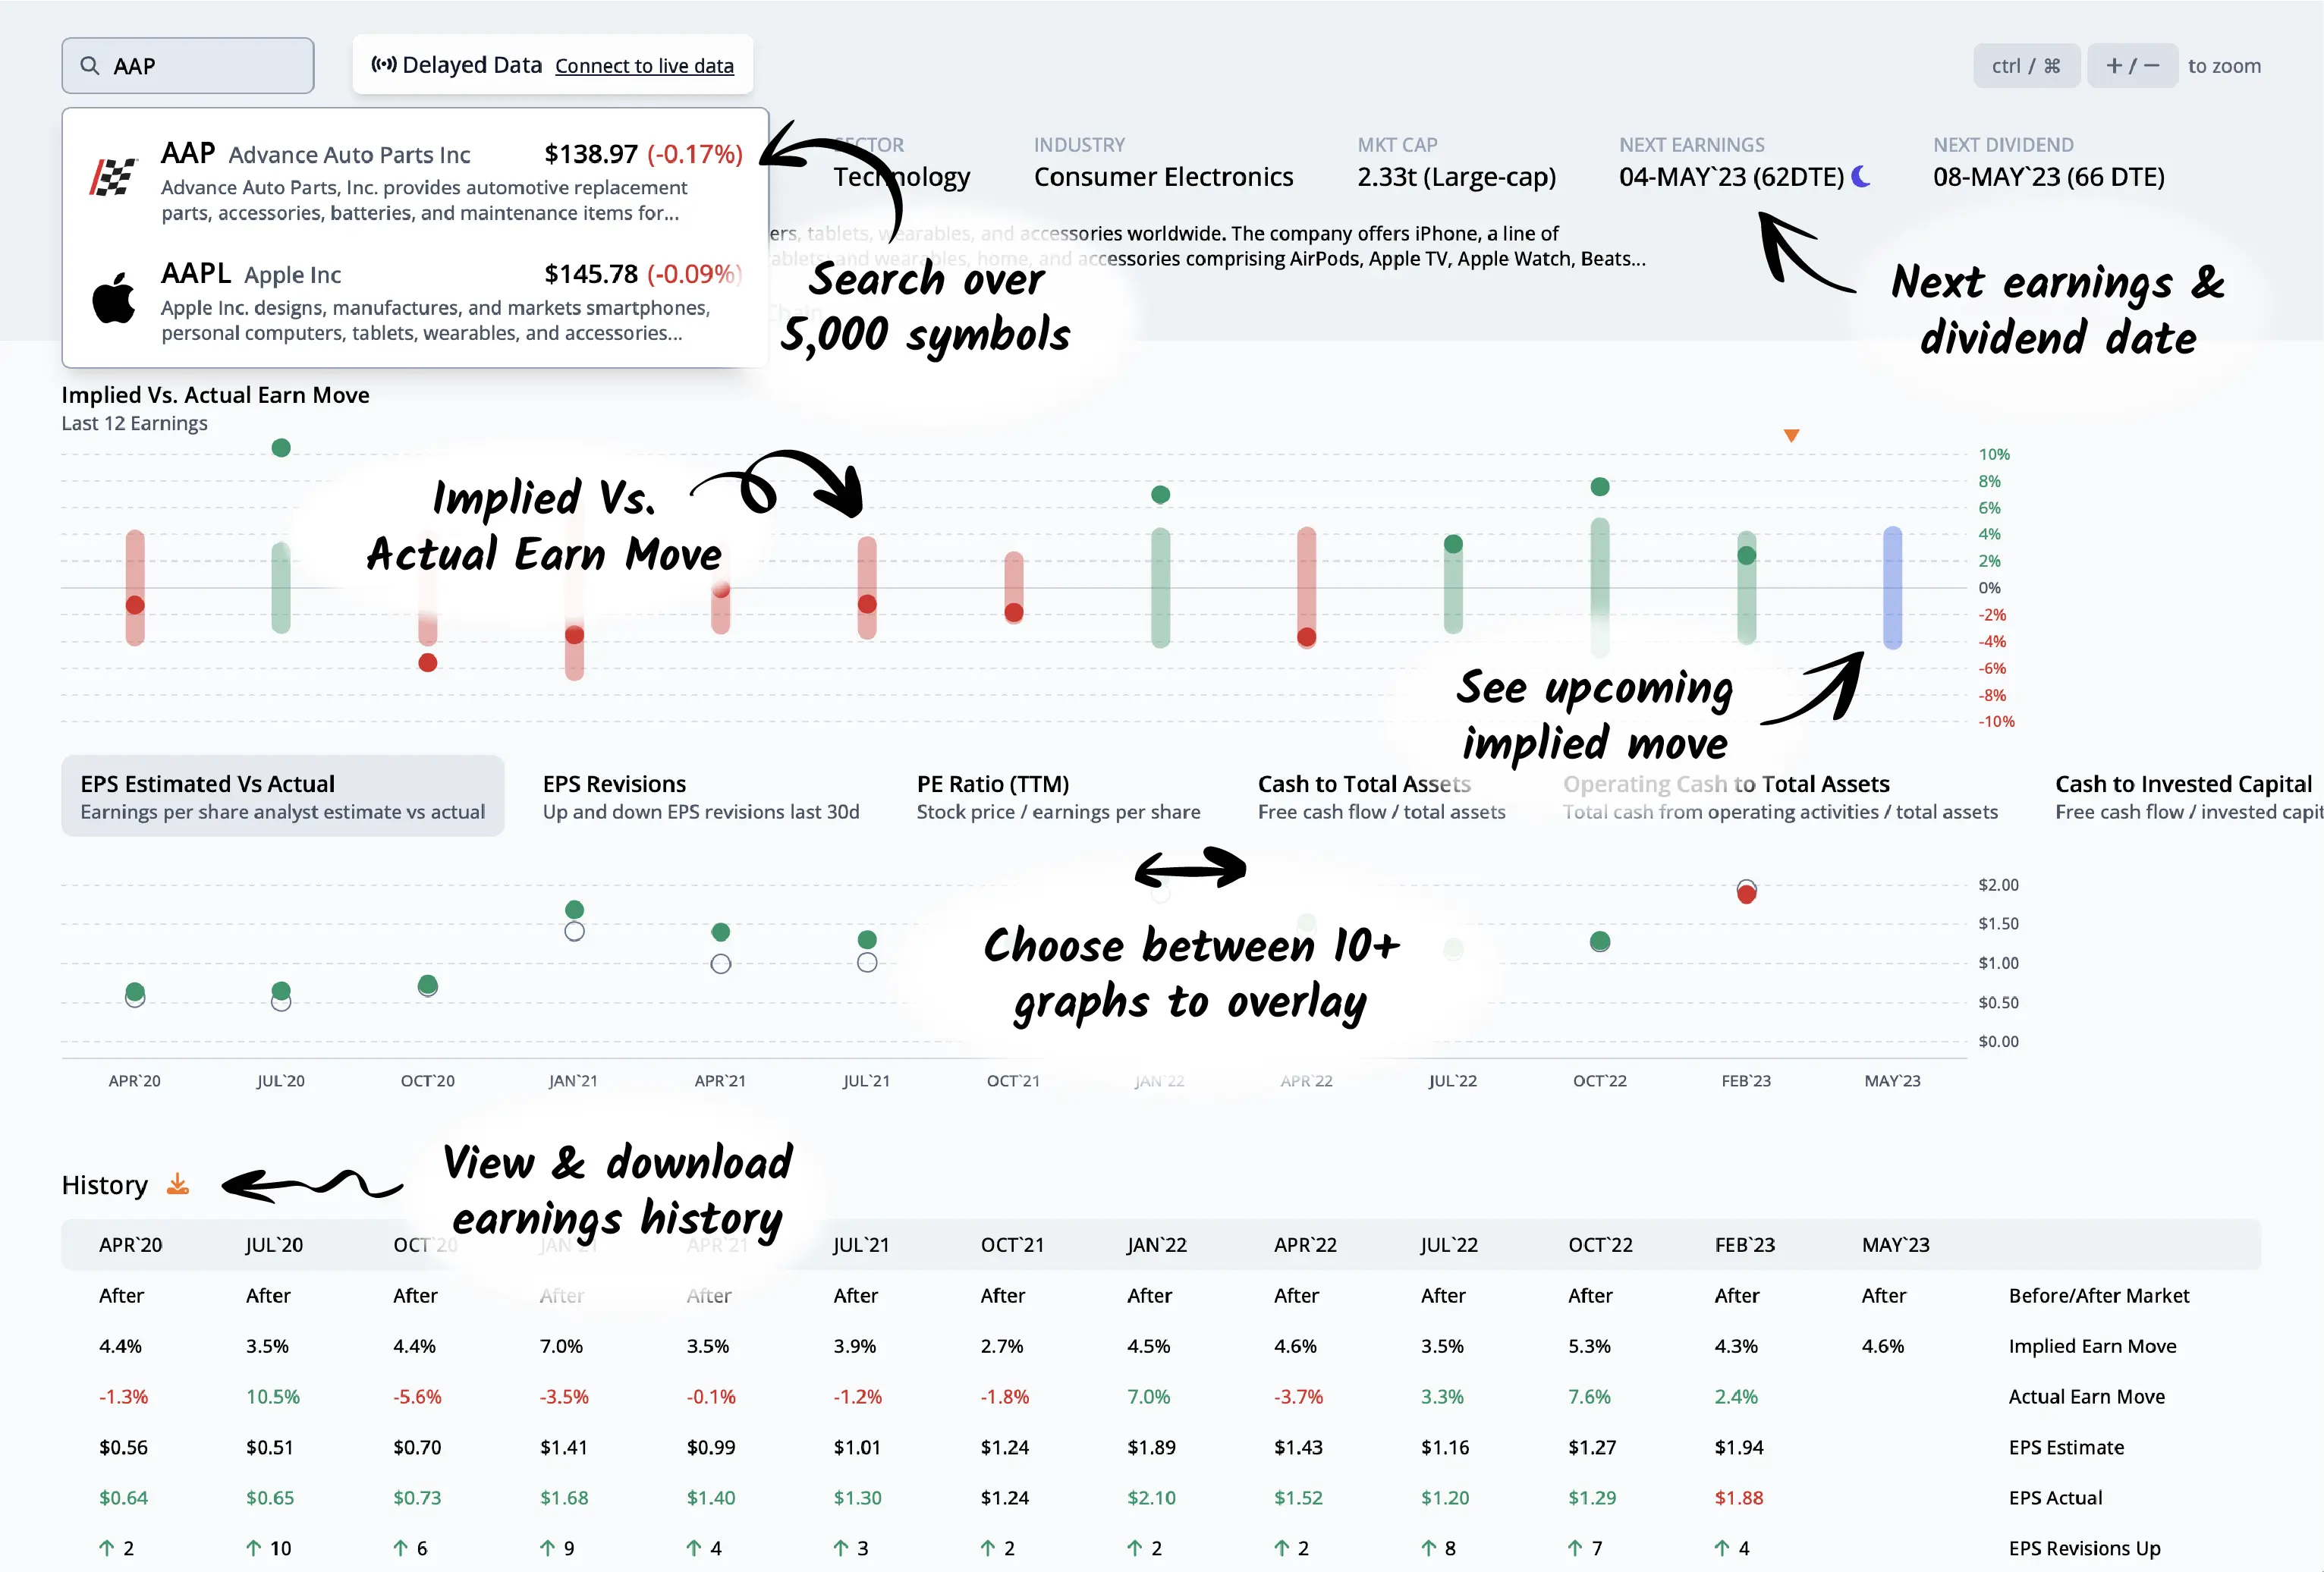
Earnings & Financials
View and download historical earnings information and quarterly financial data for any stock.

Data API
Get live, delayed, and historical end-of-day options data back to 2007 augmented with hundreds of proprietary indicators.
{ "data": [ { "ticker": "AAPL", "tradeDate": "2023-04-06", "expirDate": "2023-09-15", "dte": 163, "strike": 175, "stockPrice": 164.42, "callVolume": 624, "callBidSize": 50, ...Near End-of-day - Since 2007
A complete snapshot of the US equity options market 14 minutes before the close of trading each day. Over 5,000 symbols included.
1 Minute Intraday - Since Aug. 2020
Full SMV greeks, theoretical values, and IVs for every minute during the trading day of all US equity options. Over 5,000 symbols included.
2 Minute Snapshot - Since 2015
Raw options market information snapped with underlying prices every two minutes during the day. Over 5,000 symbols included.

