Earnings
Wednesday, August 5th 2026
Most of the Earnings Volatility Drop Is Knowable in Advance
Across 1,978 quarterly reports, the predictable earnings premium accounted for most of the decline in 30-day implied volatility after the event.
Summary
Most of the drop in 30‑day implied volatility after earnings is predictable: a median 20% markdown of the headline vol, driven by a known earnings “hump,” accounts for most of the decline, while the remaining base move is smaller and less informative. This pattern holds across thousands of quarterly reports, showing that the earnings‑related volatility premium can be quantified in advance, though its profitability depends on the actual price move versus the priced expectation.

By Matt Amberson
August 5, 2026
Across 1,978 liquid quarterly prints since September 2021, a stock's headline 30-day implied vol fell on 97.3% of them, a median 17.6%. That is the drop the earnings-vol notes sell as the payoff for being short a print, and almost none of it is news. It is the earnings hump leaving the 30-day window, and the hump sits on the screen the day before: a median 20.0% markdown whose yearly median has stayed between 18.4% and 20.6% for six straight years.
ORATS splits the 30-day number into exErnIv30d for ordinary days plus the hump on top. After the report there is no hump, so the drop is that known discount times whatever happened to the base. There is no third term. The identity is exact event by event, but medians of different ratios do not multiply, which is why the 20.0% markdown reads larger than the 17.6% drop it produces.
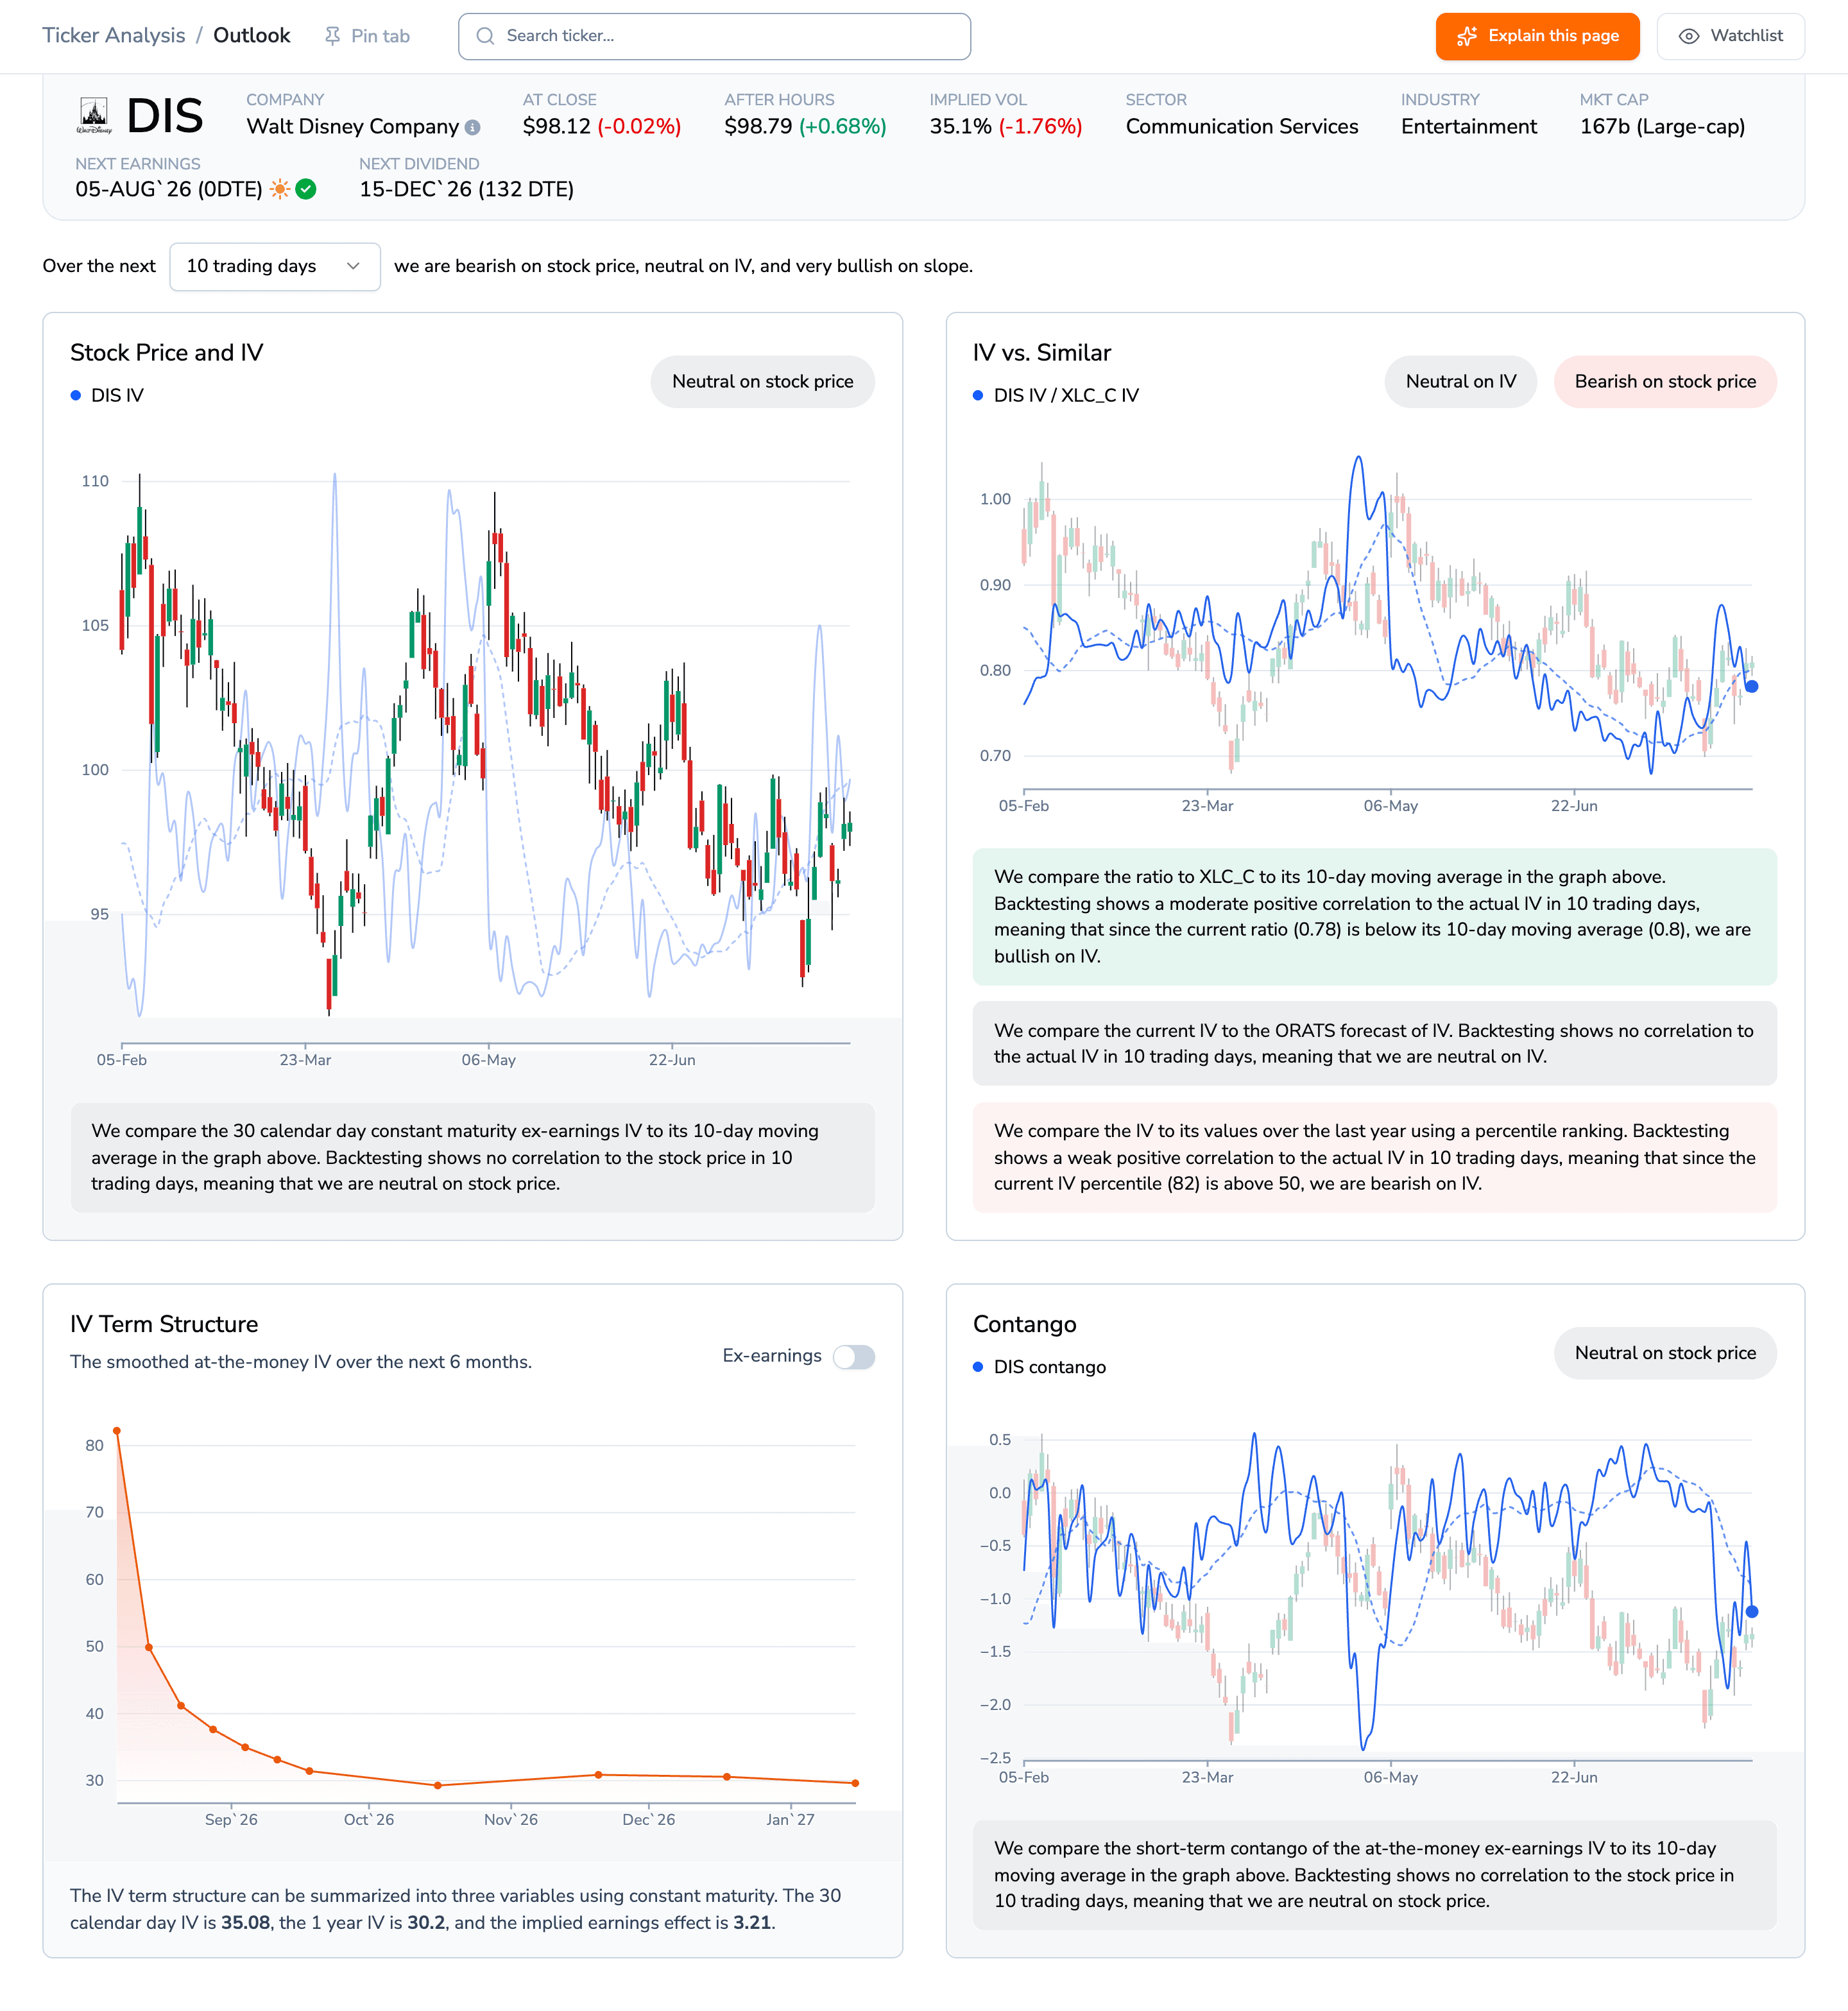
Disney Outlook page on the ORATS dashboard, showing next earnings 05-AUG-26 at 0 DTE and an IV term structure card whose curve starts above 80 at the nearest expiry and falls to about 30 by October.
Disney reports before Wednesday's open, and the hump is the spike at the front of that curve. At Tuesday's settle its headline read 35.71 against an ex-earnings 29.38, a 17.7% markdown. The card's 35.08 is the live tick and its implied earnings effect is a different solve. Source: ORATS Ticker Analysis Outlook.
The leftover depends on where you start measuring
The known piece is the bigger number and the reliable one: a median 20.0% of the headline, a discount on every print in the panel, against a base move of a median 7.5% that runs both ways. That is why the size of the drop is predictable at all. It says nothing about whether the premium was worth selling, which turns on the delivered move against the priced one.
You still cannot read the base move as news, because the fit moves it too. Anchor a week earlier instead of the night before and the same base finishes a median 3.0% lower, not higher.
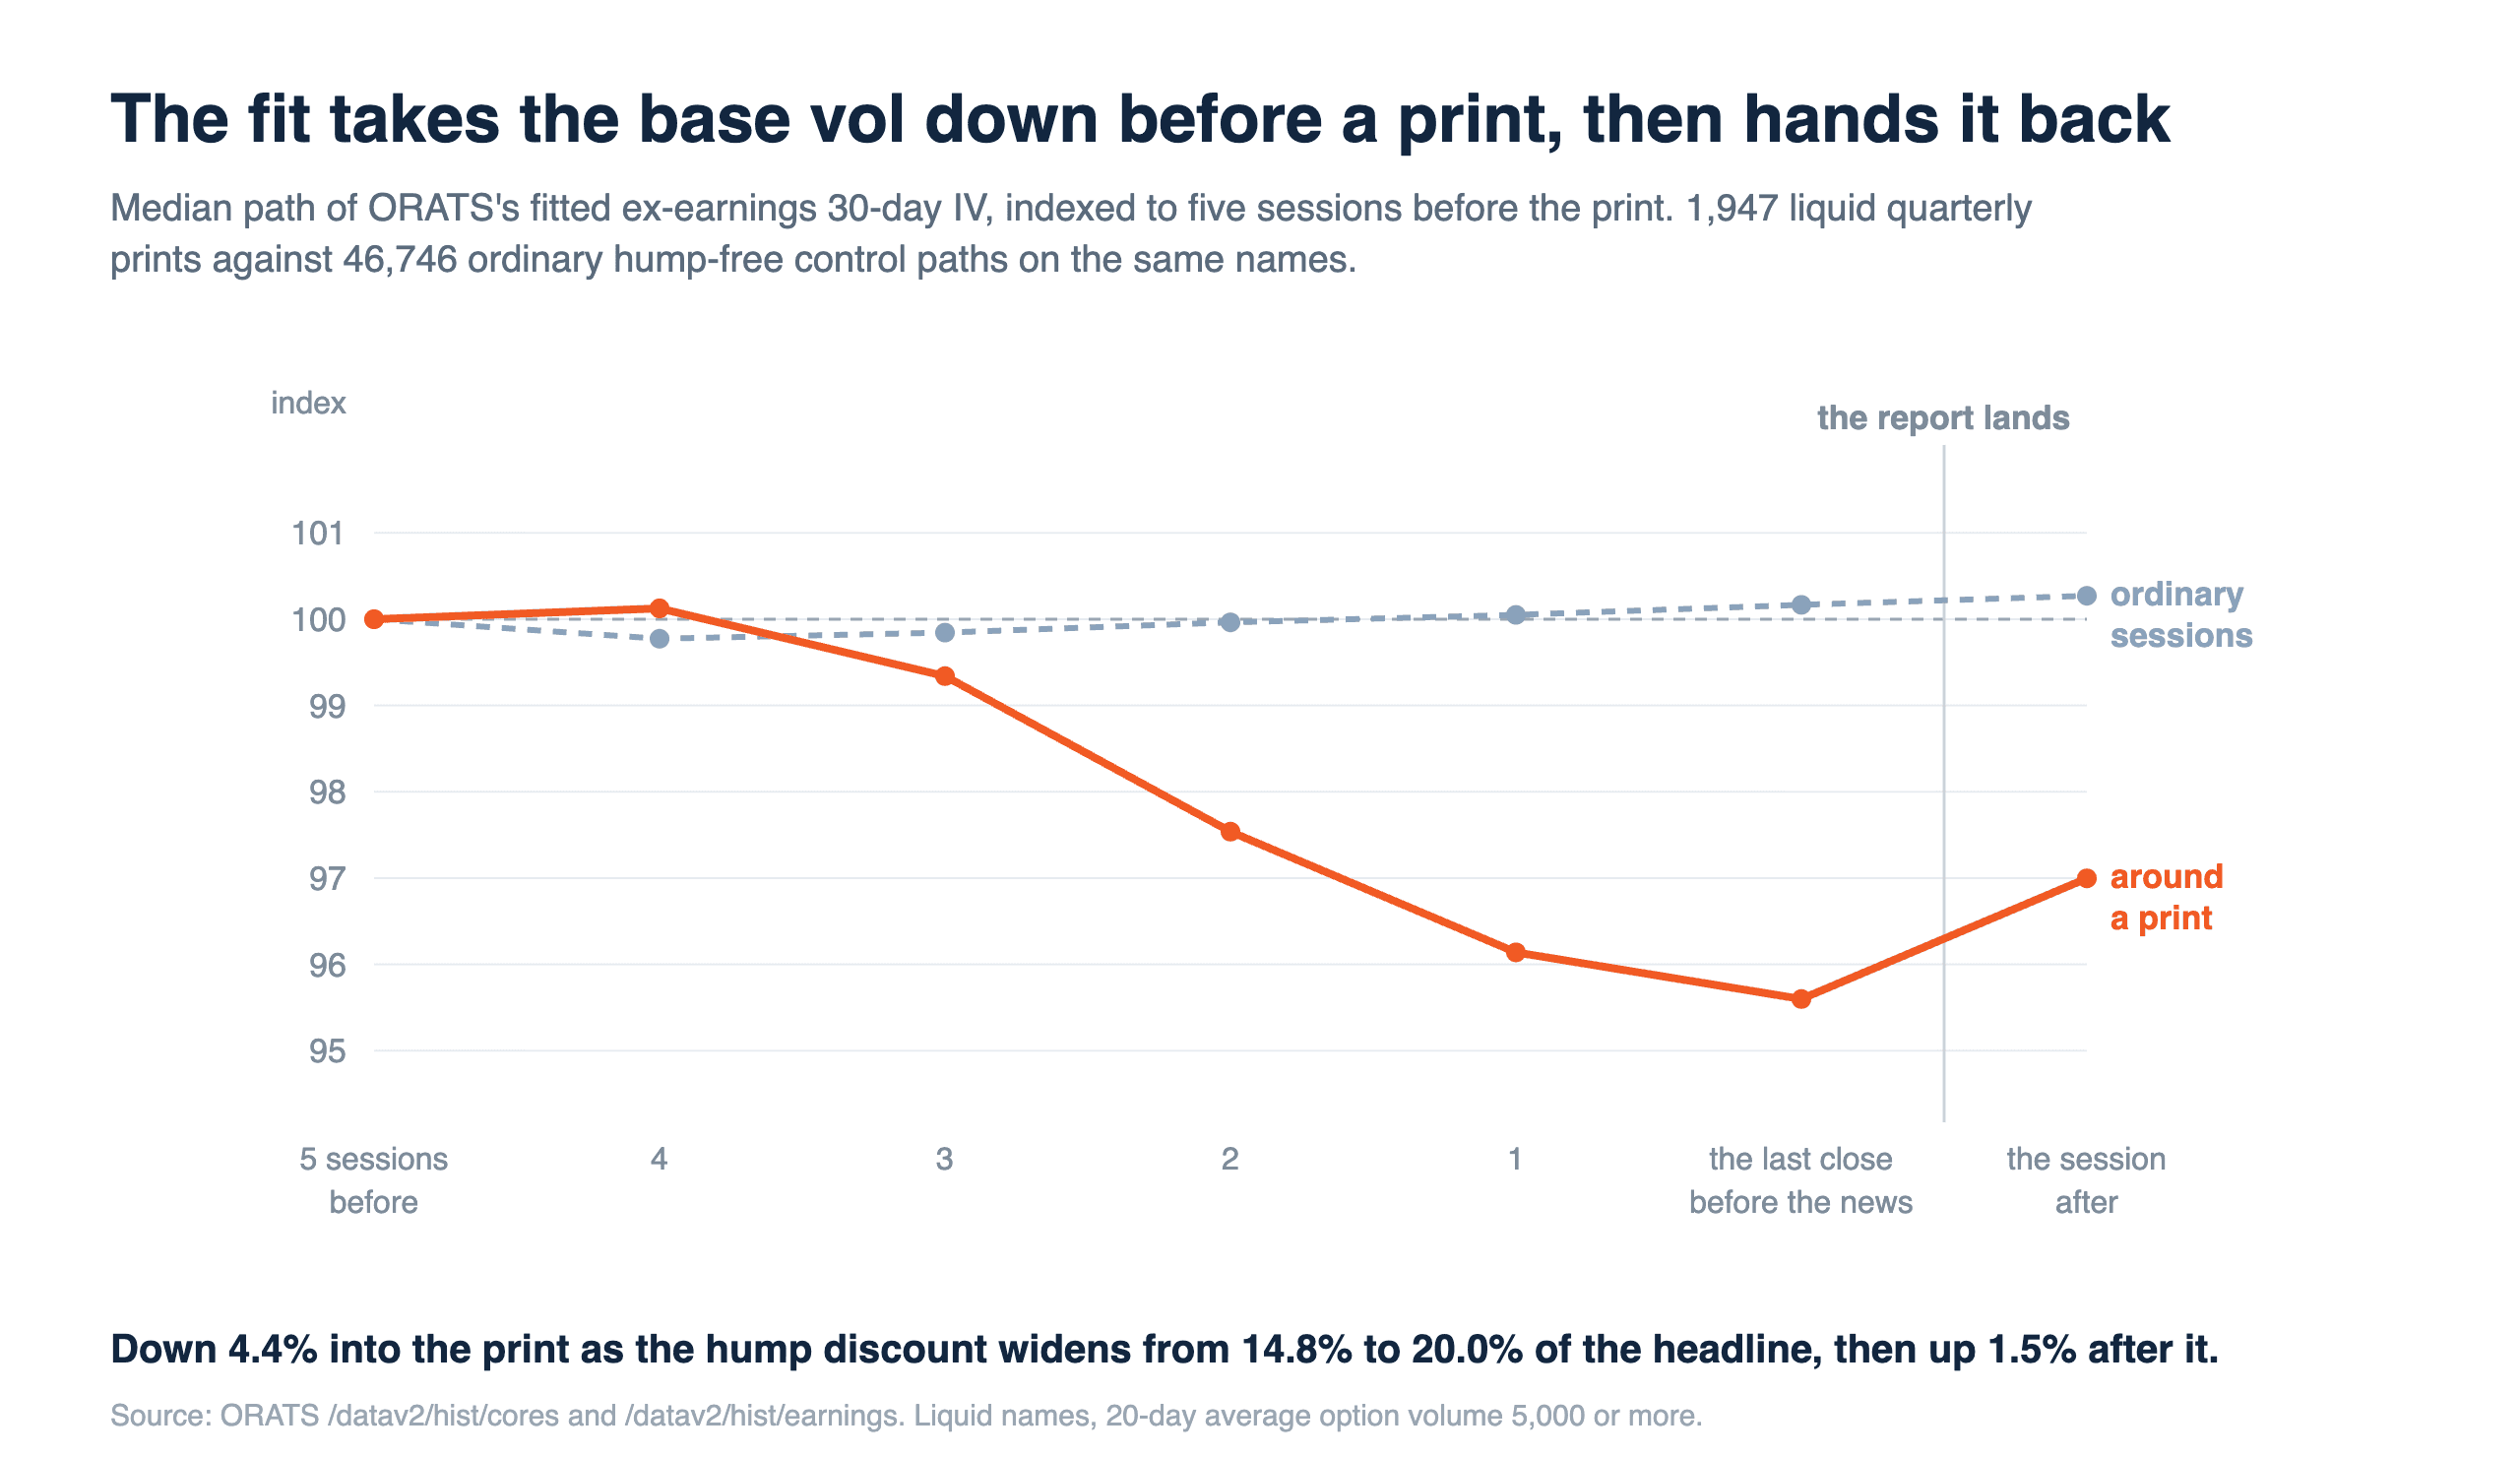
Line chart of the median path of ORATS fitted ex-earnings 30-day implied vol, indexed to 100 five sessions before a print. The orange earnings line falls to 95.6 by the last close before the news and rebounds to 97.0, while the grey ordinary-session line stays flat near 100.
Into a print the fitted base slides a median 4.4% lower while the hump discount widens from 14.8% to 20.0% of the headline, then it rises 1.5% the morning after. Grey is the same seven sessions on ordinary hump-free days, over the 1,947 prints with five clean sessions in front. Source: ORATS /datav2/hist/cores and /datav2/hist/earnings.
A size-matched control settles it. Where a print first enters the 30-day window the fit splits a median 2.6% of the headline and the base moves 3.0%. At roll-ins splitting 15% or more of the headline, matching how much the fit splits the night before a real report, the base moves 14.9%, twice the print's own 7.5%.
The Same Trap on Two Live Names
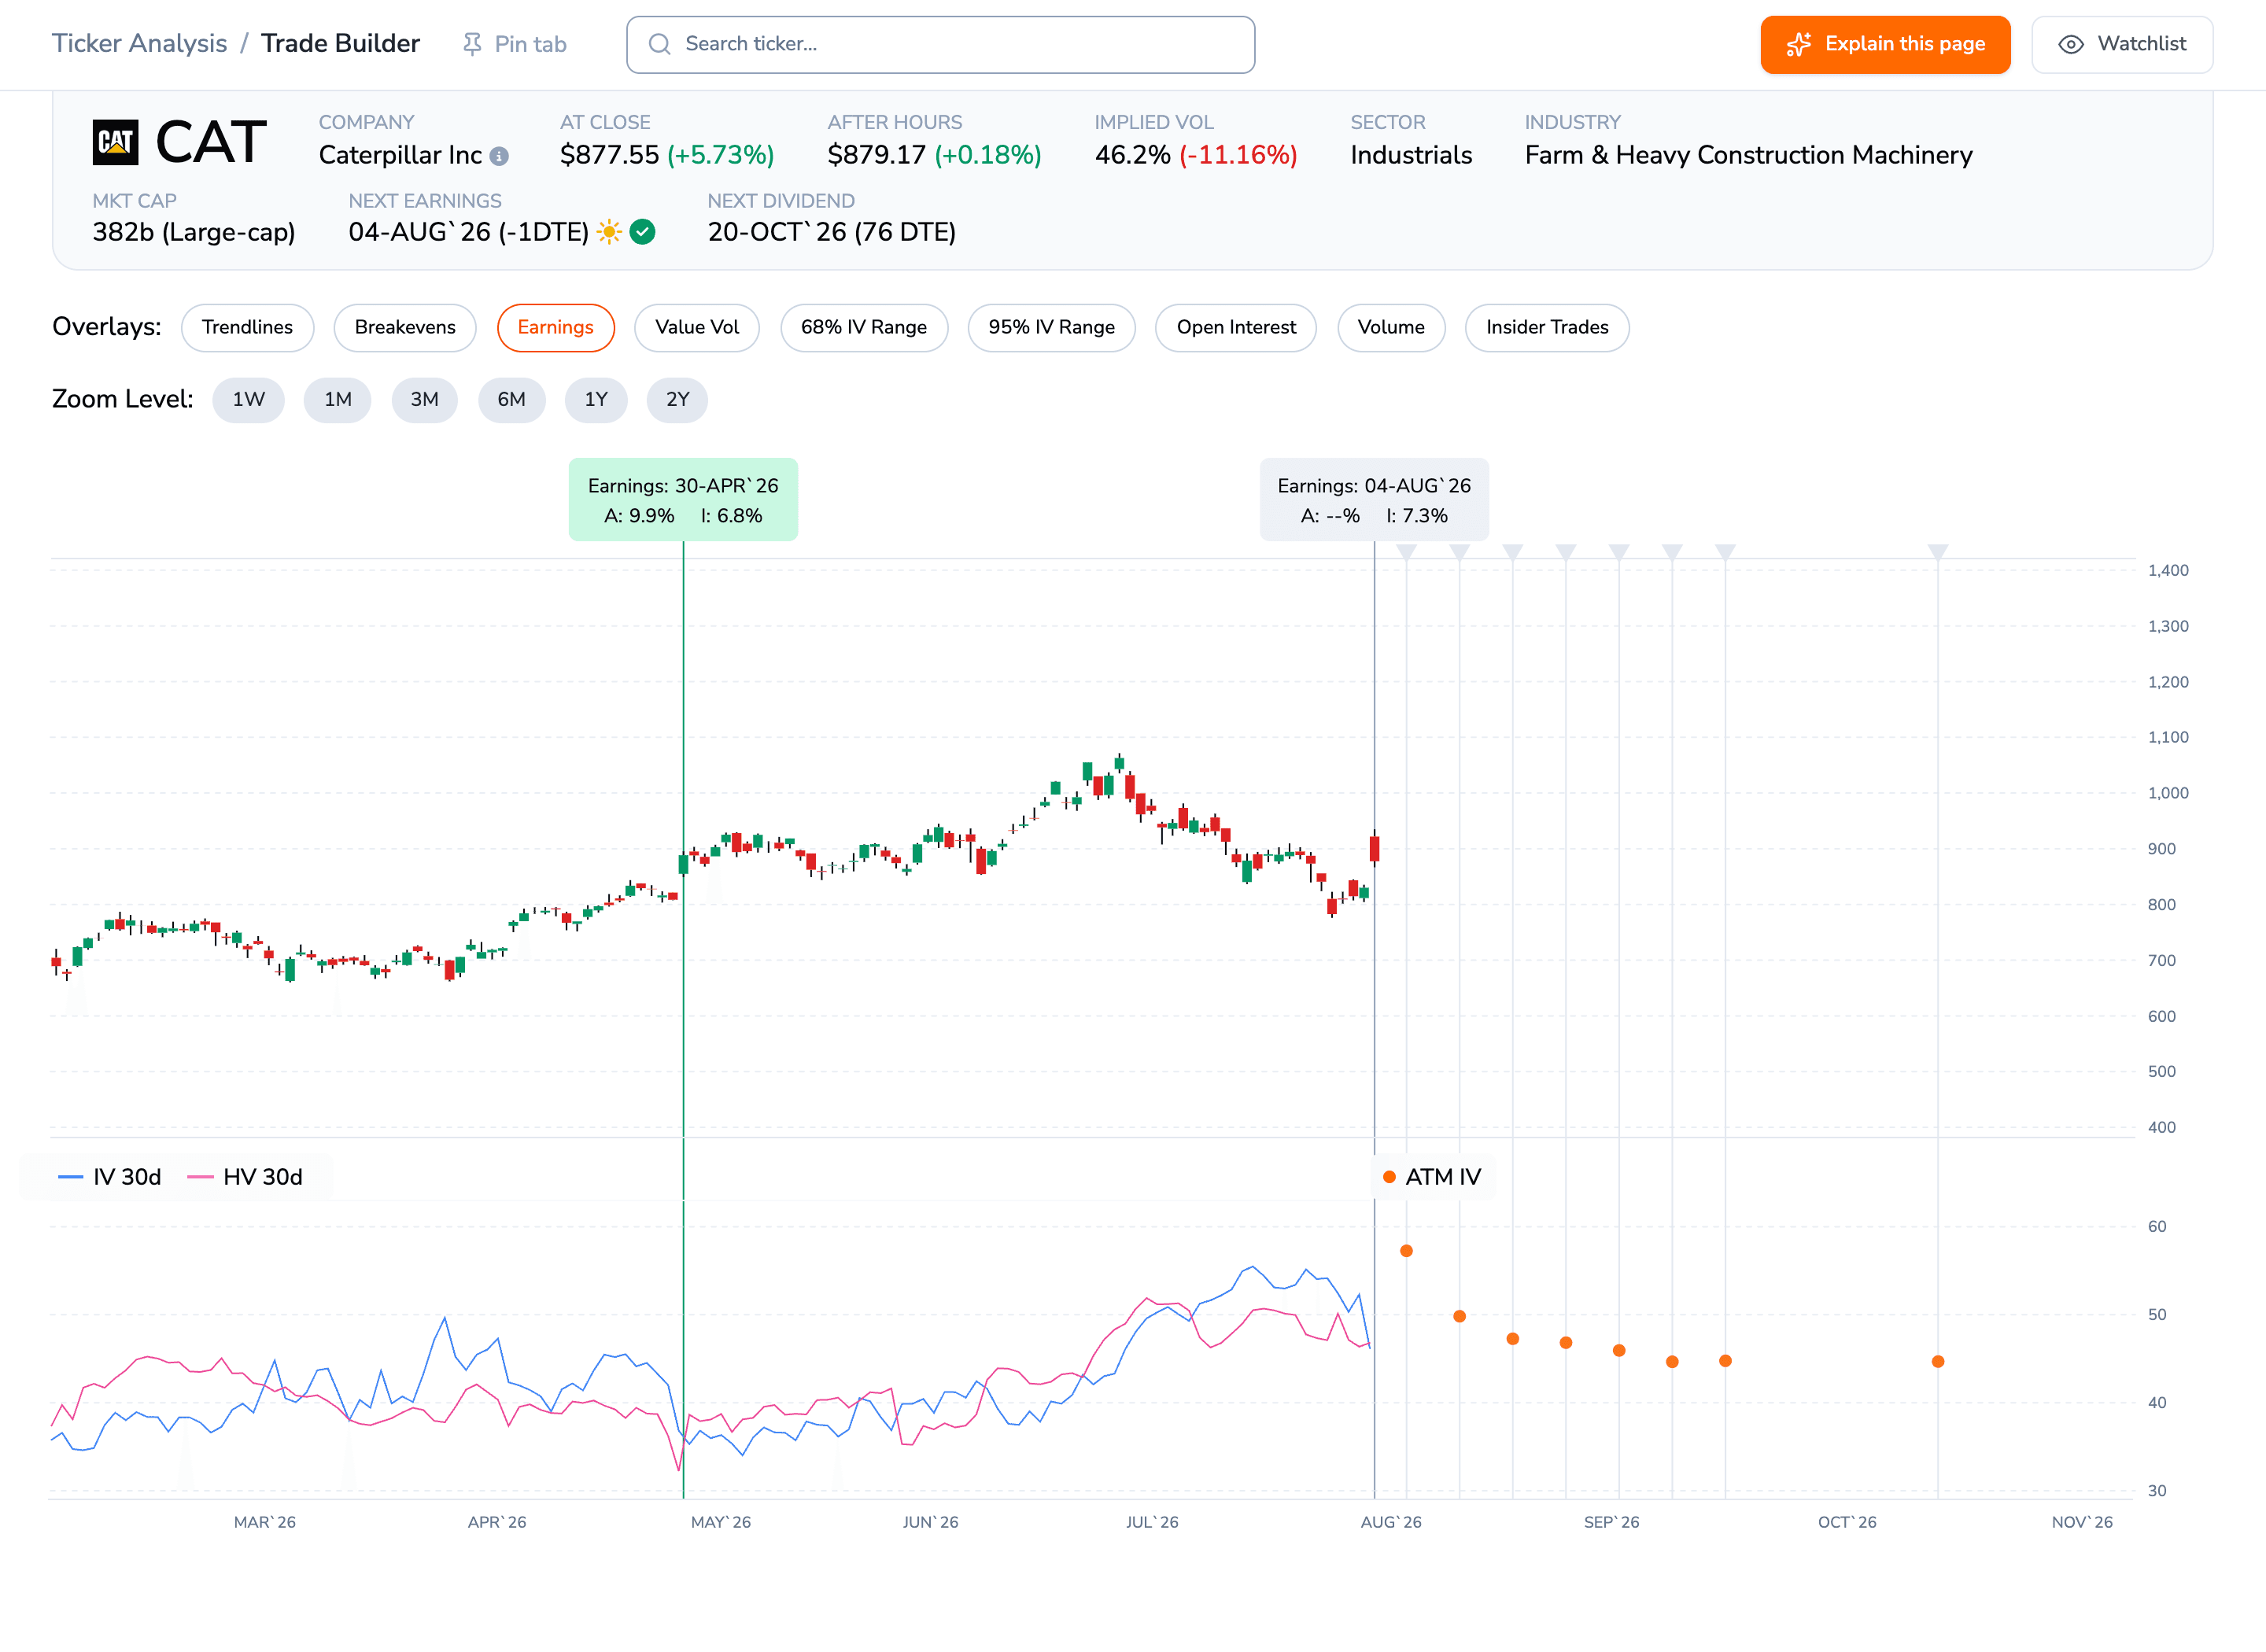
Caterpillar Trade Builder chart with earnings lines at 30-APR-26 and 04-AUG-26, and a lower panel where the blue 30-day implied line falls to meet the pink 30-day realized line near 47.
Caterpillar's fitted base read 41.21 the night before and 46.17 the morning after, a 12.0% re-mark. From five sessions earlier it is 3.8%. The 04-AUG marker reads 7.3% off that already-post-print row. Source: ORATS Ticker Analysis Trade Builder.
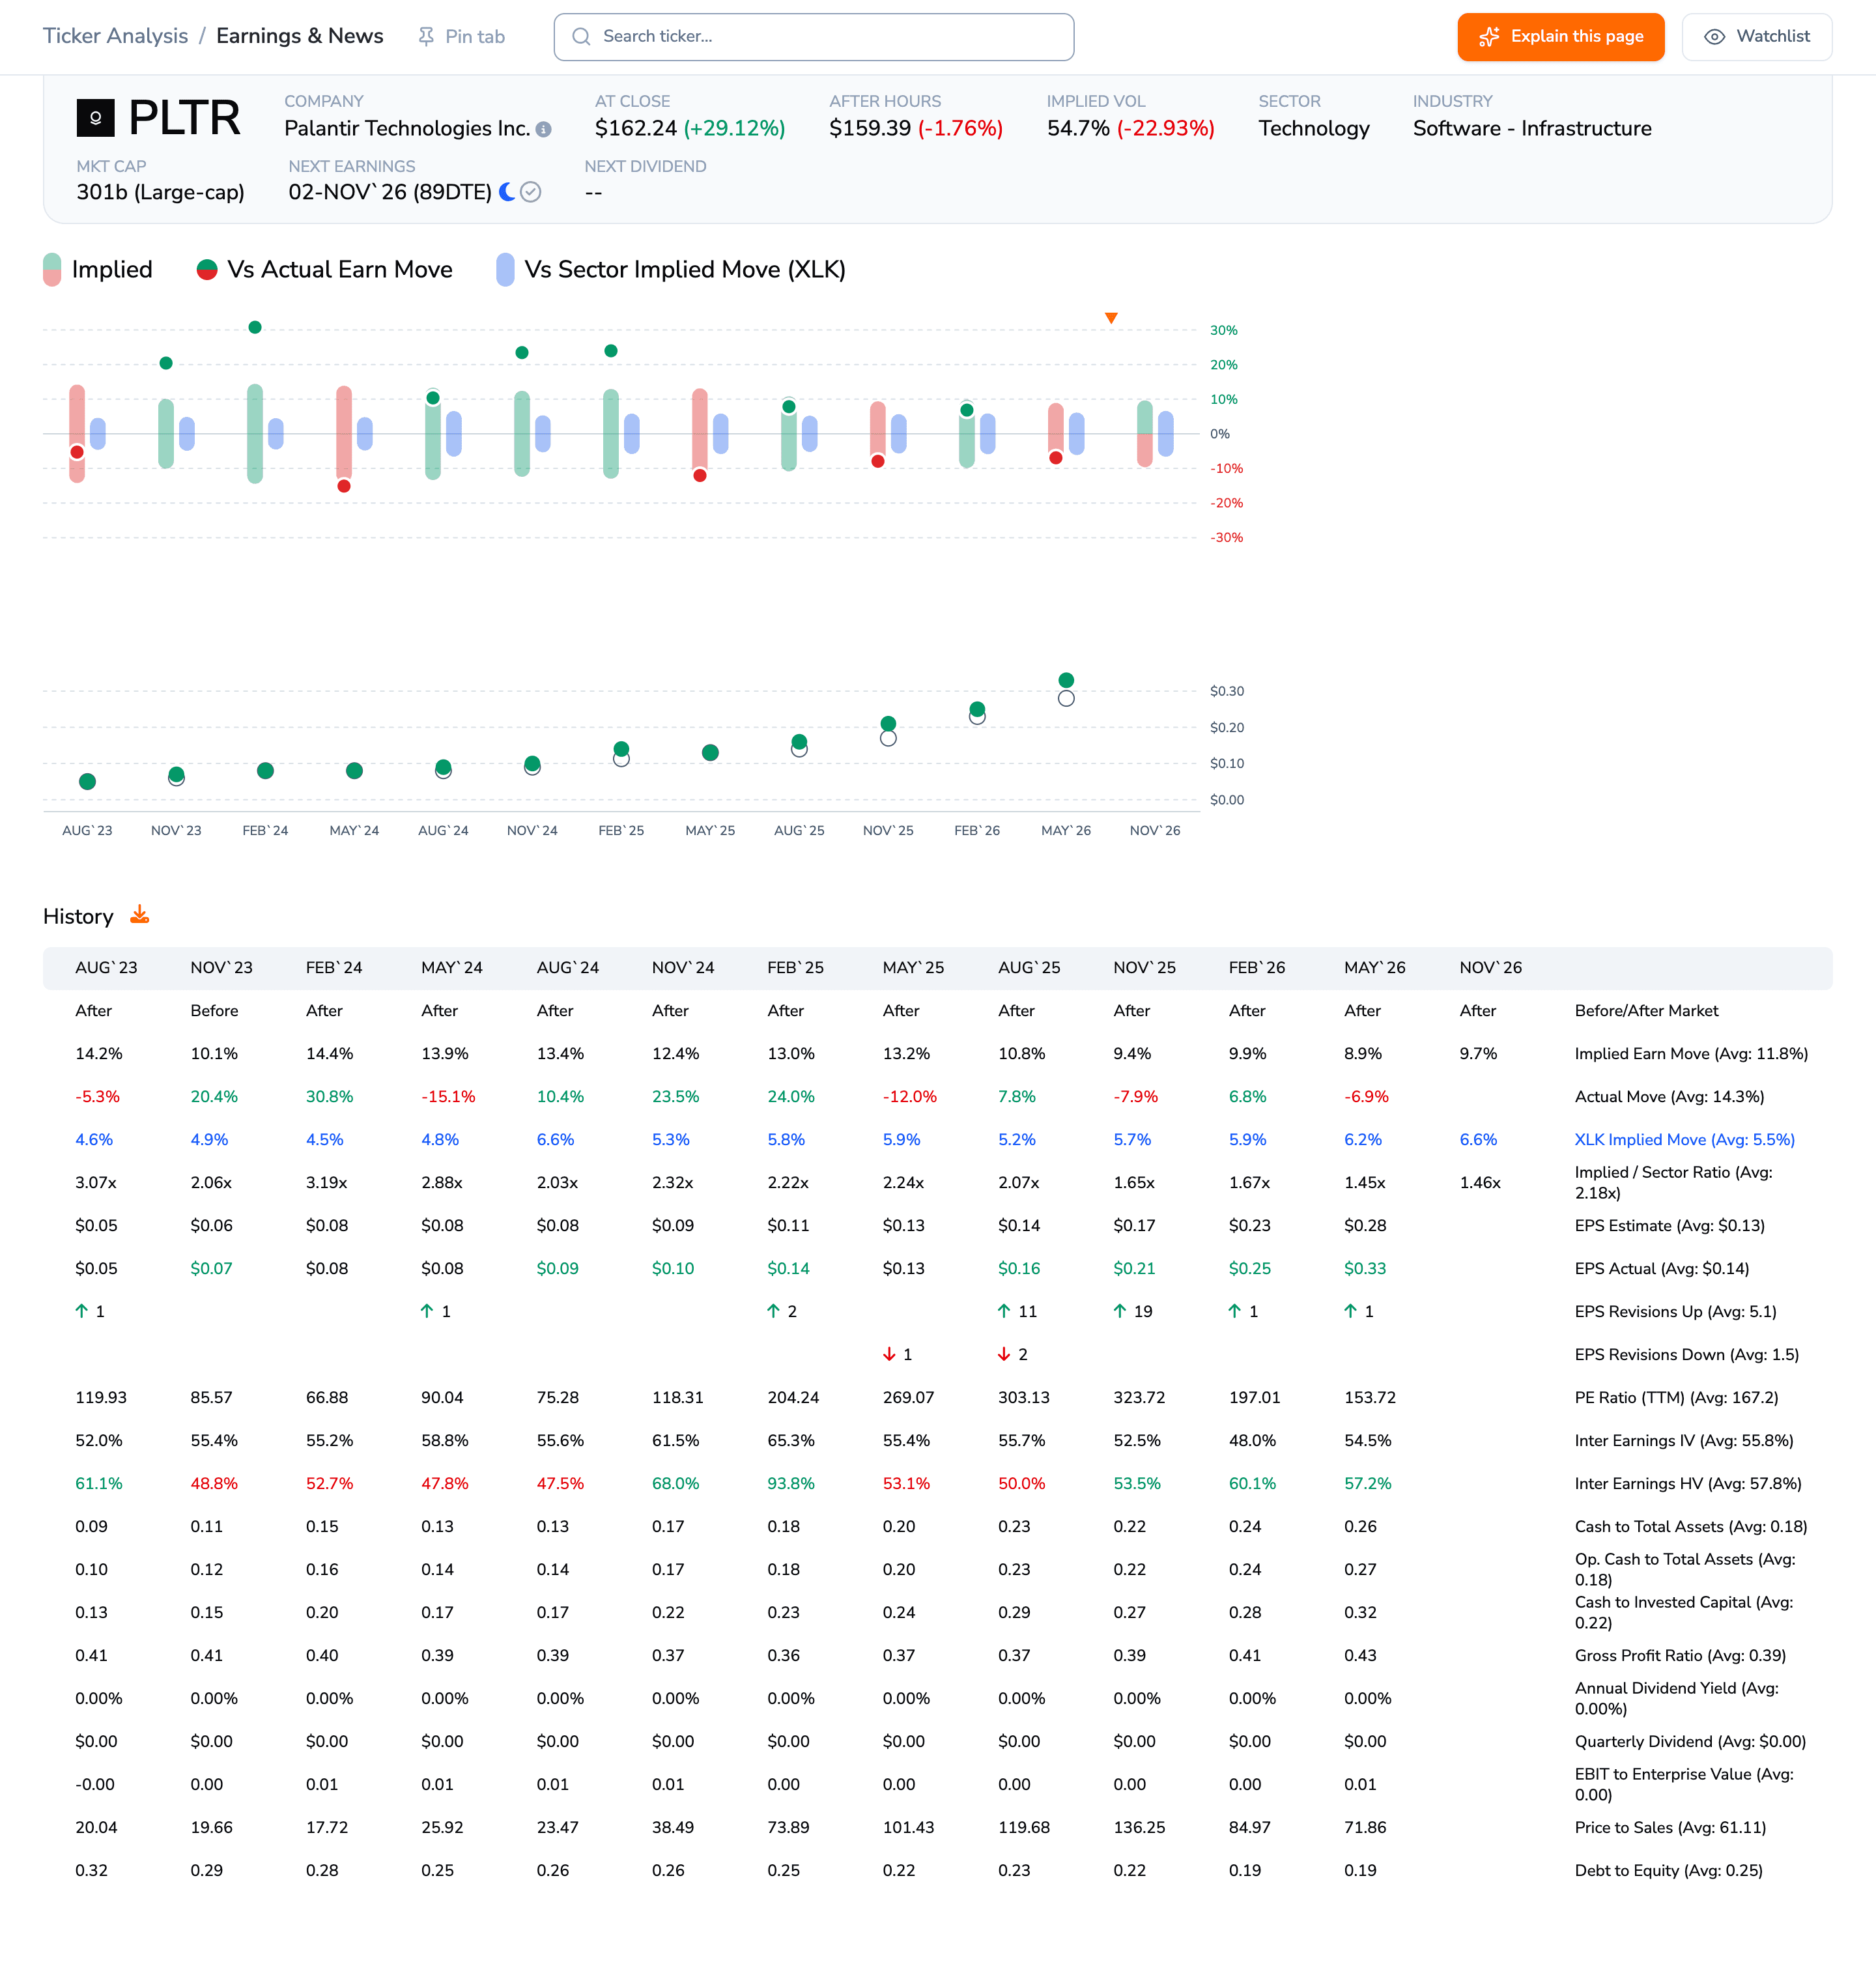
Palantir Earnings and News page showing a history table with an average implied earnings move of 11.8% against an average actual move of 14.3%.
Palantir disagrees the other way: 0.9% off the night before, 6.5% off a week out. The header's 162.24 is the platform's close against ORATS's settled 162.66, and Monday's print is not in this table yet. Source: ORATS Ticker Analysis Earnings and News.
I went in expecting the morning after to carry the information, and it is the day before that does. Read the hump discount, and treat the leftover as a number that depends on where you started measuring. The panel is 136 liquid names and the base is a surface fit, not a traded quote.
Pull iv30d and exErnIv30d for any name reporting this week from api.orats.io/datav2/hist/cores, take the gap, and check it against the drop the next morning.
$DIS $CAT $PLTR
#Volatility #Options #Earnings #ImpliedVolatility #OptionsPricing
Disclaimer:
The opinions and ideas presented herein are for informational and educational purposes only and should not be construed to represent trading or investment advice tailored to your investment objectives. You should not rely solely on any content herein and we strongly encourage you to discuss any trades or investments with your broker or investment adviser, prior to execution. None of the information contained herein constitutes a recommendation that any particular security, portfolio, transaction, or investment strategy is suitable for any specific person. Option trading and investing involves risk and is not suitable for all investors.
All opinions are based upon information and systems considered reliable, but we do not warrant the completeness or accuracy, and such information should not be relied upon as such. We are under no obligation to update or correct any information herein. All statements and opinions are subject to change without notice.
Past performance is not indicative of future results. We do not, will not and cannot guarantee any specific outcome or profit. All traders and investors must be aware of the real risk of loss in following any strategy or investment discussed herein.
Owners, employees, directors, shareholders, officers, agents or representatives of ORATS may have interests or positions in securities of any company profiled herein. Specifically, such individuals or entities may buy or sell positions, and may or may not follow the information provided herein. Some or all of the positions may have been acquired prior to the publication of such information, and such positions may increase or decrease at any time. Any opinions expressed and/or information are statements of judgment as of the date of publication only.
Day trading, short term trading, options trading, and futures trading are extremely risky undertakings. They generally are not appropriate for someone with limited capital, little or no trading experience, and/ or a low tolerance for risk. Never execute a trade unless you can afford to and are prepared to lose your entire investment. In addition, certain trades may result in a loss greater than your entire investment. Always perform your own due diligence and, as appropriate, make informed decisions with the help of a licensed financial professional.
Commissions, fees and other costs associated with investing or trading may vary from broker to broker. All investors and traders are advised to speak with their stock broker or investment adviser about these costs. Be aware that certain trades that may be profitable for some may not be profitable for others, after taking into account these costs. In certain markets, investors and traders may not always be able to buy or sell a position at the price discussed, and consequently not be able to take advantage of certain trades discussed herein.
Be sure to read the OCCs Characteristics and Risks of Standardized Options to learn more about options trading.
Related Posts