Earnings
Monday, July 27th 2026
Meta’s Expected Move Is 7.2%. Here’s What That Number Leaves Out.
The Wall Street Journal quoted Meta’s expected earnings move. ORATS data shows whether that estimate has historically contained the stock’s actual reaction.
Summary
Meta’s options market is pricing an expected move of about 7.2% for its upcoming earnings, which aligns with its three‑year average but is modest compared to its historical realized moves that average roughly 7.9% and have often exceeded the implied estimate; recent quarters showed larger swings (‑8.6%, +10.4%, ‑11.3%, +11.3%), suggesting the actual post‑earnings move may again outpace the options forecast.

July 26, 2026
By Tyler Cheves
Ahead of next week’s earnings, The Wall Street Journal pointed to the options market’s expected move for Meta to show how much volatility traders are pricing into the report. Meta reports Wednesday, July 29, after the close, and options are currently pricing a move of approximately 7.2% in either direction.
Read the article: Options Traders Expect Fireworks After Big Tech Earnings Next Week
That is a useful number. On its own, however, it leaves the more important questions unanswered:
How unusual is 7.2%, and how often has Meta’s realized earnings move stayed within what options priced?
The Meta Earnings tab puts the current expected move next to every earnings report from the past three years.
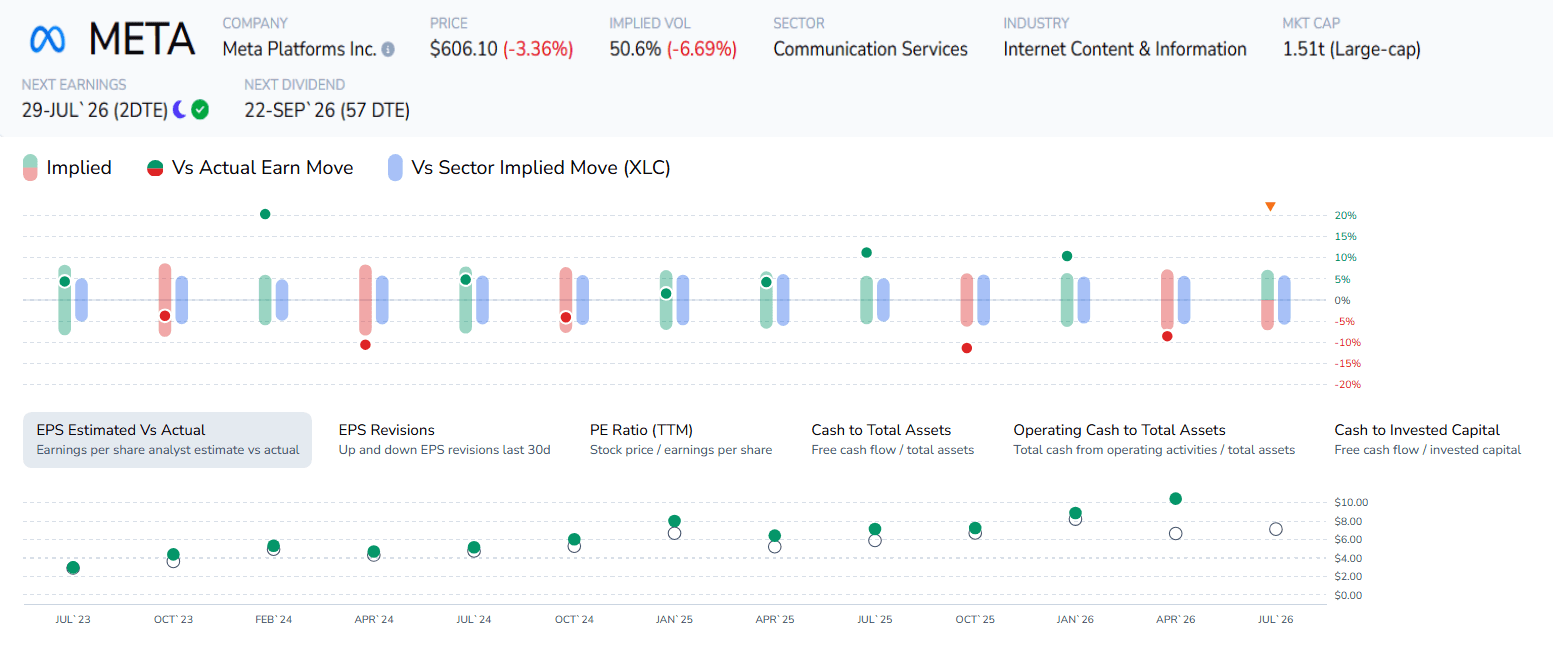
Meta earnings history in ORATS. Green bars show the options market’s implied move before each report; red dots show Meta’s actual post-earnings move. Blue bars show the sector-implied move for XLC.
The bars show the implied move heading into each report. The dots show the stock’s actual earnings move afterward.
Two things stand out.
First, a 7.2% implied move is close to Meta’s recent norm. Its implied move has averaged approximately 7.2% across the previous twelve reports, placing the current setup near the middle of its own three-year history. The number may sound dramatic in isolation. For Meta, it is fairly ordinary.
Second, Meta’s realized earnings moves have frequently exceeded what options priced. Across those twelve reports, the stock’s absolute move averaged approximately 7.9%, compared with an average implied move of 7.2%. Realized movement exceeded the implied estimate in six of the twelve quarters.
The four most recent reactions make the gap especially visible: approximately −8.6%, +10.4%, −11.3%, and +11.3%. That is an average absolute move of roughly 10%, against implied moves generally clustered around 6% to 7%.
That is the difference between reading an expected move and evaluating it. The expected move tells you how much movement the options market is pricing. The history shows whether that pricing has tended to contain the event.
The lower section of the Earnings tab adds fundamental context. EPS estimates versus actual results, recent analyst revisions, valuation, and cash-flow measures can help traders judge whether the present setup resembles earlier quarters or reflects a changing business environment.
Those variables do not explain every move, and they do not turn the expected move into a directional forecast. They do make the current number more useful than it would be standing alone.
The interesting question next Wednesday is not simply whether Meta rises or falls by 6%, 8%, or 10%.
It is whether the realized move once again exceeds what the options market priced beforehand.
We will know after the close.
Disclaimer:
The opinions and ideas presented herein are for informational and educational purposes only and should not be construed to represent trading or investment advice tailored to your investment objectives. You should not rely solely on any content herein and we strongly encourage you to discuss any trades or investments with your broker or investment adviser, prior to execution. None of the information contained herein constitutes a recommendation that any particular security, portfolio, transaction, or investment strategy is suitable for any specific person. Option trading and investing involves risk and is not suitable for all investors.
All opinions are based upon information and systems considered reliable, but we do not warrant the completeness or accuracy, and such information should not be relied upon as such. We are under no obligation to update or correct any information herein. All statements and opinions are subject to change without notice.
Past performance is not indicative of future results. We do not, will not and cannot guarantee any specific outcome or profit. All traders and investors must be aware of the real risk of loss in following any strategy or investment discussed herein.
Owners, employees, directors, shareholders, officers, agents or representatives of ORATS may have interests or positions in securities of any company profiled herein. Specifically, such individuals or entities may buy or sell positions, and may or may not follow the information provided herein. Some or all of the positions may have been acquired prior to the publication of such information, and such positions may increase or decrease at any time. Any opinions expressed and/or information are statements of judgment as of the date of publication only.
Day trading, short term trading, options trading, and futures trading are extremely risky undertakings. They generally are not appropriate for someone with limited capital, little or no trading experience, and/ or a low tolerance for risk. Never execute a trade unless you can afford to and are prepared to lose your entire investment. In addition, certain trades may result in a loss greater than your entire investment. Always perform your own due diligence and, as appropriate, make informed decisions with the help of a licensed financial professional.
Commissions, fees and other costs associated with investing or trading may vary from broker to broker. All investors and traders are advised to speak with their stock broker or investment adviser about these costs. Be aware that certain trades that may be profitable for some may not be profitable for others, after taking into account these costs. In certain markets, investors and traders may not always be able to buy or sell a position at the price discussed, and consequently not be able to take advantage of certain trades discussed herein.
Be sure to read the OCCs Characteristics and Risks of Standardized Options to learn more about options trading.
Related Posts