Market Events
Monday, July 6th 2026
Airline Earnings: Delta's Options Are the Least Padded
Delta heads into earnings with the thinnest options premium among major U.S. airlines.
Summary
Delta’s options have the thinnest earnings premium among major U.S. airlines, with an implied move of 6.2% matching its 12‑quarter average delivered move, resulting in a near‑parity 1.01x ratio that rises to 1.35x when the largest print is excluded. While other carriers price a 1.2‑1.5x cushion, Delta’s median move is just 3.9%, and its post‑earnings implied volatility drops to 38.4, below forecasts. Smaller airlines like Alaska carry a fuller premium of about 1.5x. The analysis suggests Delta’s thin premium reflects market expectations rather than a clear mispricing opportunity.

.
July 6, 2026
By Matt Amberson
Delta reports Friday morning, and its options carry the thinnest earnings premium of any major U.S. airline. Delta's implied earnings move, 6.2%, essentially matches the 6.2% it has delivered over the last 12 quarters, a ratio right at 1x. United, American, Southwest, and Alaska each price 1.2x to roughly 1.5x what they deliver.
That 1.2x to 1.5x cushion is the ordinary earnings premium, the price of gap risk baked into almost any optionable stock. Delta stands out because its cushion is the thinnest in the group, not because the others are mispriced.
The group ripped roughly 20% in June as jet fuel fell about 40% from its April peak and bookings held up, and the previews put Delta out front on a consensus Strong Buy. Every one of them argues the direction of the beat, not whether the options carry any cushion at all.
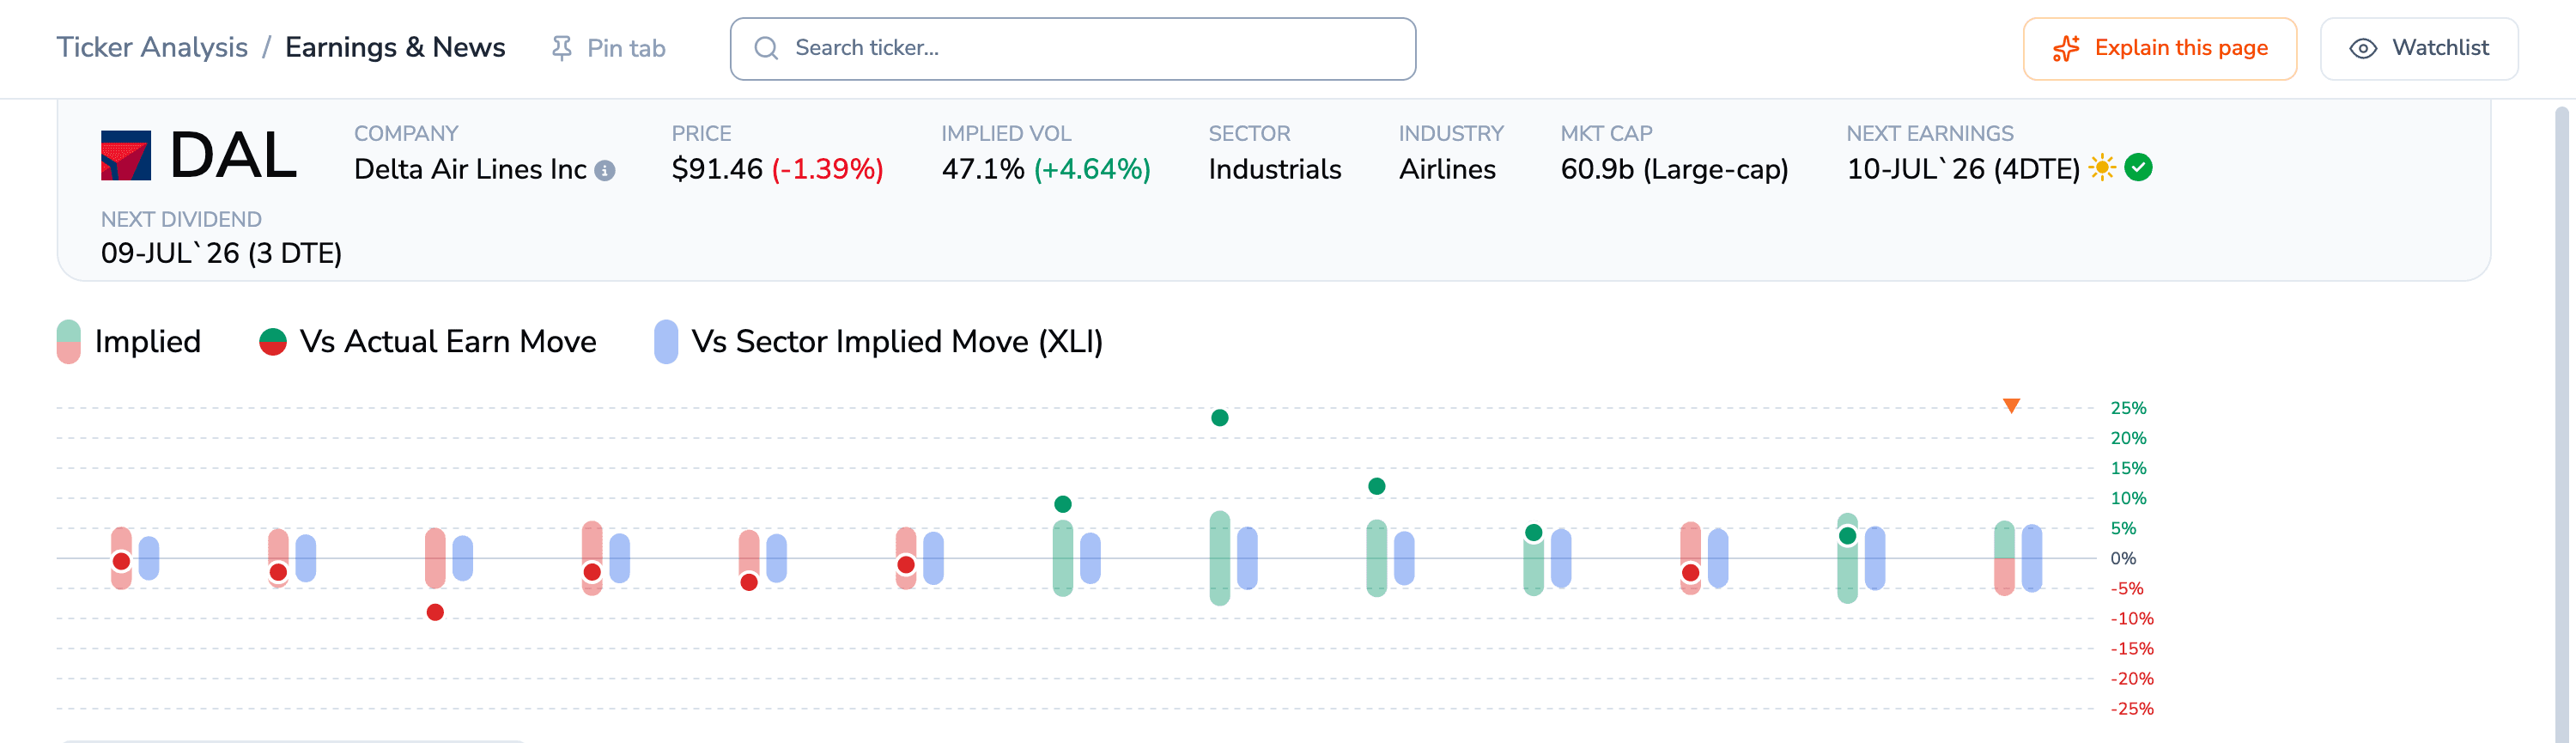
Dashboard earnings history chart for Delta Air Lines. Each quarter shows a tall implied-move bar, green when the stock rose on earnings and pink when it fell, beside a blue sector-implied bar, with a dot marking the actual delivered move. Most delivered moves are small, but a few spike to plus 23, plus 12, and plus 9 percent.
Alt: Dashboard earnings history chart for Delta Air Lines. Each quarter shows a tall implied-move bar, green when the stock rose on earnings and pink when it fell, beside a blue sector-implied bar, with a dot marking the actual delivered move. Most delivered moves are small, but a few spike to plus 23, plus 12, and plus 9 percent.
Delta's ORATS Earnings and News view. Each quarter's tall bar spans the plus-or-minus implied earnings move (green when the stock rose on the print, pink when it fell), the blue bar is the sector's implied move, and the dot marks what Delta actually delivered. Across these 12 quarters the delivered moves average 6.2%, matching the 6.2% the options imply into Friday's report. Source: ORATS /datav2/cores.
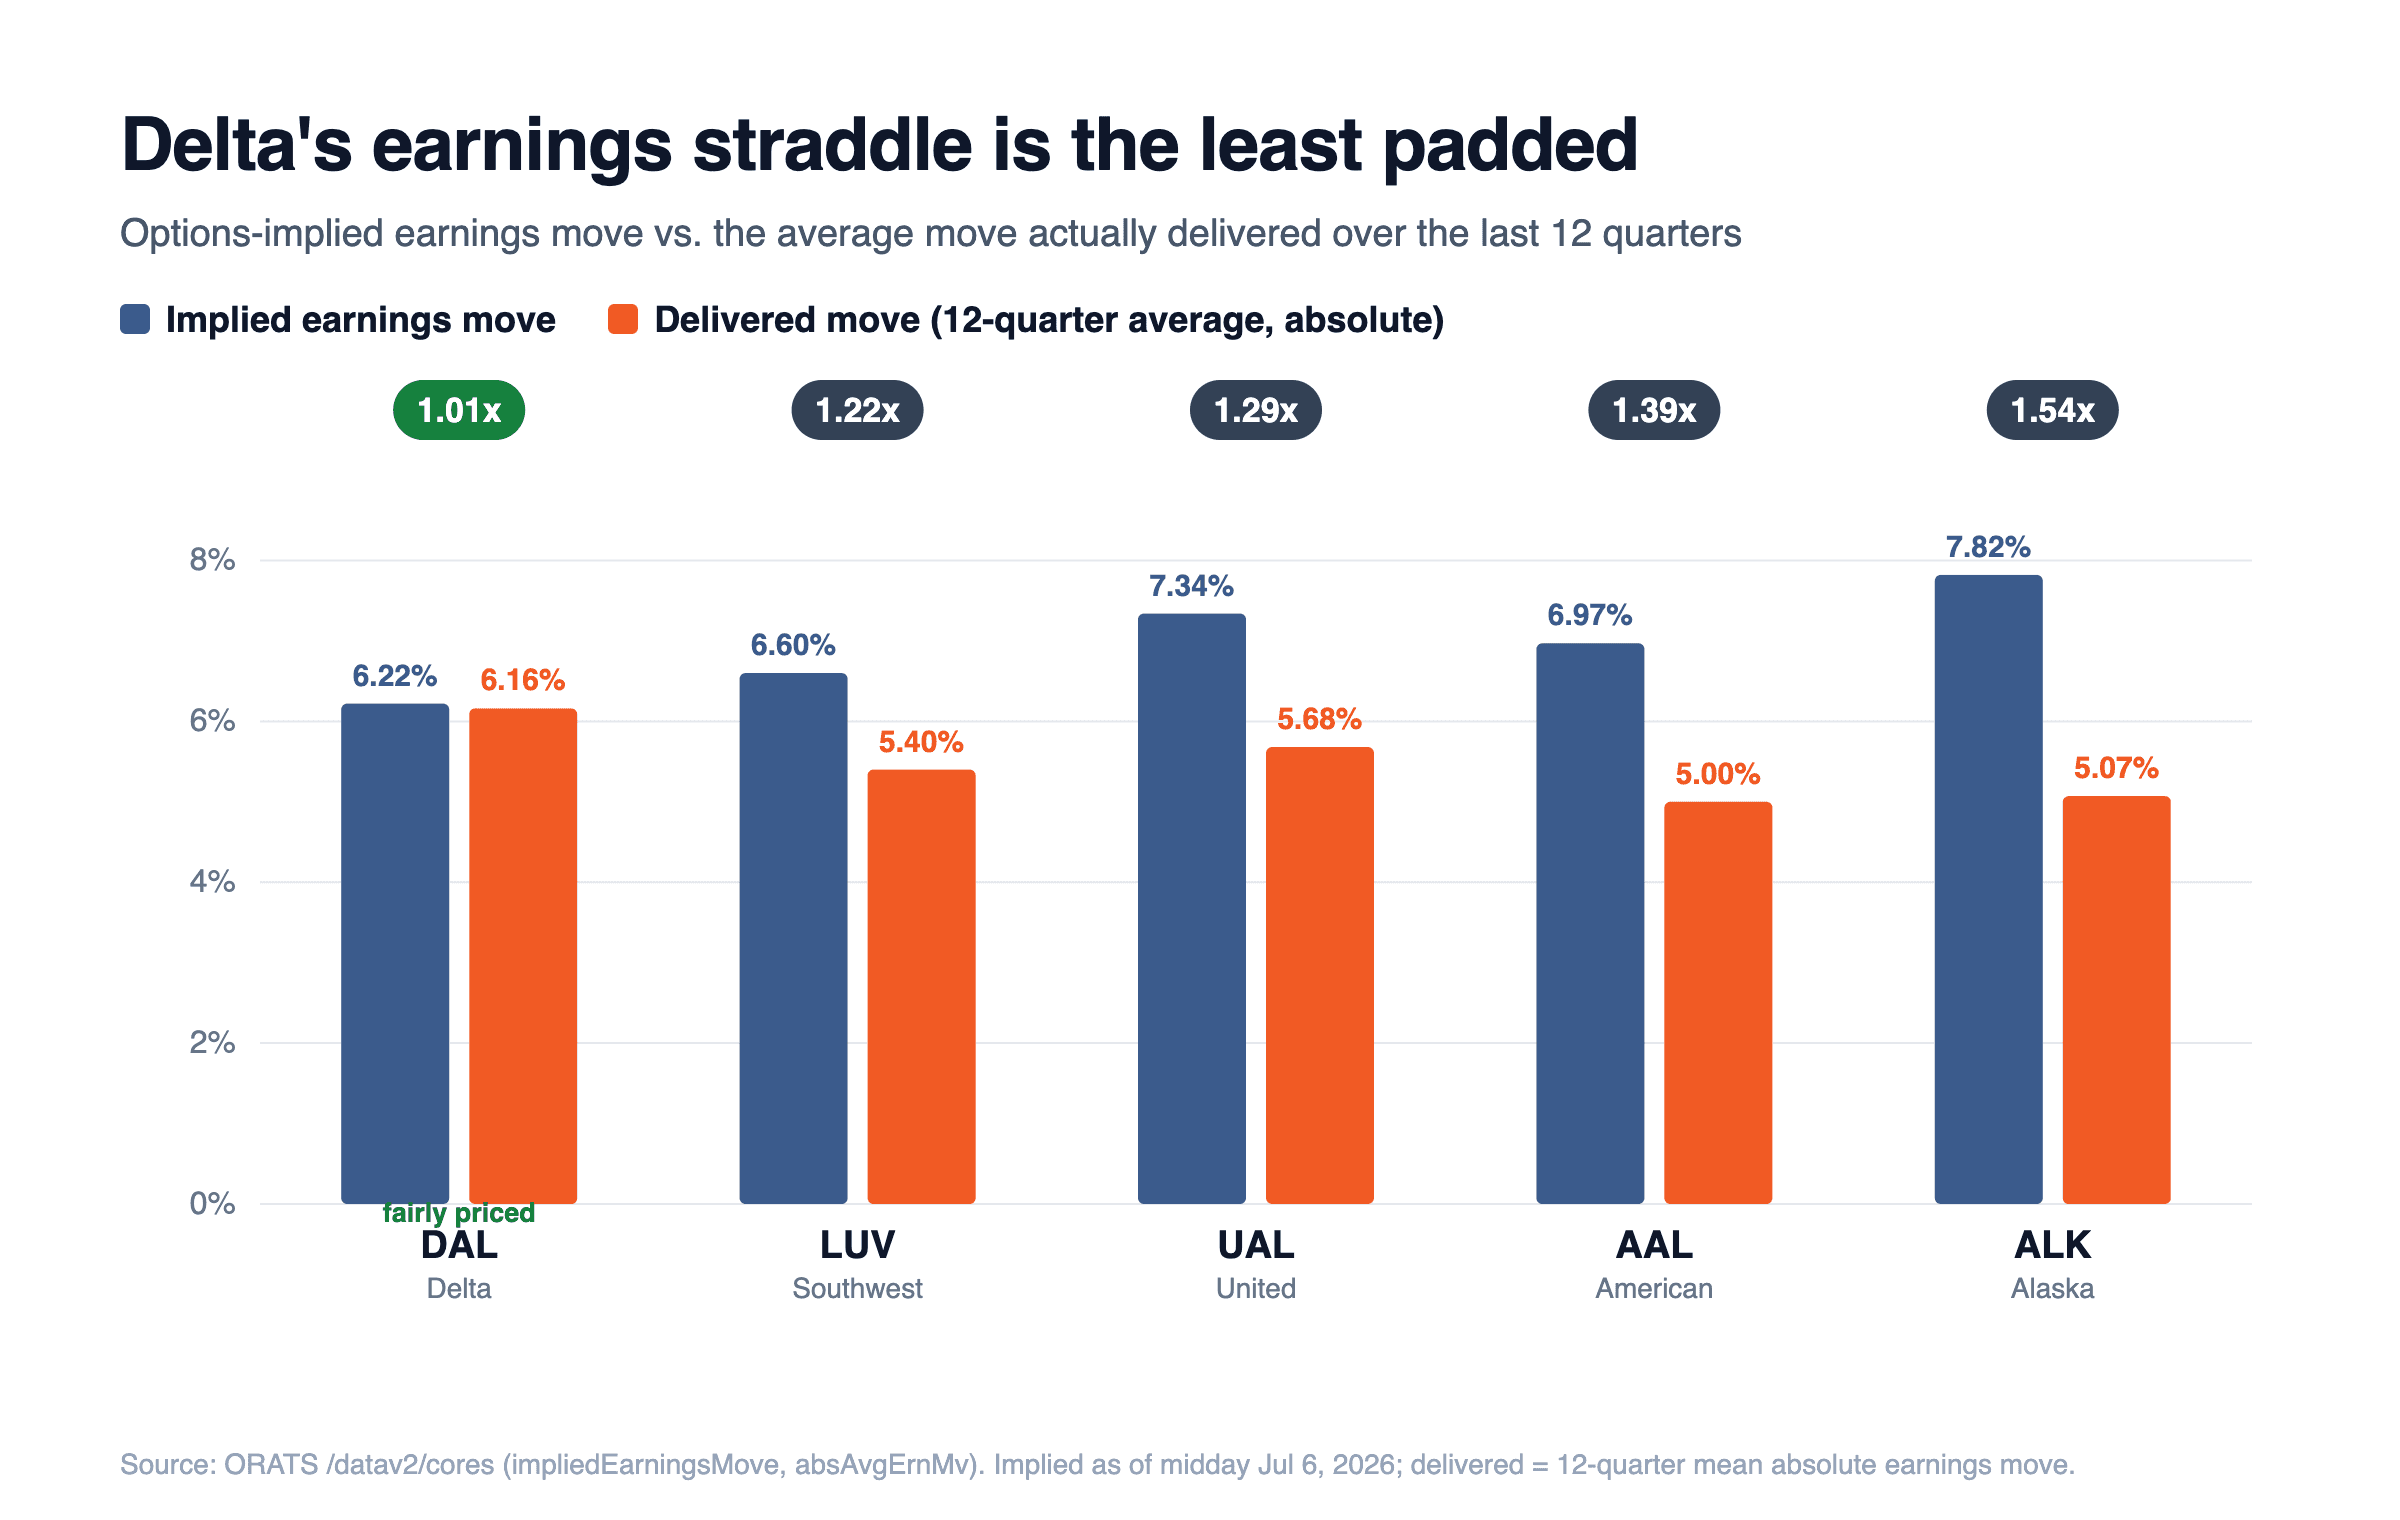
Grouped bar chart of five airlines. For each, a blue implied-earnings-move bar next to an orange delivered-move bar, with a ratio pill above. Delta is 1.01x and highlighted green, Southwest 1.22x, United 1.29x, American 1.39x, Alaska 1.54x.
Alt: Grouped bar chart of five airlines. For each, a blue implied-earnings-move bar next to an orange delivered-move bar, with a ratio pill above. Delta is 1.01x and highlighted green, Southwest 1.22x, United 1.29x, American 1.39x, Alaska 1.54x.
Options-implied earnings move versus the average move each carrier delivered over 12 quarters, with the raw ratio above each pair (before the single-largest-print check below). Delta sits at parity, the thinnest premium in the group. Source: ORATS /datav2/cores (impliedEarningsMove, absAvgErnMv).
Is the thin premium real?
That 6.2% delivered average is propped up by three big same-signed prints in 2025, including a +23% move that landed on a market-wide risk-on day, so part of it is a macro reaction rather than clean earnings risk (ORATS records the full close-to-close move, beta included). Strip out that single largest print and Delta's ratio rises to 1.35x, back inside the ordinary earnings-premium band. Its median earnings move is just 3.9%.
So does the ranking survive? Run the same strip-the-largest-print test on every carrier and Delta still comes out ahead: it stays the least padded at 1.35x, against 1.54x to 1.69x for the rest. Delta carries the thinnest premium whether or not you trust the fat tail.
Strip the earnings print out of Delta's 46% implied vol, too, and what's left is quiet.
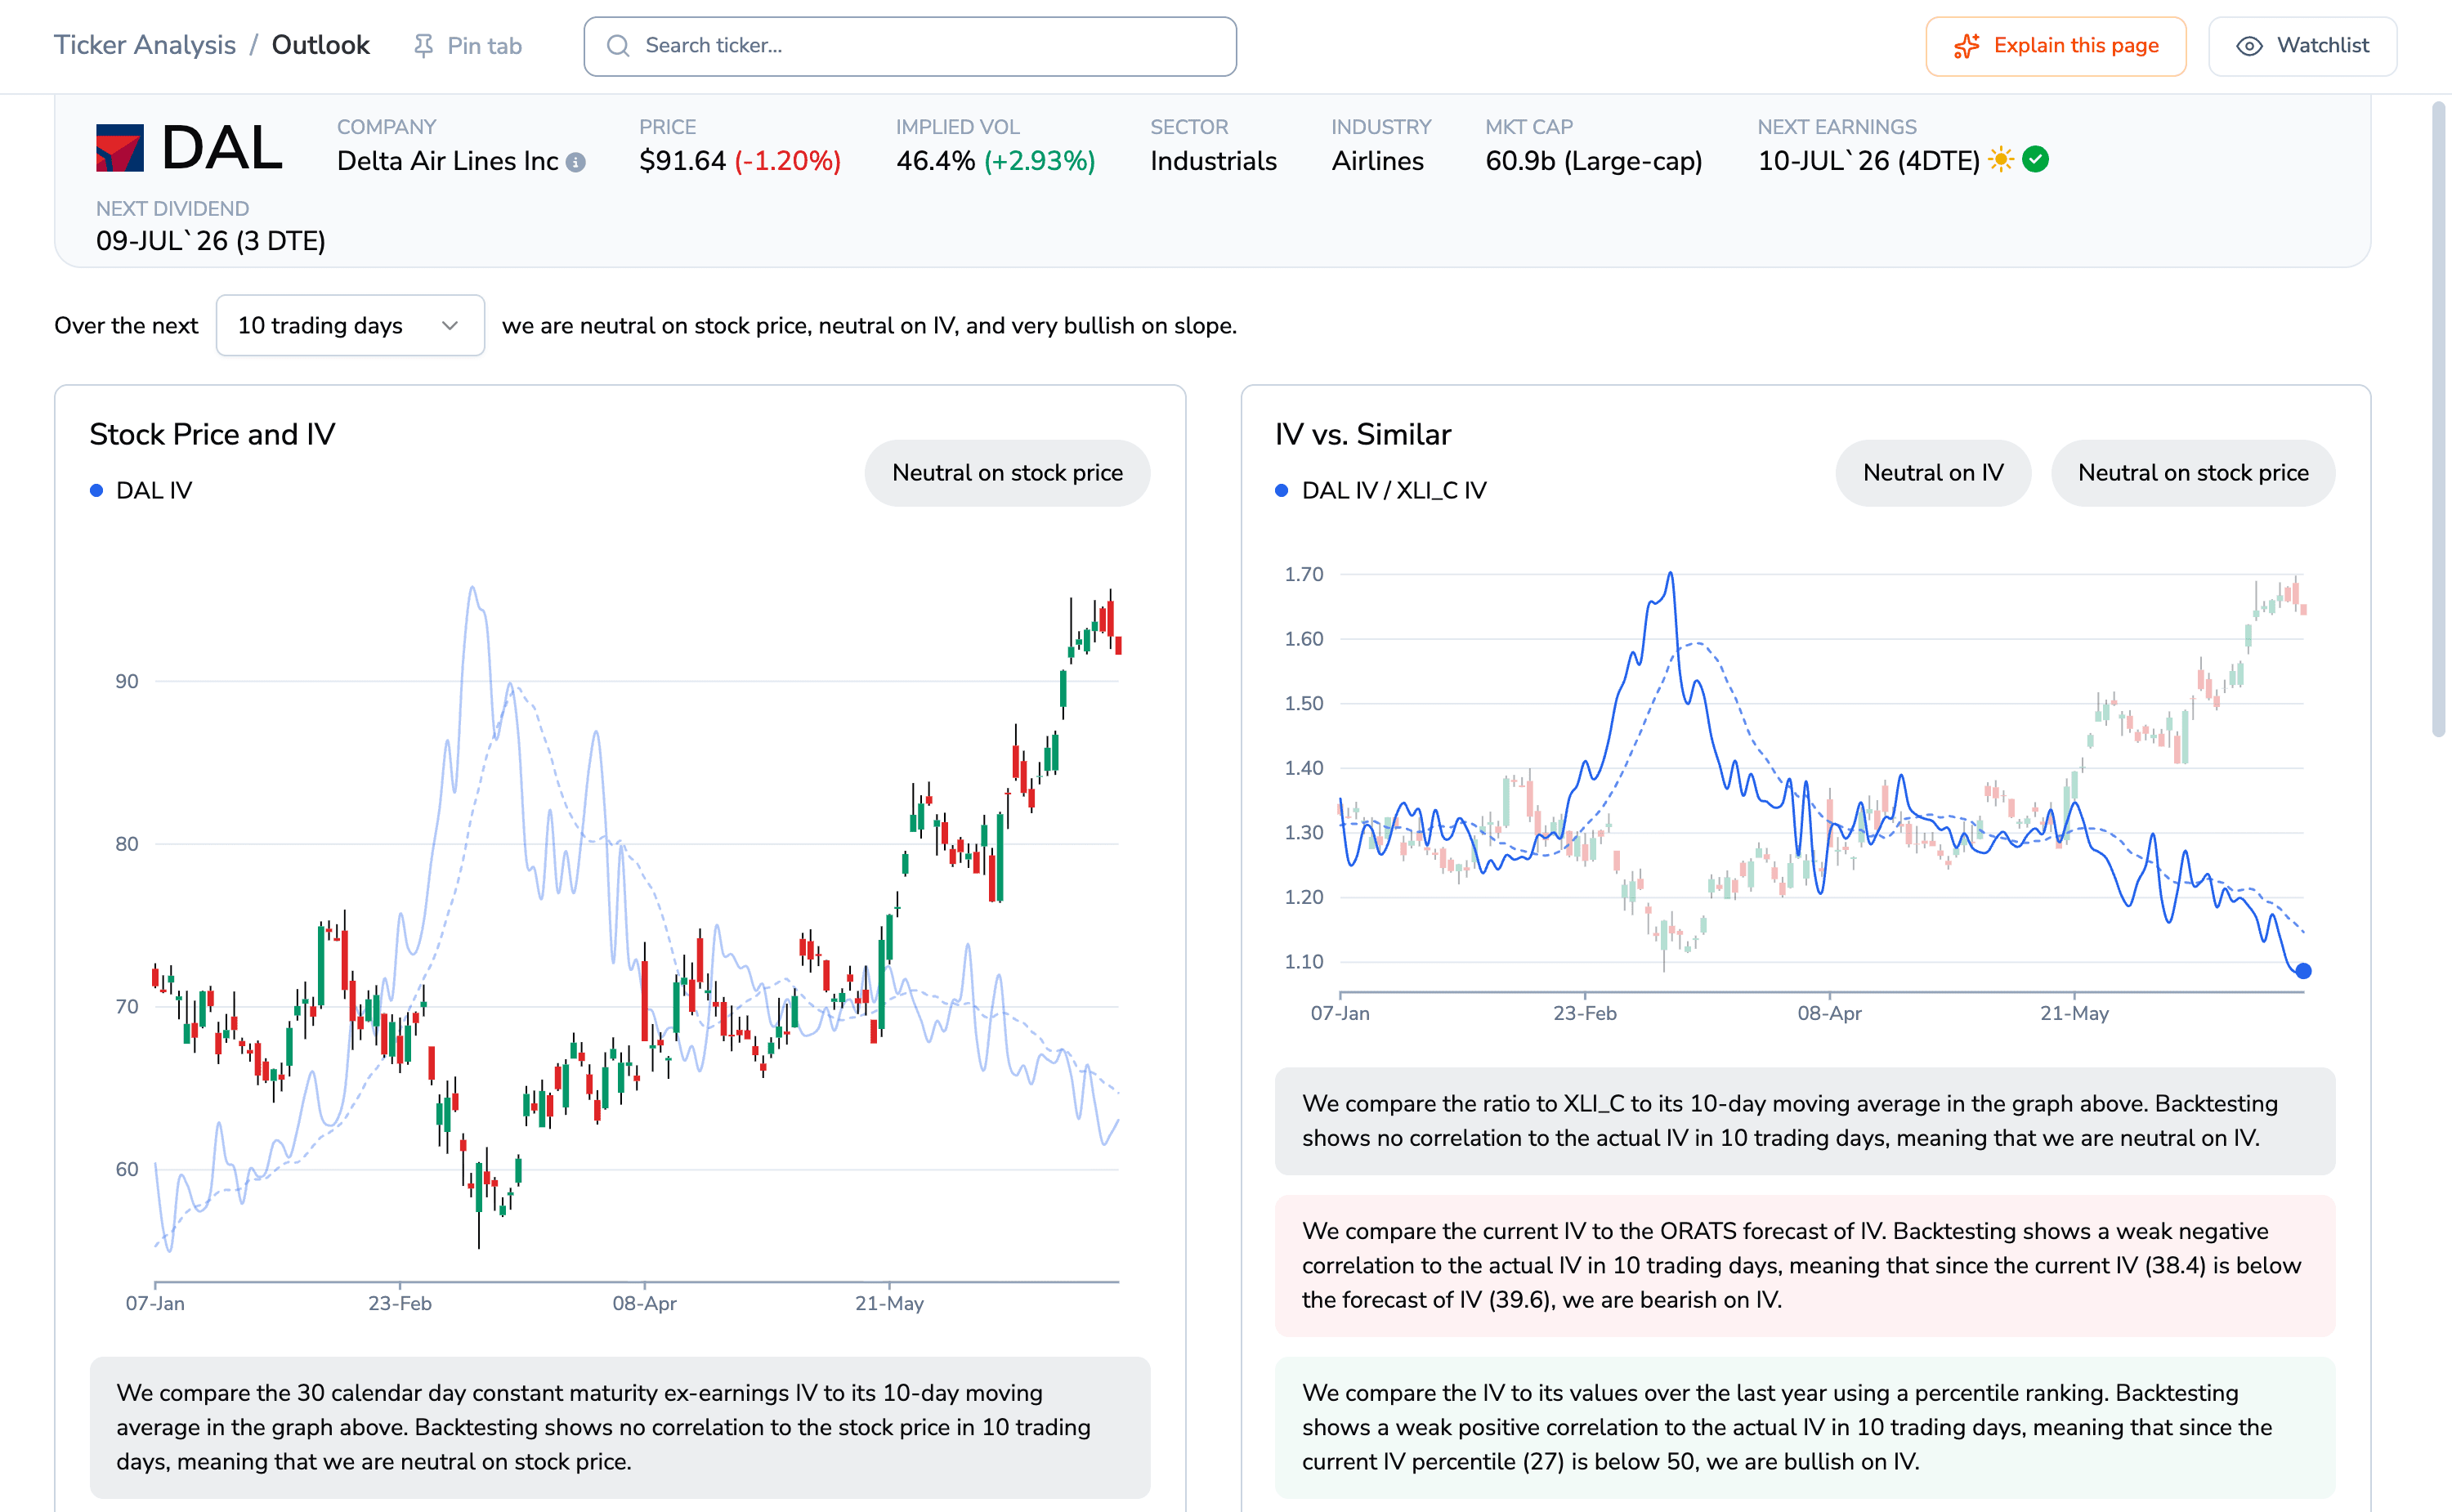
Dashboard Outlook panels for Delta. Left panel plots Delta price candles with its implied-vol line and forecast. Right panel shows Delta IV relative to the industrial sector, with annotation boxes stating current IV 38.4 is below the 39.6 forecast and the IV percentile is 27.
Alt: Dashboard Outlook panels for Delta. Left panel plots Delta price candles with its implied-vol line and forecast. Right panel shows Delta IV relative to the industrial sector, with annotation boxes stating current IV 38.4 is below the 39.6 forecast and the IV percentile is 27.
Delta's ORATS Outlook, read live. Its ex-earnings IV reads 38.4, which the dashboard flags below its 39.6 IV forecast and at the 27th percentile of the year. The gap between the 46% headline and that quiet 38.4 base is the earnings hump priced into Friday's print. Source: ORATS /datav2/cores.
The thickest padding is at the small end
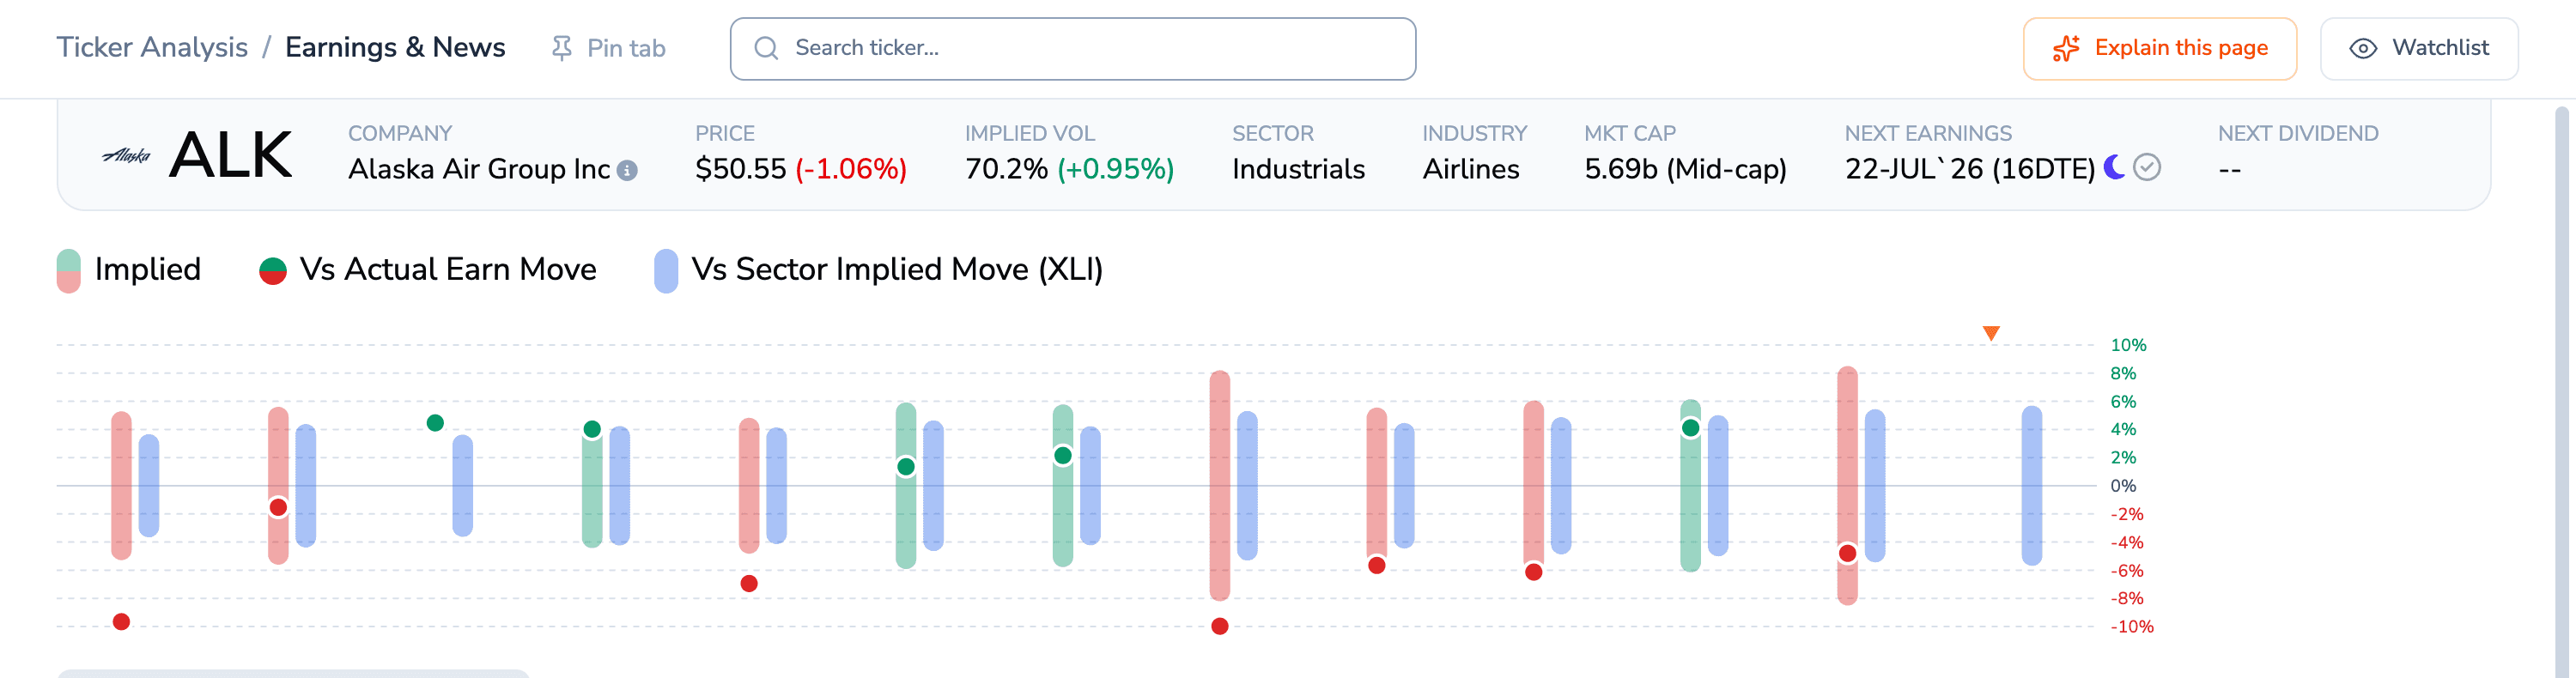
Dashboard earnings history chart for Alaska Air Group. Implied-move bars, green on up-quarters and pink on down, reach roughly 5 to 8 percent each quarter beside blue sector bars; the dots marking actual delivered moves land inside the implied band in most quarters, with a few larger drops breaking below it.
Alt: Dashboard earnings history chart for Alaska Air Group. Implied-move bars, green on up-quarters and pink on down, reach roughly 5 to 8 percent each quarter beside blue sector bars; the dots marking actual delivered moves land inside the implied band in most quarters, with a few larger drops breaking below it.
Alaska Air prices about a 1.5x earnings premium, a 7.8% implied move against a delivered average near 5%, and reports July 22. In most quarters its implied band brackets the move the stock made, the signature of a fuller premium, with a few big drops the exception. Source: ORATS /datav2/cores.
Implied is a forward number for this specific report, while the delivered average looks backward. If the market has a real reason to expect Delta to stay calm and the smaller carriers to jump, these ratios can be perfectly rational, reflecting no mispricing at all. In my read this is relative richness within a normal premium, not a mispricing to harvest, but it is a clean read on which airline's options ask the most, and the least, for the same event.
Reproduce it yourself
Pull it yourself: the ORATS Earnings and News tab charts implied against delivered for any ticker, and api.orats.io/datav2/cores?token=YOUR_TOKEN&ticker=DAL returns the impliedEarningsMove, absAvgErnMv, exErnIv30d, and orIvFcst20d fields behind the numbers here.
$DAL $UAL $AAL $LUV $ALK
#OptionsTrading #EarningsSeason #ImpliedVolatility #Airlines
Disclaimer:
The opinions and ideas presented herein are for informational and educational purposes only and should not be construed to represent trading or investment advice tailored to your investment objectives. You should not rely solely on any content herein and we strongly encourage you to discuss any trades or investments with your broker or investment adviser, prior to execution. None of the information contained herein constitutes a recommendation that any particular security, portfolio, transaction, or investment strategy is suitable for any specific person. Option trading and investing involves risk and is not suitable for all investors.
All opinions are based upon information and systems considered reliable, but we do not warrant the completeness or accuracy, and such information should not be relied upon as such. We are under no obligation to update or correct any information herein. All statements and opinions are subject to change without notice.
Past performance is not indicative of future results. We do not, will not and cannot guarantee any specific outcome or profit. All traders and investors must be aware of the real risk of loss in following any strategy or investment discussed herein.
Owners, employees, directors, shareholders, officers, agents or representatives of ORATS may have interests or positions in securities of any company profiled herein. Specifically, such individuals or entities may buy or sell positions, and may or may not follow the information provided herein. Some or all of the positions may have been acquired prior to the publication of such information, and such positions may increase or decrease at any time. Any opinions expressed and/or information are statements of judgment as of the date of publication only.
Day trading, short term trading, options trading, and futures trading are extremely risky undertakings. They generally are not appropriate for someone with limited capital, little or no trading experience, and/ or a low tolerance for risk. Never execute a trade unless you can afford to and are prepared to lose your entire investment. In addition, certain trades may result in a loss greater than your entire investment. Always perform your own due diligence and, as appropriate, make informed decisions with the help of a licensed financial professional.
Commissions, fees and other costs associated with investing or trading may vary from broker to broker. All investors and traders are advised to speak with their stock broker or investment adviser about these costs. Be aware that certain trades that may be profitable for some may not be profitable for others, after taking into account these costs. In certain markets, investors and traders may not always be able to buy or sell a position at the price discussed, and consequently not be able to take advantage of certain trades discussed herein.
Be sure to read the OCCs Characteristics and Risks of Standardized Options to learn more about options trading.
Related Posts