Market Events
Wednesday, July 29th 2026
The Options Are Charging for Nvidia's Earnings, Not Its Credit Scare
Most of Nvidia’s 30-day volatility increase came from its approaching earnings report, while the put wings and longer-dated options showed little sign of a broader credit panic.
Summary
Nvidia’s 30‑day implied volatility rose mainly due to its upcoming earnings report, not a broader credit scare, with the earnings effect adding about 3.7 points to the IV while other factors contributed modestly; similar spikes appeared in other stocks with August earnings, whereas credit‑related moves were limited to a few names like Broadcom and Oracle.
By Matt Amberson

July 29, 2026
Nvidia's five-year credit default swaps jumped the most on record Monday, July 27, per Bloomberg, after reports of talks to backstop $250 billion of OpenAI financing. The stock fell 5%, and by Tuesday's close its 30-day implied vol had risen 4.5 points, 40.05 to 44.53. Three of those 4.5 points are Nvidia's own August 26 earnings date, not the scare. The priced earnings move never budged: 6.12% Monday, 6.16% Tuesday, inside the 6.12% to 6.35% band it has held since July 13.
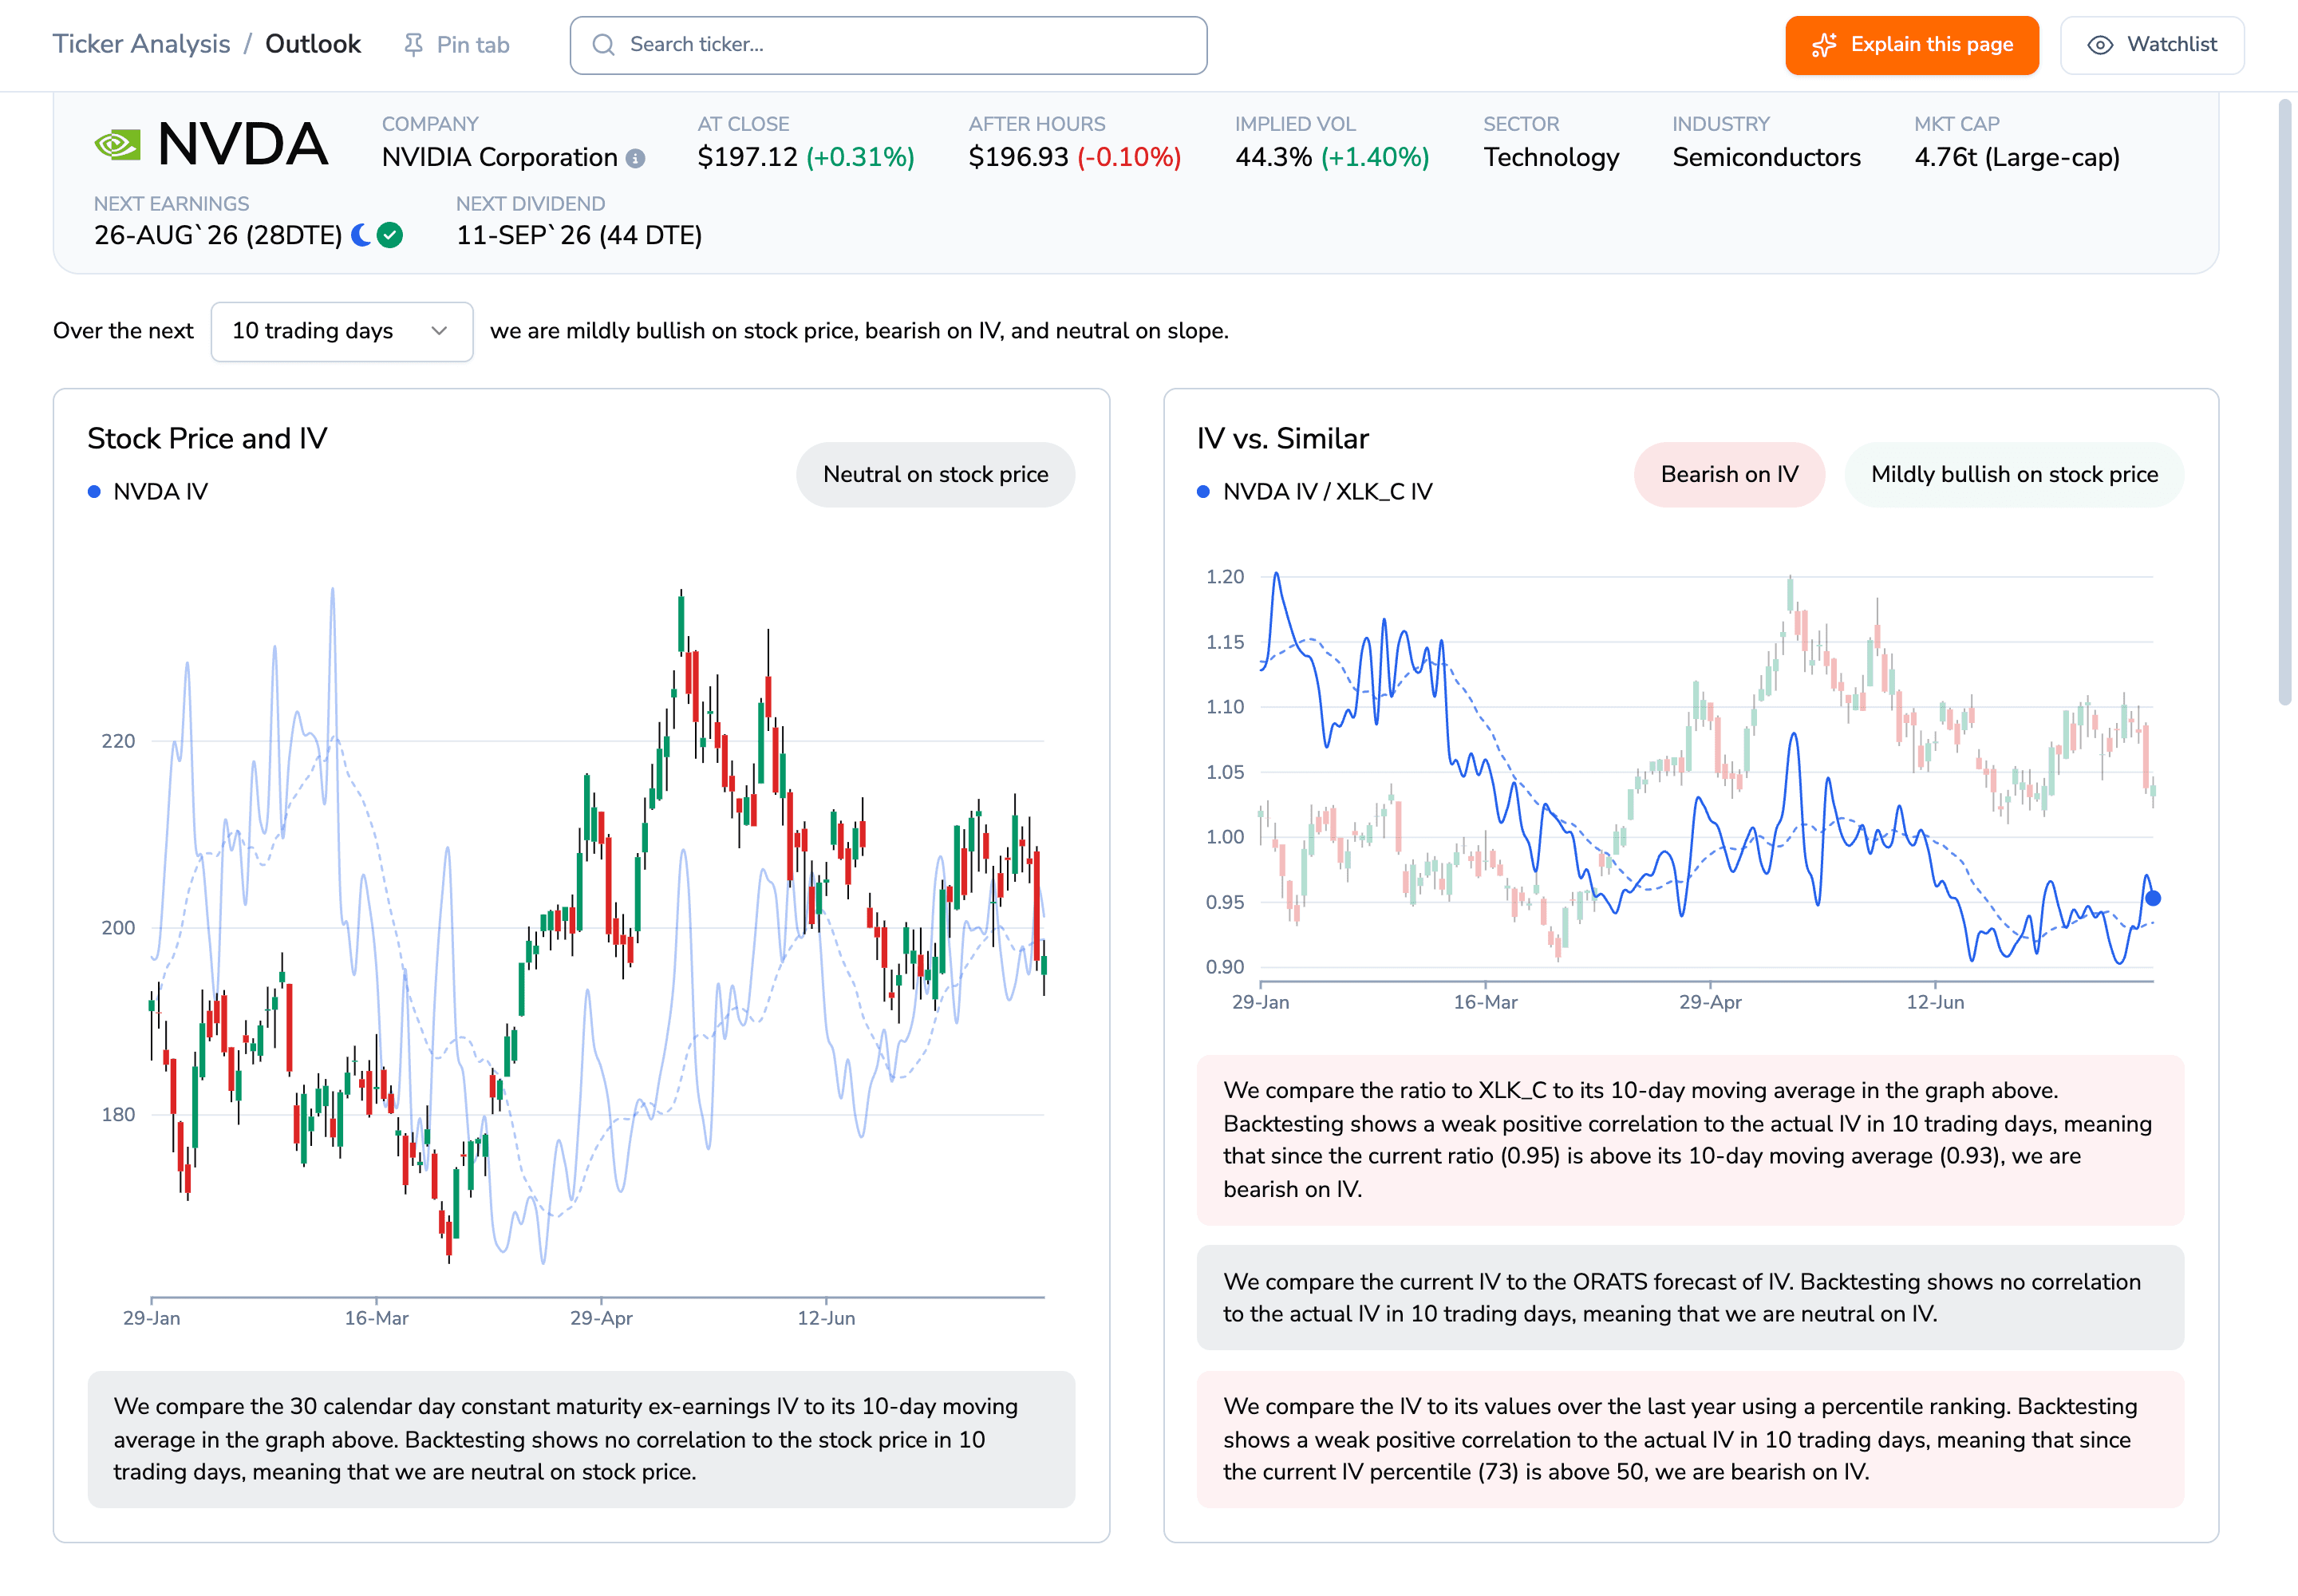
The pre-market board dates the next report August 26; the header's 44.3% is the platform's displayed vol, a shade under the settled 44.5 in the text. Source: ORATS dashboard, Outlook.
Constant-maturity 30-day IV averages the expirations bracketing 30 days, so once the expiry spanning a scheduled report feeds that average, the event's variance phases into the headline number. ORATS publishes the same figure with the earnings effect removed, exErnIv30d on /datav2/hist/cores, and the difference is the priced hump. I check that split before reading any headline IV move on a name within five weeks of a report.
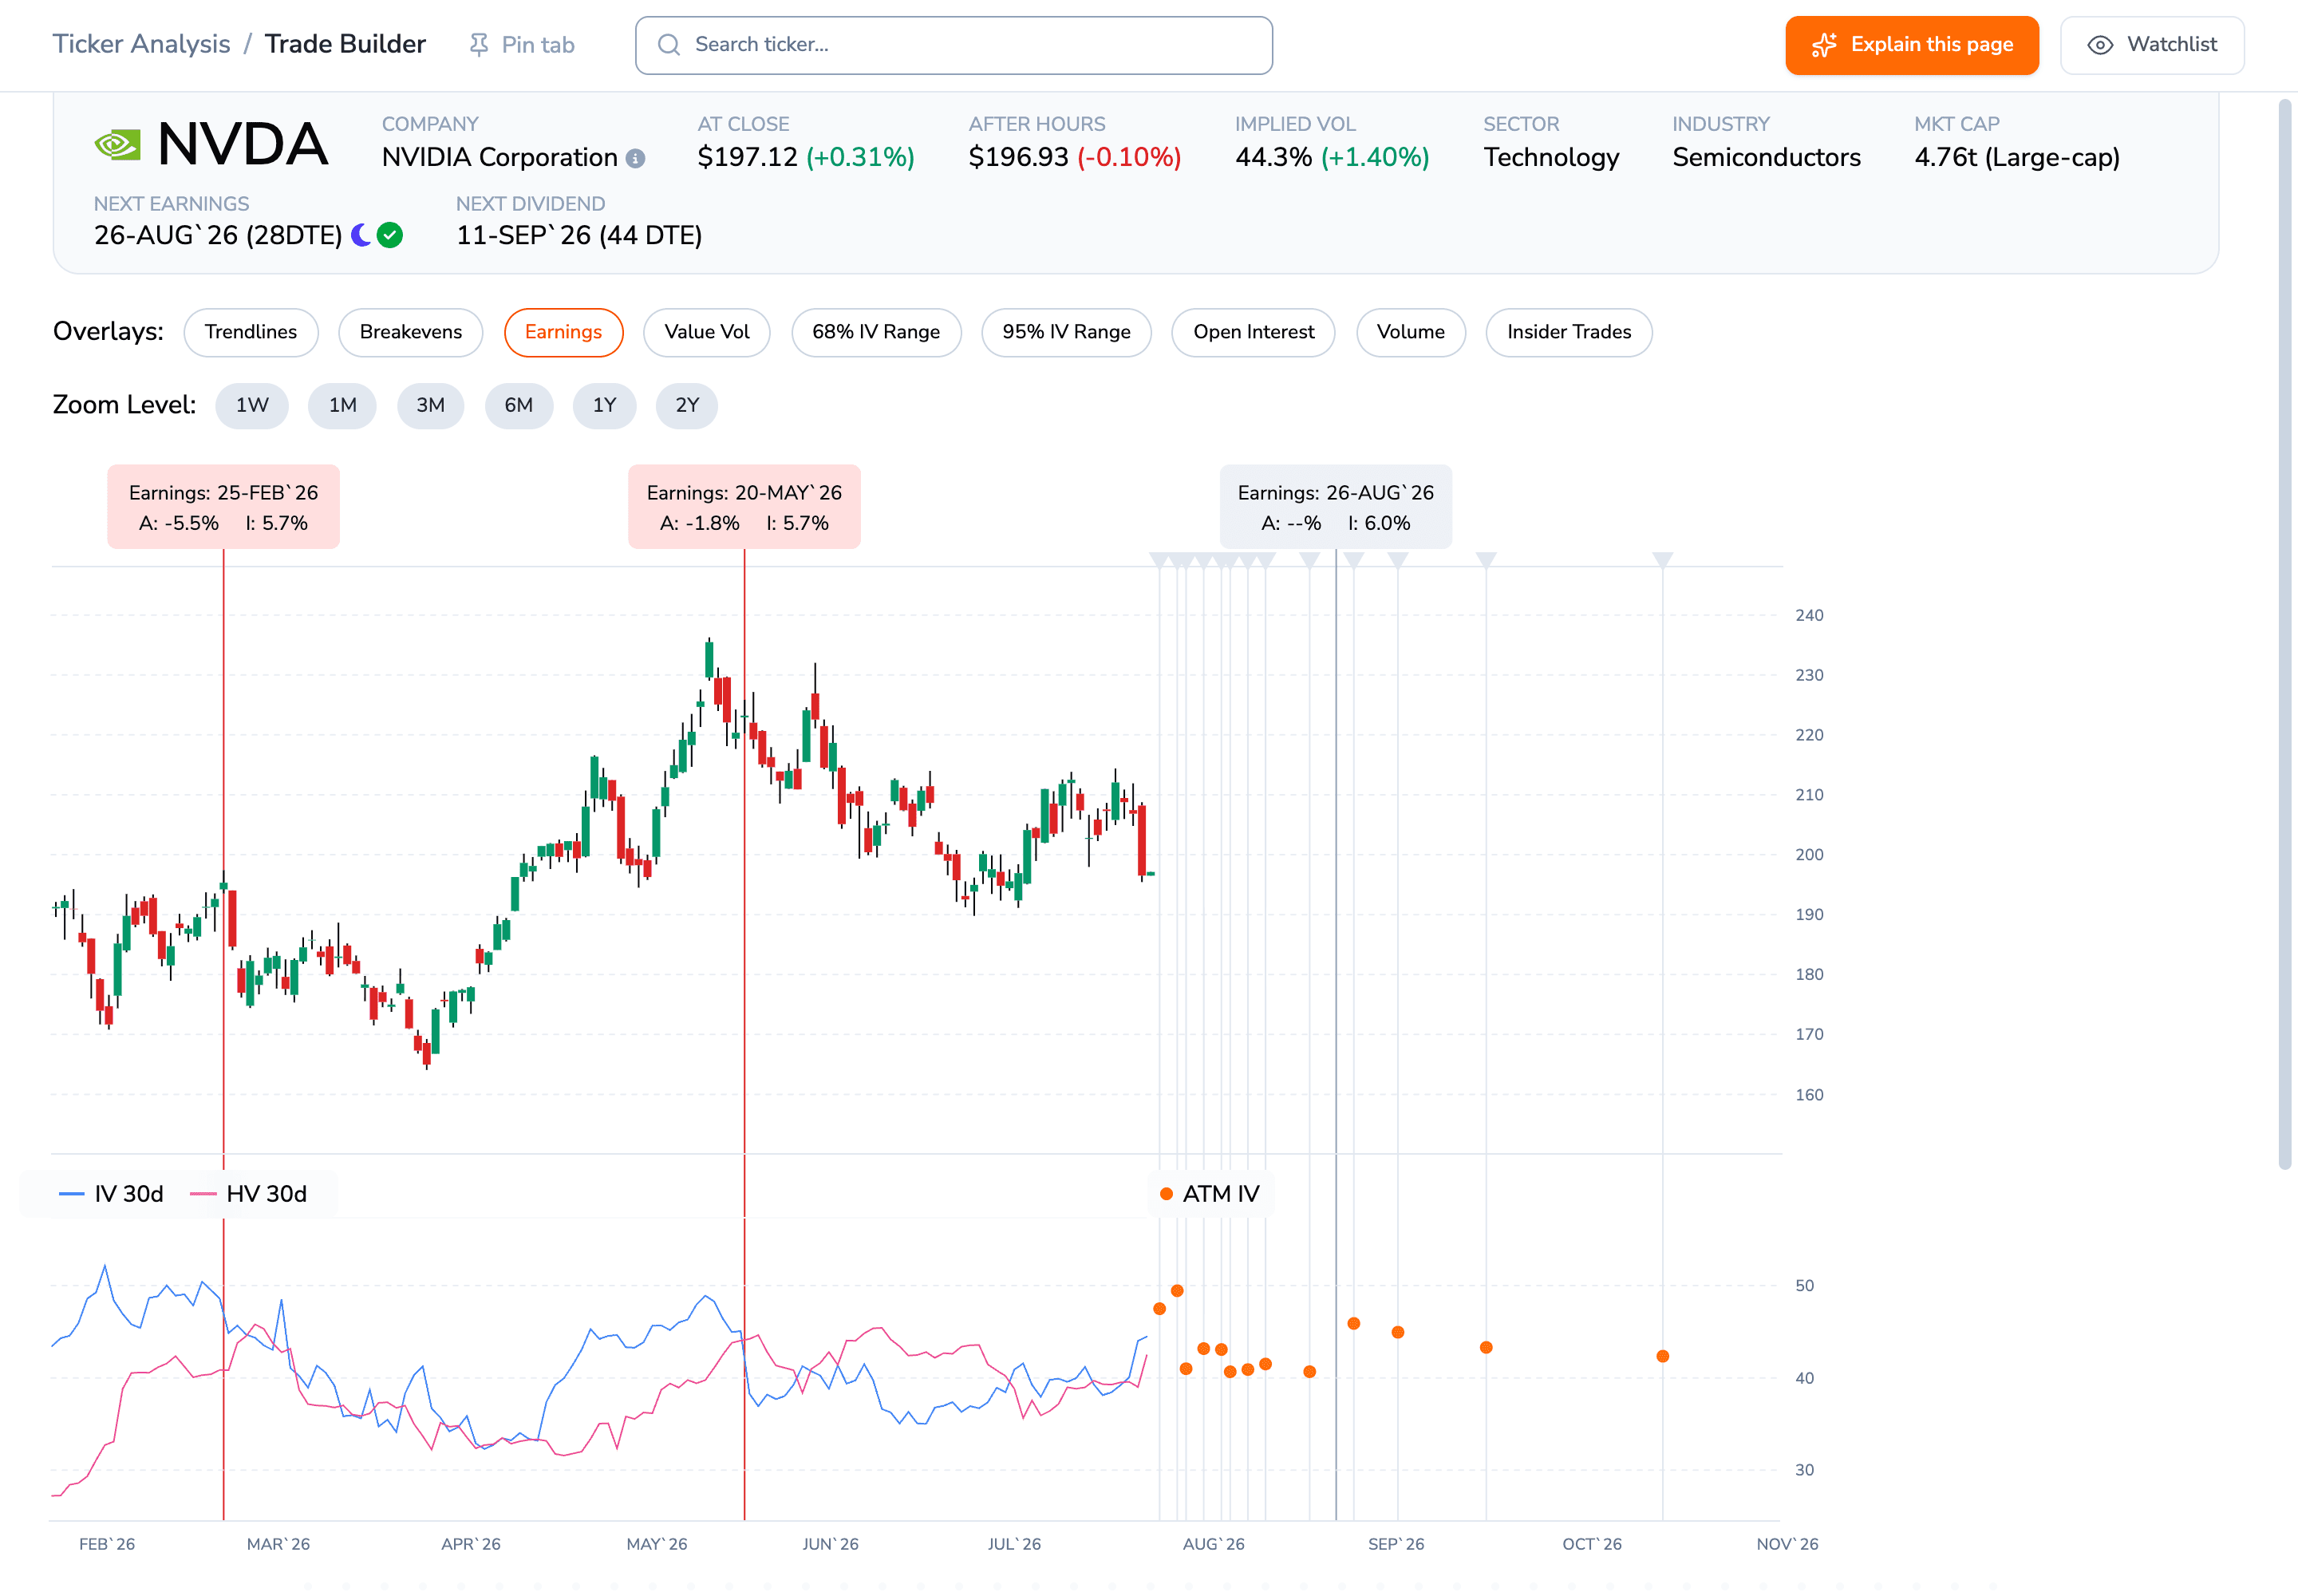
The August 26 marker's 6.0% is the platform's live feed (6.04%), computed separately from and a shade under the settled 6.16% in the text, next to 5.7% at each of the last two prints; the lower panel plots IV 30d against HV 30d. Source: ORATS dashboard, Trade Builder.
What actually repriced, and what didn't
The hump went from zero Thursday to 3.7 points Tuesday. The ex-earnings base added a real but modest 1.5 points to 40.8, the 77th percentile of its year, a two-session rise its own history matched 27% of the time, and Tuesday gave back a quarter of Monday's 2-point base jump.
Default fear would land in the put wings and the long tenors, and all of them lagged: the 25-delta put-over-call wing narrowed from 5.5 to 4.7 points, the deepest puts (the 5-delta wing) added just 0.7 points against the at-the-money's 4.5, and one-year IV slipped to 42.4, the 36th percentile.
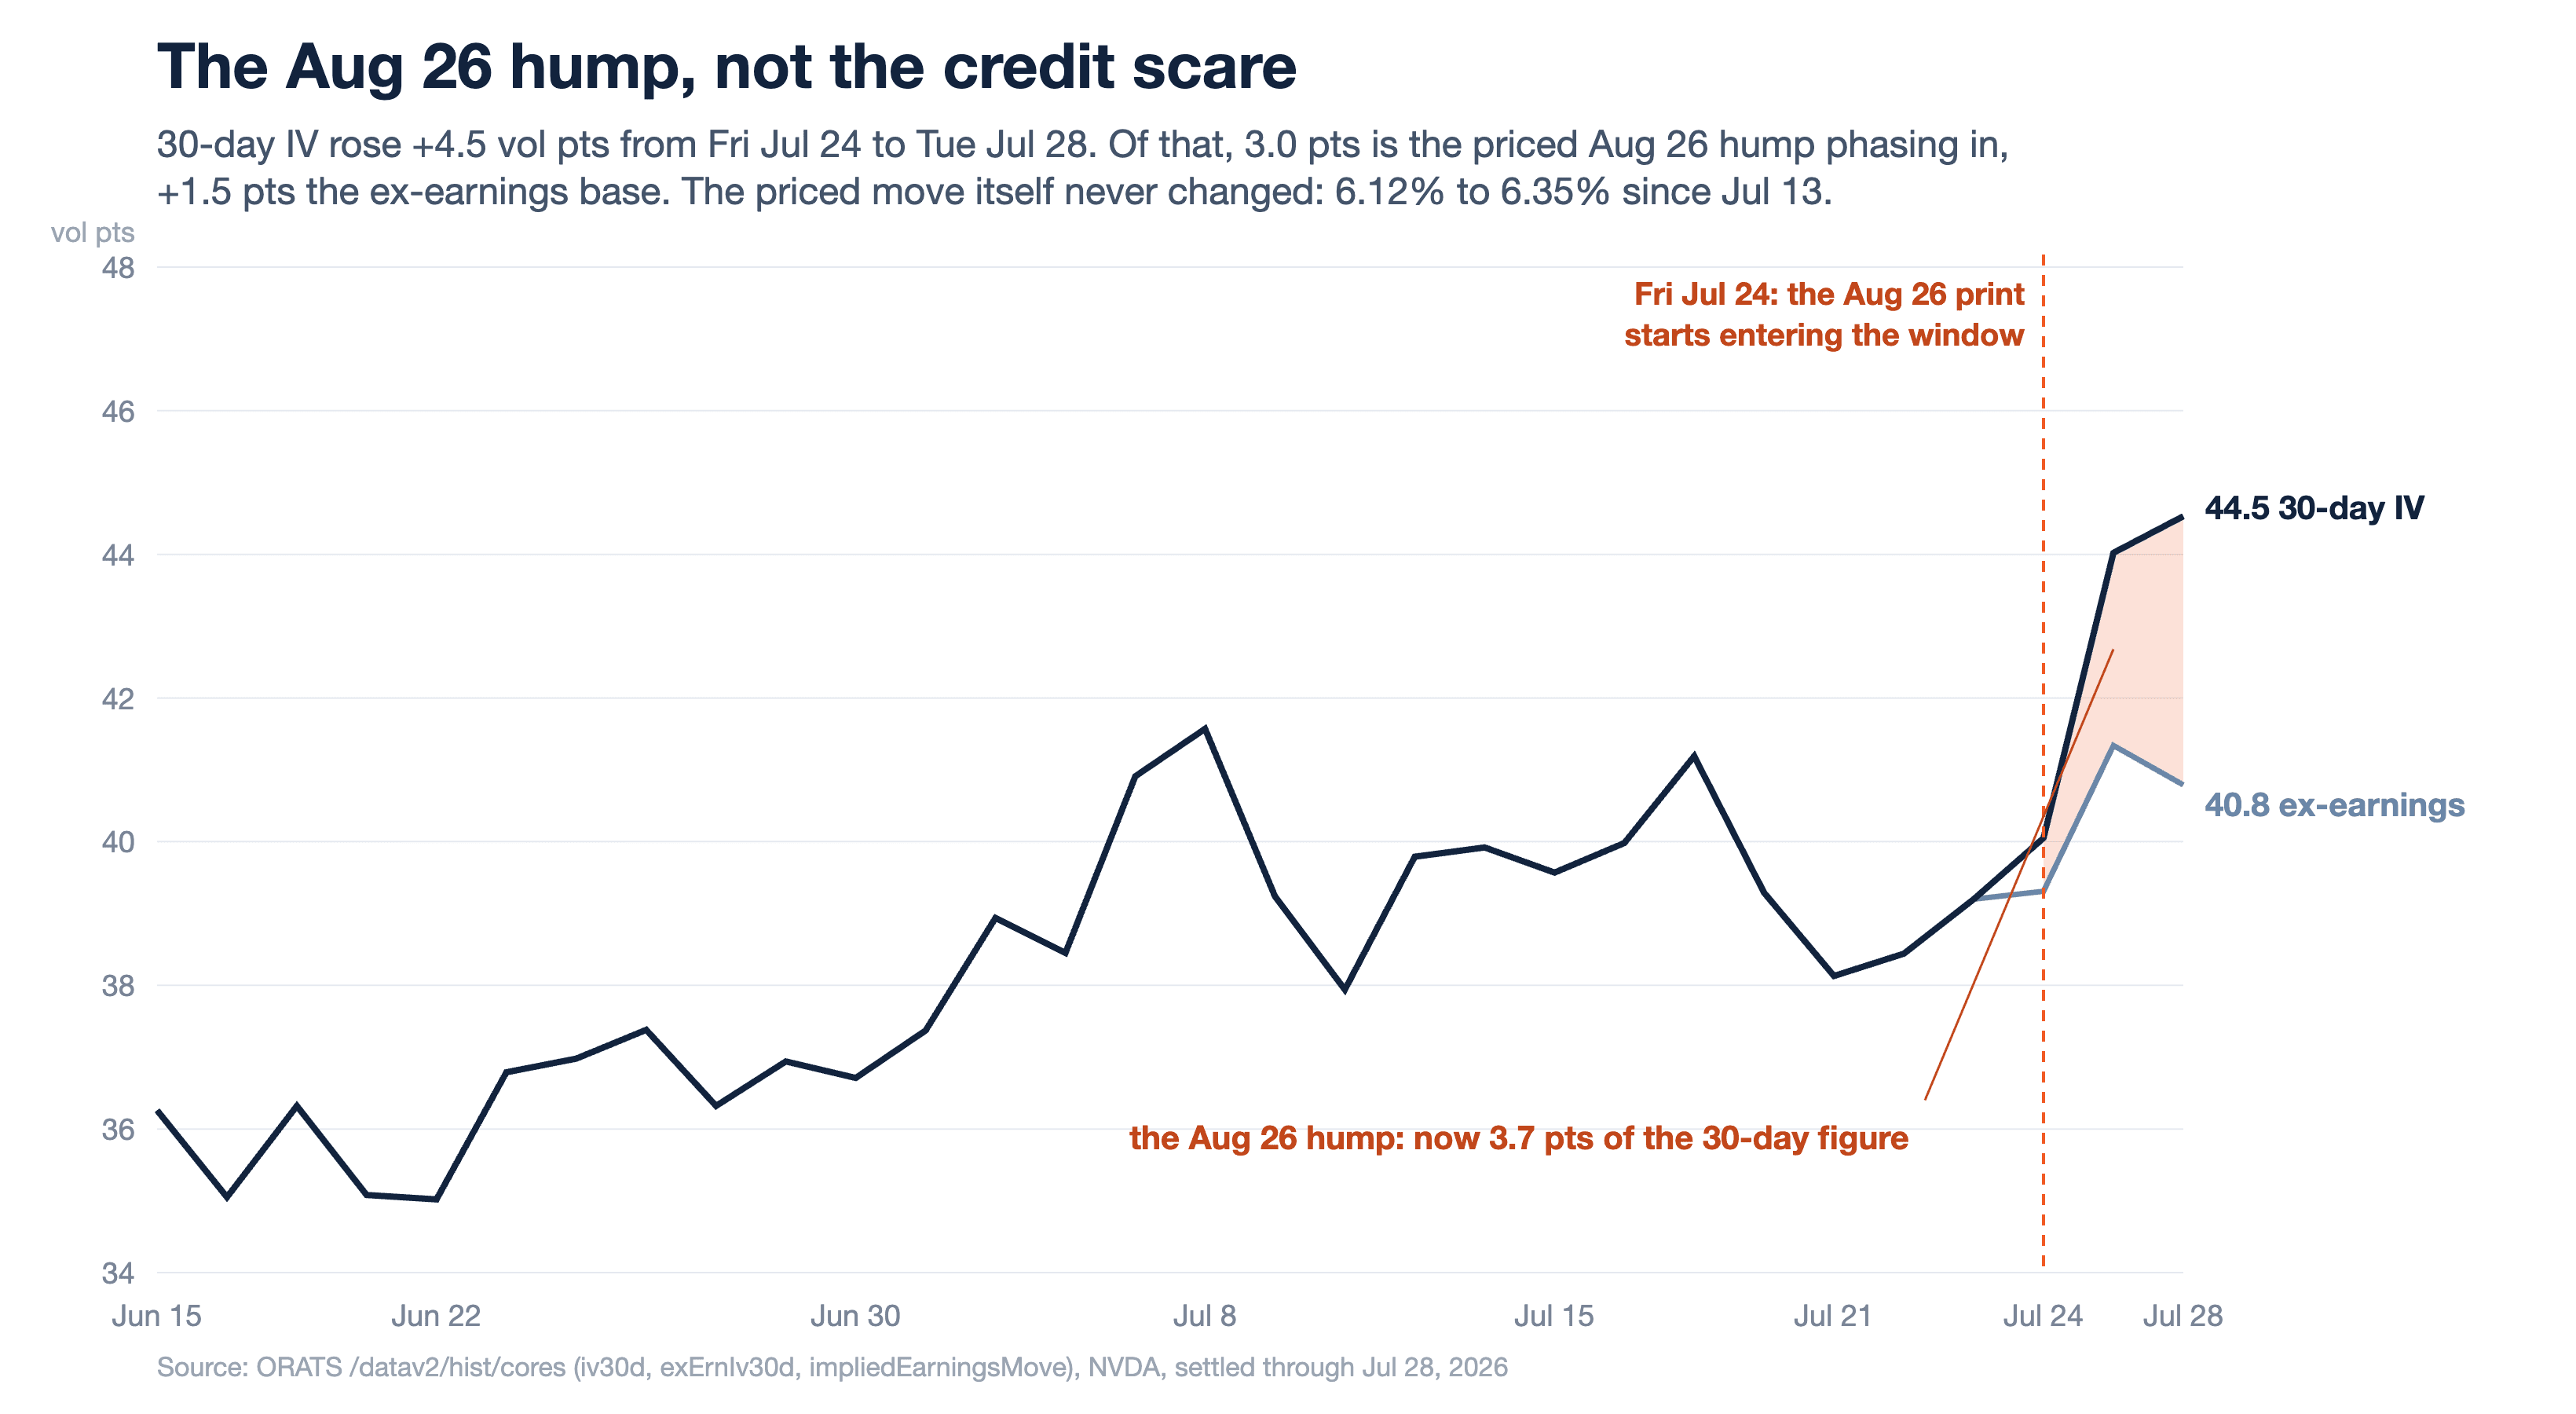
The lines coincide until Friday July 24, when the August 26 report starts phasing into the 30-day window; the wedge is 3.7 points by Tuesday. Source: ORATS /datav2/hist/cores.
The whole late-August cohort spiked the same way
Nineteen liquid names carry earnings dates in the week of August 24. Since Friday their median headline 30-day IV is up 10.7% against 1.5% for the other 525 liquid names; ex-earnings, the groups read a nearly identical 1.9% and 1.5%. Eighteen of the nineteen flipped from zero hump that Friday, and 12 of the board's top 20 IV risers owe more than half the move to the hump. The chip ETF SMH's 30-day IV actually fell 0.3 points through a fourth straight chip down day.
Where the credit scare actually shows up
Broadcom, whose credit default swaps also hit a record per LSEG data, added 2.65 ex-earnings points, nearly 80% more than Nvidia's own 1.5-point clean move. Oracle, whose five-year CDS traded at 215 basis points Monday against 144 at the start of the year, fell 0.9 points from the 97th percentile of its year; its re-rating, 32 to 66 vol, happened over the prior year.
One honest limit: a 30-day option prices the next 30 days, not five-year default risk, so the swaps and the options are answering different questions.
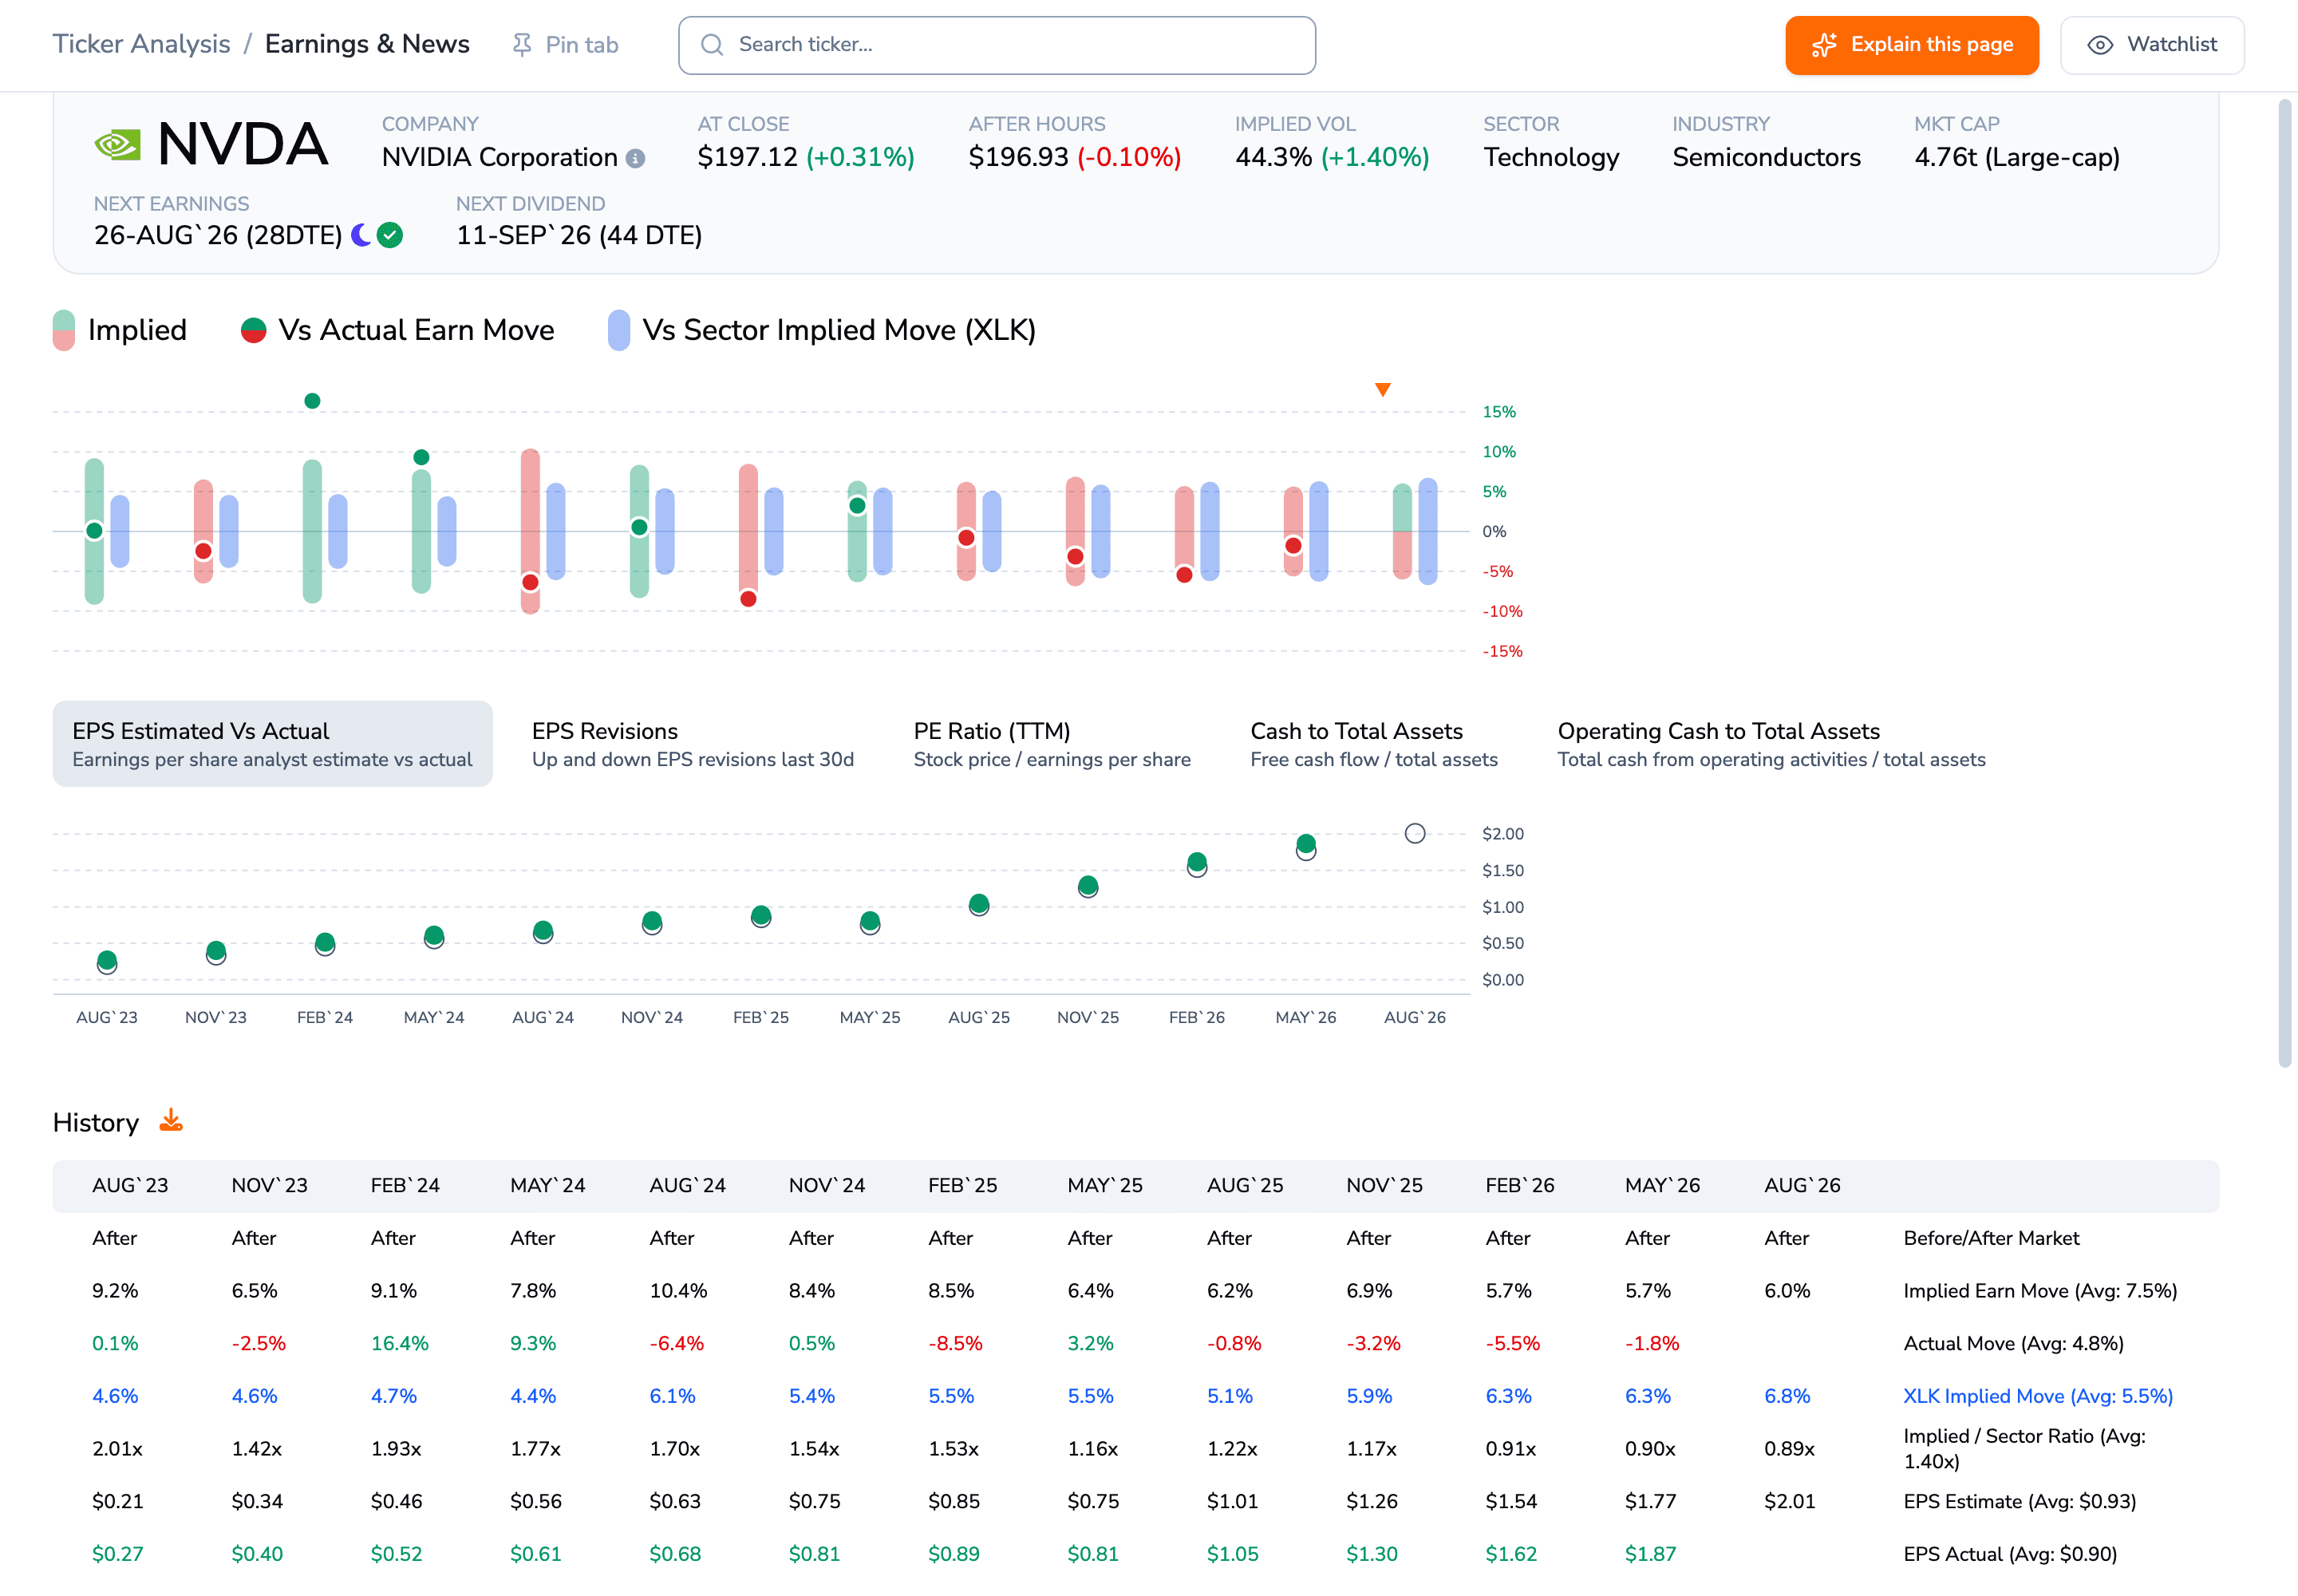
August's 6.0% priced move sits under the panel's shown 7.5% average, and the implied-to-sector ratio has slid to 0.89x. Source: ORATS dashboard, Earnings & News.
Before you attribute a 30-day IV jump to the tape, strip the print: iv30d and exErnIv30d sit in the same row of api.orats.io/datav2/hist/cores, and the ORATS Trade Builder shows the earnings marker beside the headline number.
$NVDA $ORCL $AVGO $SMH
#ImpliedVolatility #EarningsCalendar #Nvidia #CreditRisk #Semiconductors
Disclaimer:
The opinions and ideas presented herein are for informational and educational purposes only and should not be construed to represent trading or investment advice tailored to your investment objectives. You should not rely solely on any content herein and we strongly encourage you to discuss any trades or investments with your broker or investment adviser, prior to execution. None of the information contained herein constitutes a recommendation that any particular security, portfolio, transaction, or investment strategy is suitable for any specific person. Option trading and investing involves risk and is not suitable for all investors.
All opinions are based upon information and systems considered reliable, but we do not warrant the completeness or accuracy, and such information should not be relied upon as such. We are under no obligation to update or correct any information herein. All statements and opinions are subject to change without notice.
Past performance is not indicative of future results. We do not, will not and cannot guarantee any specific outcome or profit. All traders and investors must be aware of the real risk of loss in following any strategy or investment discussed herein.
Owners, employees, directors, shareholders, officers, agents or representatives of ORATS may have interests or positions in securities of any company profiled herein. Specifically, such individuals or entities may buy or sell positions, and may or may not follow the information provided herein. Some or all of the positions may have been acquired prior to the publication of such information, and such positions may increase or decrease at any time. Any opinions expressed and/or information are statements of judgment as of the date of publication only.
Day trading, short term trading, options trading, and futures trading are extremely risky undertakings. They generally are not appropriate for someone with limited capital, little or no trading experience, and/ or a low tolerance for risk. Never execute a trade unless you can afford to and are prepared to lose your entire investment. In addition, certain trades may result in a loss greater than your entire investment. Always perform your own due diligence and, as appropriate, make informed decisions with the help of a licensed financial professional.
Commissions, fees and other costs associated with investing or trading may vary from broker to broker. All investors and traders are advised to speak with their stock broker or investment adviser about these costs. Be aware that certain trades that may be profitable for some may not be profitable for others, after taking into account these costs. In certain markets, investors and traders may not always be able to buy or sell a position at the price discussed, and consequently not be able to take advantage of certain trades discussed herein.
Be sure to read the OCCs Characteristics and Risks of Standardized Options to learn more about options trading.
Related Posts