Market Events
Tuesday, October 13th 2026
The Calm Before the Storm: SPX Options Price 50% Bigger Daily Moves Ahead
ORATS research shows how rising volatility expectations and a crowded catalyst calendar are shaping SPX options pricing through early November.
Summary
SPX options are pricing modest near‑term moves but expect significantly larger daily swings in late October and early November, with average expected moves rising from ±0.55% to ±0.85% and event‑specific premiums of up to 27%; this heightened volatility translates to an implied range of roughly 7,559–8,049 for the index by November 6, reflecting both scheduled catalysts and broader market uncertainty.
October 13, 2026
SPX options are pricing relatively modest daily moves this week, even with the October 14 CPI report and October 15 retail sales release on the calendar. Farther out, expectations increase sharply.
ORATS’ October 12 analysis puts the average daily expected move at ±0.55% for October 13–16, approximately 43 S&P 500 points. That rises to ±0.81% during October 26–30 and ±0.85% during November 2–6, roughly 50% larger.
MarketWatch highlighted the approaching shift in its October 13 coverage, citing ORATS founder Matt Amberson’s description of the current period as “the calm before the storm.” Its story examines the Fed decision, key earnings reports, midterm elections and October jobs report as potential catalysts.
The ORATS research shows how that uncertainty is distributed: higher expected movement across later trading sessions, with additional premiums around specific events.
Where the Largest Moves Are Priced
Three sessions stand out. The October 28 Fed decision carries an expected move of ±0.90%, followed by ±0.94% on October 29. November 4, the session after the midterms, has the largest expected move at ±1.02%.
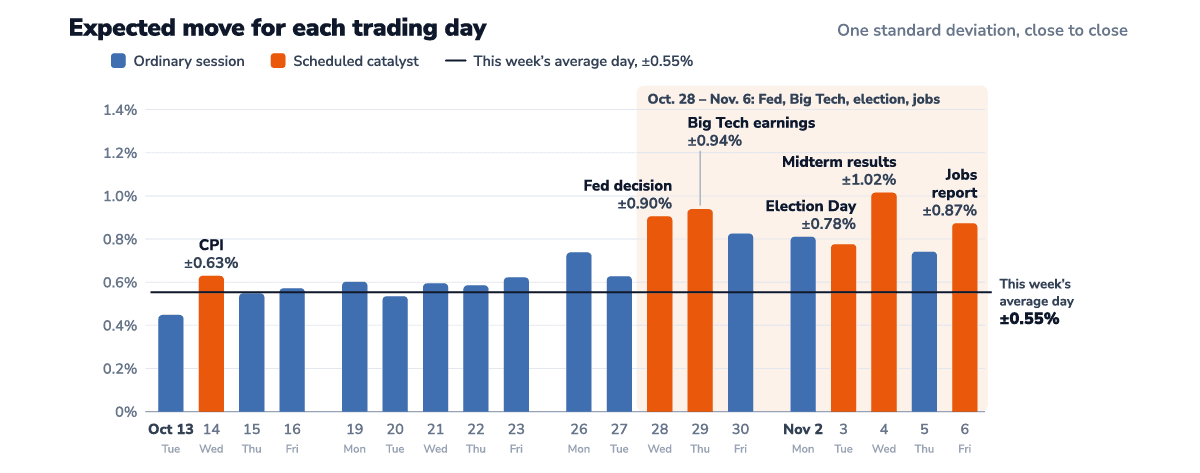
Daily one-standard-deviation SPX expected moves based on October 12, 2026 pricing. Orange bars mark scheduled catalysts; the horizontal line shows the October 13–16 average of ±0.55%.
Several catalysts share these sessions. October 29 combines Big Tech earnings reactions with GDP and PCE releases. November 4 combines the reaction to election results with ADP employment and ISM Services reports. Its expected move reflects the session’s combined uncertainty, rather than an isolated election effect.
What Each Catalyst Adds
The largest total expected move does not necessarily carry the largest event premium. ORATS compares each session with an estimated normal-day baseline for that date.
The October 14 CPI session carries a 27% expected-move premium, the largest among the highlighted sessions. The Fed decision carries 25%, October 29 carries 26%, and November 4 carries 24%.
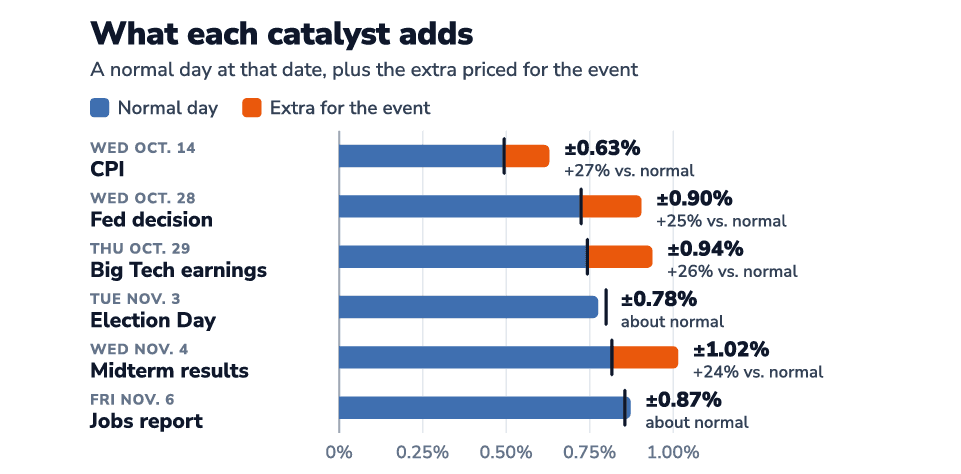
Orange segments show additional expected movement above ORATS’ normal-day baseline at each date. Premiums are measured in expected-move magnitude, or standard deviation, rather than variance.
November 3 carries little additional premium above its baseline ahead of the vote. The larger premium appears the following session, when traders can react to overnight results alongside the scheduled economic releases.
The November 6 jobs report is also priced near its baseline. Its elevated total expected move therefore reflects the higher underlying level of expected movement at that date, with little additional session premium.
Higher Expectations Extend Beyond Event Days
Weekly averages reveal the broader change. Expected daily movement rises from ±0.55% during October 13–16 to ±0.59% during October 19–23, then increases substantially over the following two weeks.
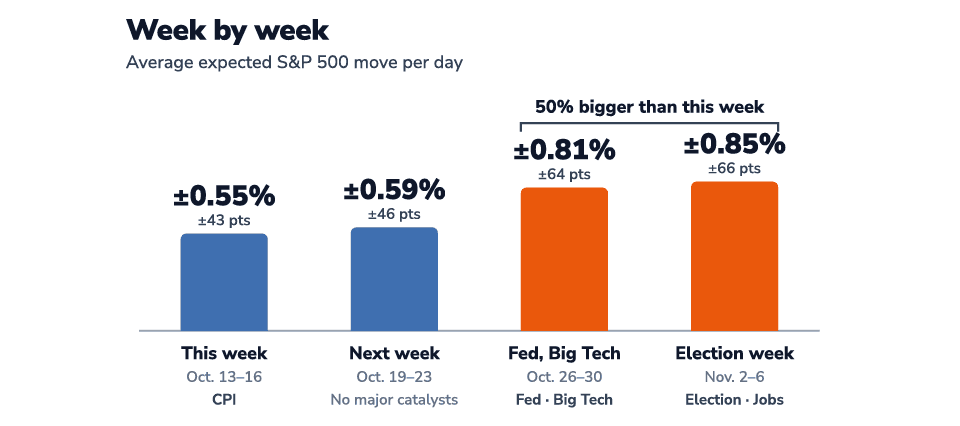
Average daily expected SPX moves: ±0.55% for October 13–16, ±0.59% for October 19–23, ±0.81% for October 26–30 and ±0.85% for November 2–6.
The later weeks are priced approximately 47% and 55% above the October 13–16 average. Ordinary-session expectations also rise, so the increase extends beyond individual catalyst days.
That explains why the weekly increase exceeds the highlighted event premiums. Each event premium is measured against its date-specific baseline; the weekly comparison uses the quieter near-term average.
From the Calendar to the Implied Range
The calendar view brings those daily estimates together. Darker shading shows how elevated expectations spread across late October and early November.
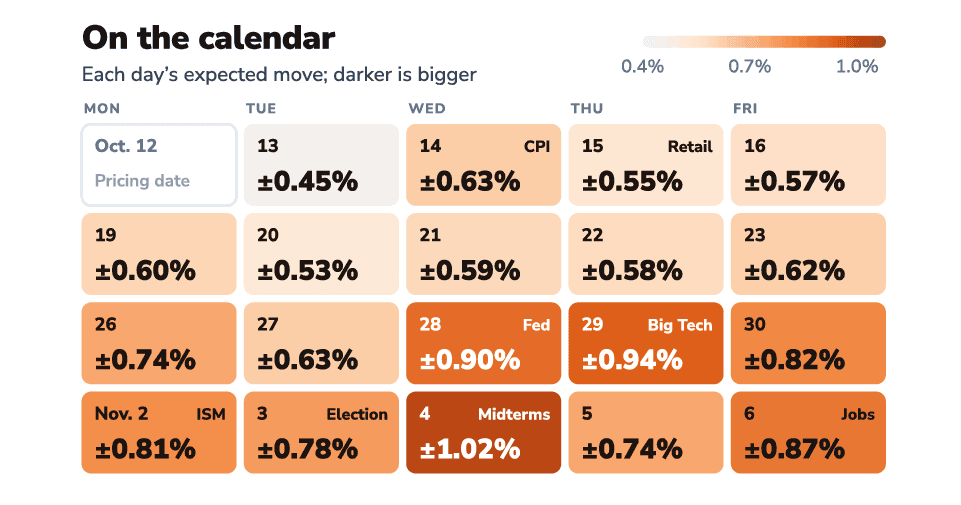
Daily expected SPX moves arranged by trading week. The calendar shows both scheduled catalysts and the surrounding sessions.
Across the full period, SPX options imply a one-standard-deviation range of approximately 7,559–8,049 by November 6, or ±3.1% around the October 12 intraday reference level of 7,804.
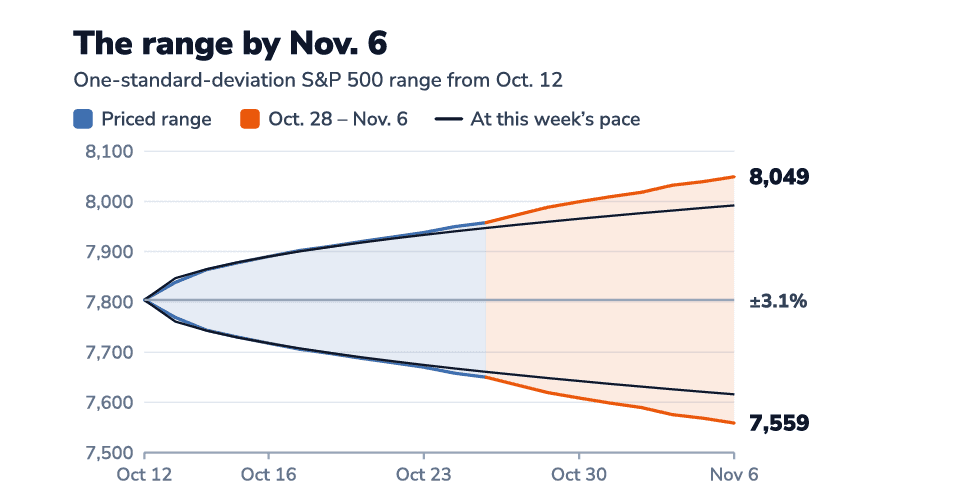
The option-implied November 6 range is approximately 7,559–8,049. Maintaining a constant ±0.55% daily pace across the 19 sessions would instead imply a range of about 7,617–7,991.
SPX options are pricing a quieter near term followed by larger daily moves across late October and early November. The increase extends beyond the major catalyst days, with higher expected movement across ordinary sessions as well.
For traders comparing short-dated expirations, that distinction matters: each expiration carries a different mix of underlying volatility expectations and scheduled event exposure. ORATS’ analysis shows where those differences are priced. The implied range measures potential movement in either direction, rather than a directional forecast.
Source: ORATS derived daily expected moves from forward implied variance between consecutive SPX daily expirations. Each figure represents the median of 43 readings collected on October 12, 2026, between 10:00 a.m. and 1:28 p.m. ET.
Expected moves represent one standard deviation of close-to-close movement. The normal-day baseline estimates event-free movement at each date, with weekends counted as 0.07 of a trading day. All figures reflect the October 12 pricing snapshot and are subject to change.
Disclaimer:
The opinions and ideas presented herein are for informational and educational purposes only and should not be construed to represent trading or investment advice tailored to your investment objectives. You should not rely solely on any content herein and we strongly encourage you to discuss any trades or investments with your broker or investment adviser, prior to execution. None of the information contained herein constitutes a recommendation that any particular security, portfolio, transaction, or investment strategy is suitable for any specific person. Option trading and investing involves risk and is not suitable for all investors.
All opinions are based upon information and systems considered reliable, but we do not warrant the completeness or accuracy, and such information should not be relied upon as such. We are under no obligation to update or correct any information herein. All statements and opinions are subject to change without notice.
Past performance is not indicative of future results. We do not, will not and cannot guarantee any specific outcome or profit. All traders and investors must be aware of the real risk of loss in following any strategy or investment discussed herein.
Owners, employees, directors, shareholders, officers, agents or representatives of ORATS may have interests or positions in securities of any company profiled herein. Specifically, such individuals or entities may buy or sell positions, and may or may not follow the information provided herein. Some or all of the positions may have been acquired prior to the publication of such information, and such positions may increase or decrease at any time. Any opinions expressed and/or information are statements of judgment as of the date of publication only.
Day trading, short term trading, options trading, and futures trading are extremely risky undertakings. They generally are not appropriate for someone with limited capital, little or no trading experience, and/ or a low tolerance for risk. Never execute a trade unless you can afford to and are prepared to lose your entire investment. In addition, certain trades may result in a loss greater than your entire investment. Always perform your own due diligence and, as appropriate, make informed decisions with the help of a licensed financial professional.
Commissions, fees and other costs associated with investing or trading may vary from broker to broker. All investors and traders are advised to speak with their stock broker or investment adviser about these costs. Be aware that certain trades that may be profitable for some may not be profitable for others, after taking into account these costs. In certain markets, investors and traders may not always be able to buy or sell a position at the price discussed, and consequently not be able to take advantage of certain trades discussed herein.
Be sure to read the OCCs Characteristics and Risks of Standardized Options to learn more about options trading.
Related Posts