Earnings
Tuesday, October 12th 2021
Earnings Options Strategies Backtest
The Earnings Move report contains important information for options traders which was tested to determine the best strategy for the implied, historical and forecast volatilities.
Summary
ORATS Earnings Move Report provides important information for earnings options traders like implied move, historical average move, implied volatility with earnings and taken out, and historical volatility with and without earnings. Four options strategies were tested, and the best performing strategy was the long calendar. The worst performing strategy was the long straddle in sample and short calendar out of sample. The report includes sample trades and triggers for each strategy.
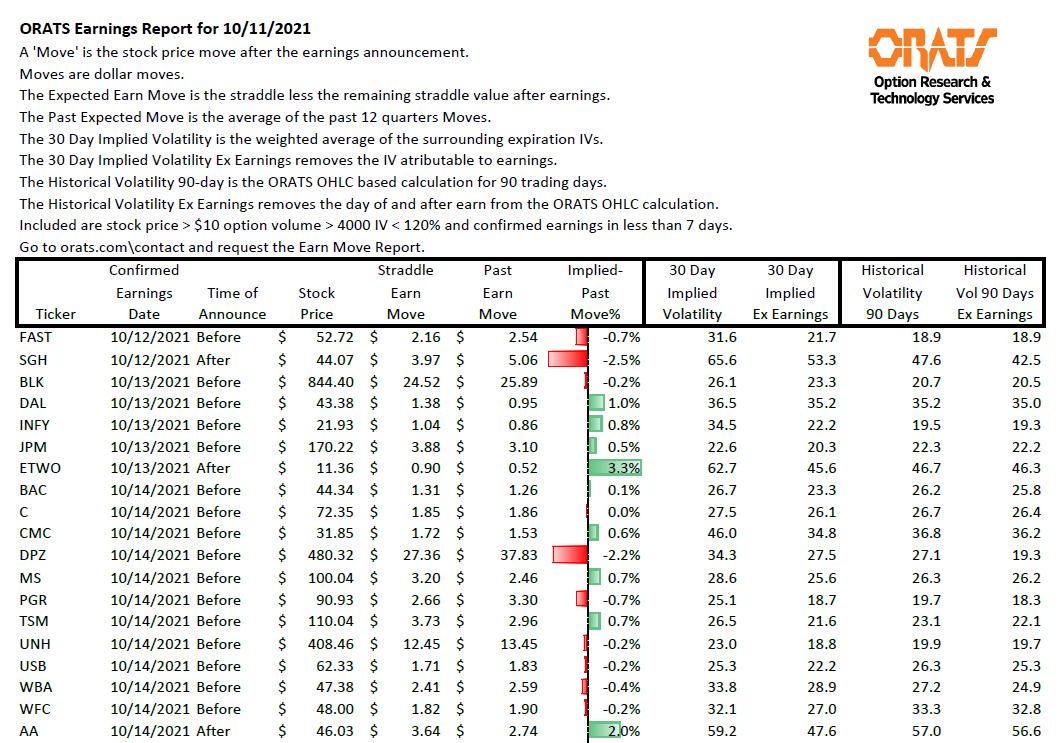
The ORATS Earnings Move Report is published each trading day and shows the stocks that have confirmed earnings announcements. The report has important information for earnings options traders like:
- the implied move in the stock,
- the historical average move in the stock,
- the implied volatility with earnings and taken out, and
- historical volatility with and without earnings.
This information was tested to see if it can identify profitable trades in a backtest. Here's a sample of a report:\
Four options strategies, buying and selling straddles, and buying and selling calendar spreads were tested, entering the day before the announcement and exiting the day after - a one day hold.
The best buy straddle was the one between 14 and 365 days to expiry that had the highest forecast theoretical value ratio to the mid market value. Conversely, the best sell had the lowest ratio. The best calendar used the best buy and sell concurrently and if the buy straddle was a longer duration it was termed a long calendar and was tested separately from those that happened to be short calendars.
ORATS forecasts the entire surface using the next 20 trading days volatility derived from historical volatility and combines this with forecasts of long term cross sectional implied volatility, put call slope and derivative (skewness and kurtosis), and earnings forecasts. This creates a theoretical value for every call and put option.
Triggers tested for determining whether to enter one of the four strategies were:
- short leg forecast ratio
- long leg forecast ratio
- implied earnings move divided by historical average move in the stock
- implied volatility divided by historical volatility
- implied volatility divided by implied volatility with earnings effect taken out
For example, one of the best triggers for Buy Straddle were high forecast ratios for both the short and long leg even though only the long leg was traded and others. ORATS subscribers can email me for the best triggers for each strategy.
Earn move reports from January 2020 until July 2021 were used in the test and reports from July 2021 to October 2021 were used as an out of sample test.
Here are the results of the test.
- The best performing strategy out of sample was the long calendar.
- The worst performing strategy was the long straddle in sample and short calendar out of sample (only one trade however).
- 5217 earnings announcements and 20,868 trades were tested.
- To normalize the different trades, the profit for each was divided by the stock price.
In sample, the Buy Straddle returned 0.40% on 68 trades representing 1.3% of the possible earnings announcements with the largest loss of -3.8% and largest gain of 13.7%. Out of sample, the Buy Straddle returned 0.65% on 13 trades.
In sample, the Sell Straddle returned 1.18% on 214 trades representing 4.1% of the possible earnings announcements with the largest loss of -26.7% and largest gain of 8.3%. Out of sample, the Sell Straddle returned 0.65% on 54 trades.
In sample, the Buy Calendar returned 0.90% on 205 trades representing 3.9% of the possible earnings announcements with the largest loss of -10.3% and largest gain of 6.1%. Out of sample, the Buy Calendar returned 0.91% on 54 trades.
In sample, the Sell Calendar returned 0.50% on 37 trades representing 0.7% of the possible earnings announcements with the largest loss of -2.4% and largest gain of 8.7%. Out of sample, the Sell Calendar returned 0.00% on 0 trades.
Here are a couple of sample trades, the best (SFIX) and worst (FDX) calendar from out of sample. They happened to be on the same day:
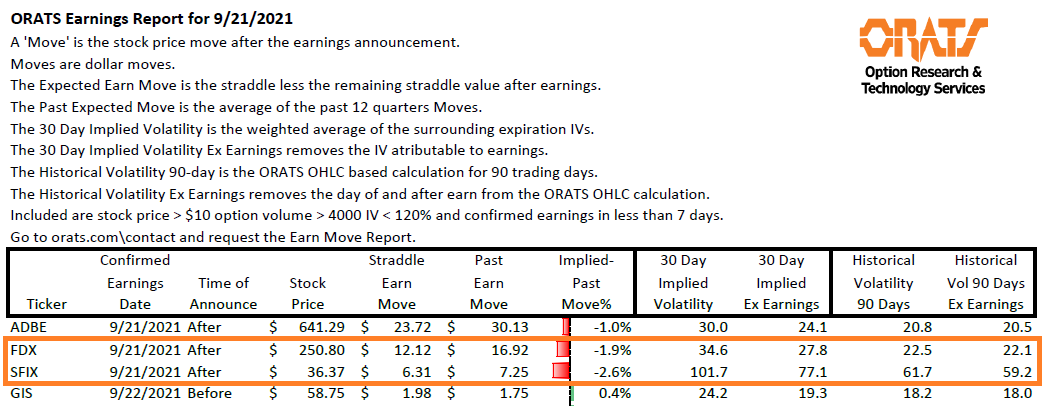
One of the triggers for the long calendar was a high ex earnings IV divided by HV. You can see how high both FDX and SFIX were going into earnings.
SFIX 10/8/2021 $37 strike straddle was sold for $7.725 and the 3/18/2022 $40 was bought for $15.375 representing a forecast ratio of 0.75 and 1.25 respectively. Each strike represents the closest to a 50 delta. At the time of the opening trade simulation 14 minutes prior to the close, SFIX stock price was $35.82 (the report shows $36.37). The next day at 14 minutes before the close when the trade was exited the price was $41.35 up $5.53. The earnings move was $0.78 less than expected. The short was bought back for $5.75 and long sold for $14.75 for profits of $1.975 and -$0.625 respectively or a total profit of $1.35 or 3.8%.
FDX 10/8/2021 $255 straddle was sold for $16.85 and the 6/17/2022 $260 was bought for $53.025 with forecast ratios of 0.72 and 1.09. The stock price fell from $252.87 to $229.97 down $22.90 or $10.88 larger move than expected. The short was bought back for $25.86 and long straddle sold for $52.925 for losses of -$9.01 and -$0.10. The total loss was -$9.11 or 3.6%.
To subscribe to the earnings report, visit the web page here. https://www.orats.com/earnings/
To inquire about the signals please email me at matt@orats.com
More reading here: https://blog.orats.com/hs-search-results?term=earnings+move
Disclaimer:
The opinions and ideas presented herein are for informational and educational purposes only and should not be construed to represent trading or investment advice tailored to your investment objectives. You should not rely solely on any content herein and we strongly encourage you to discuss any trades or investments with your broker or investment adviser, prior to execution. None of the information contained herein constitutes a recommendation that any particular security, portfolio, transaction, or investment strategy is suitable for any specific person. Option trading and investing involves risk and is not suitable for all investors.
All opinions are based upon information and systems considered reliable, but we do not warrant the completeness or accuracy, and such information should not be relied upon as such. We are under no obligation to update or correct any information herein. All statements and opinions are subject to change without notice.
Past performance is not indicative of future results. We do not, will not and cannot guarantee any specific outcome or profit. All traders and investors must be aware of the real risk of loss in following any strategy or investment discussed herein.
Owners, employees, directors, shareholders, officers, agents or representatives of ORATS may have interests or positions in securities of any company profiled herein. Specifically, such individuals or entities may buy or sell positions, and may or may not follow the information provided herein. Some or all of the positions may have been acquired prior to the publication of such information, and such positions may increase or decrease at any time. Any opinions expressed and/or information are statements of judgment as of the date of publication only.
Day trading, short term trading, options trading, and futures trading are extremely risky undertakings. They generally are not appropriate for someone with limited capital, little or no trading experience, and/ or a low tolerance for risk. Never execute a trade unless you can afford to and are prepared to lose your entire investment. In addition, certain trades may result in a loss greater than your entire investment. Always perform your own due diligence and, as appropriate, make informed decisions with the help of a licensed financial professional.
Commissions, fees and other costs associated with investing or trading may vary from broker to broker. All investors and traders are advised to speak with their stock broker or investment adviser about these costs. Be aware that certain trades that may be profitable for some may not be profitable for others, after taking into account these costs. In certain markets, investors and traders may not always be able to buy or sell a position at the price discussed, and consequently not be able to take advantage of certain trades discussed herein.
Be sure to read the OCCs Characteristics and Risks of Standardized Options to learn more about options trading.
Related Posts