Market Events
Thursday, March 19th 2020
Extreme Fear. Is This The Bottom? Charting The Virus With Options Data
Options information like implied volatility, bid-ask width, and put call strike slope can show fear in the broad market and be useful for identifying bottoms.
Summary
Options data like implied volatility, bid-ask width, and put-call strike slope can indicate fear and capitulation in the market, potentially signaling a bottom. The SPY volatility and bid-ask width have surpassed 2008 levels, indicating panic and capitulation. The IWM, DIA, and NDX also show high levels of fear. However, it is uncertain whether the virus will have a greater impact on the market than the 2008 financial crisis.
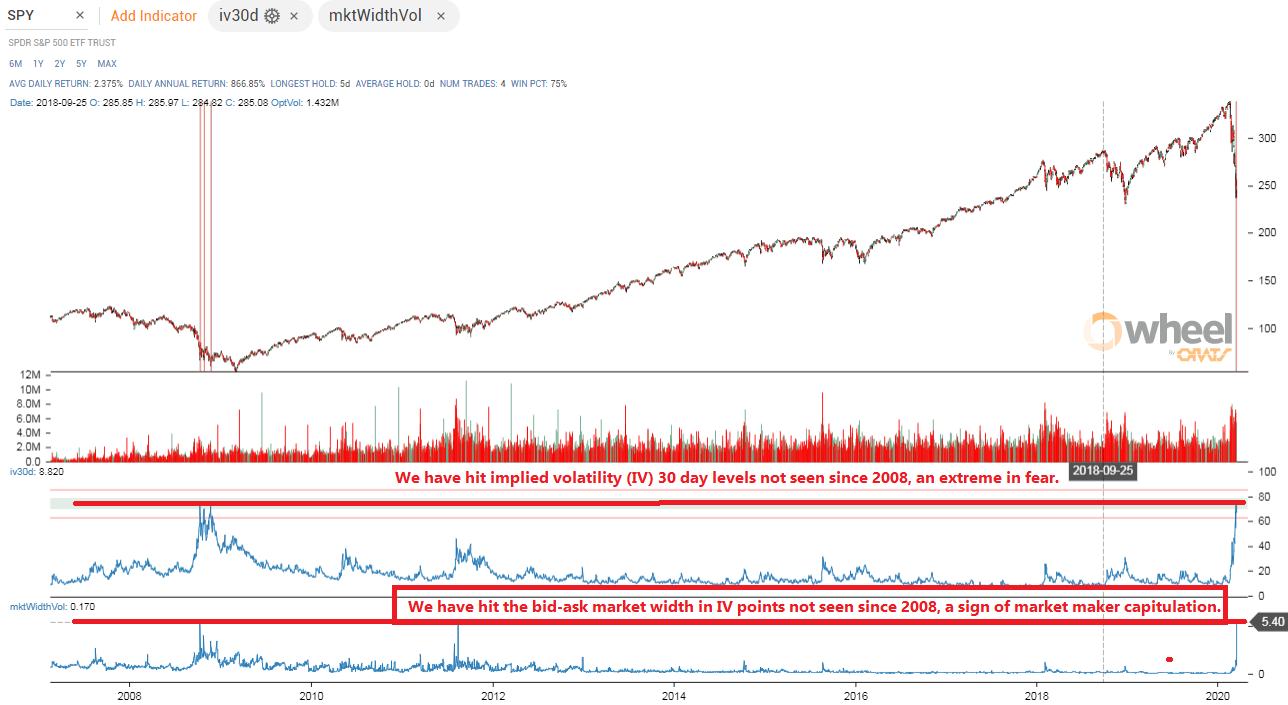
Update for March 18th, 2020. Previously, the SPY volatility had not surpassed 2008 levels, now it has with the IV as high as 85% before backing off. The other indicator that had not reached 2008 levels was the bid-ask width in IV points that did reach 2008 levels intraday before backing off. This is a sign of panic and capitulation and a sign of market bottoms. I think there could be a rally here but it feels like the worst is yet to come.
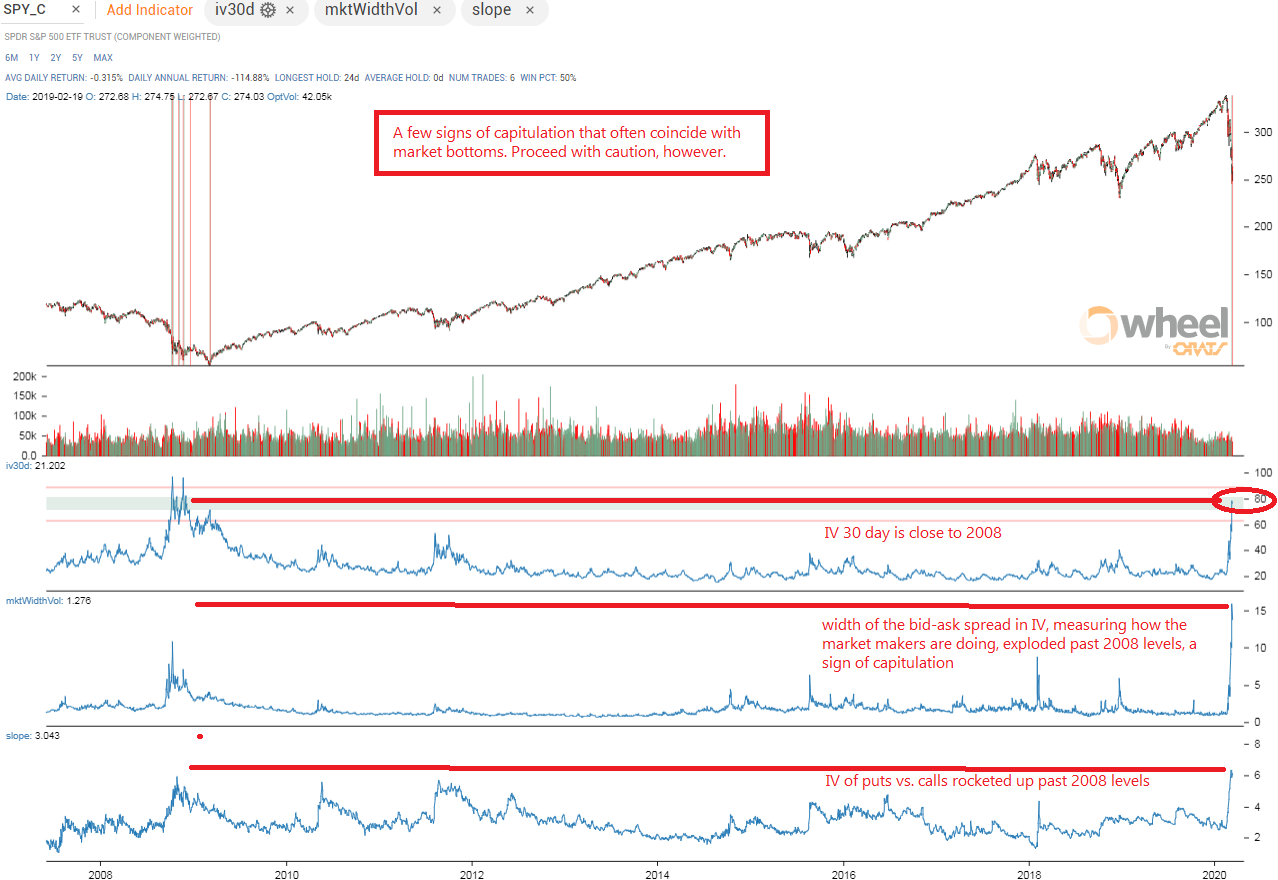
Original post on March 15th, 2020. Capitulation and fear in a market can indicate a market bottom. Options volatility information, like implied volatility (IV), options markets bid-ask widths, and put-call slope, are gauges for fear and capitulation. The best example of options information identifying these market emotions was the 2008 global financial crisis levels. When IV, market width, and slope rose to new highs, those peaks coincided with valleys in the stock market.
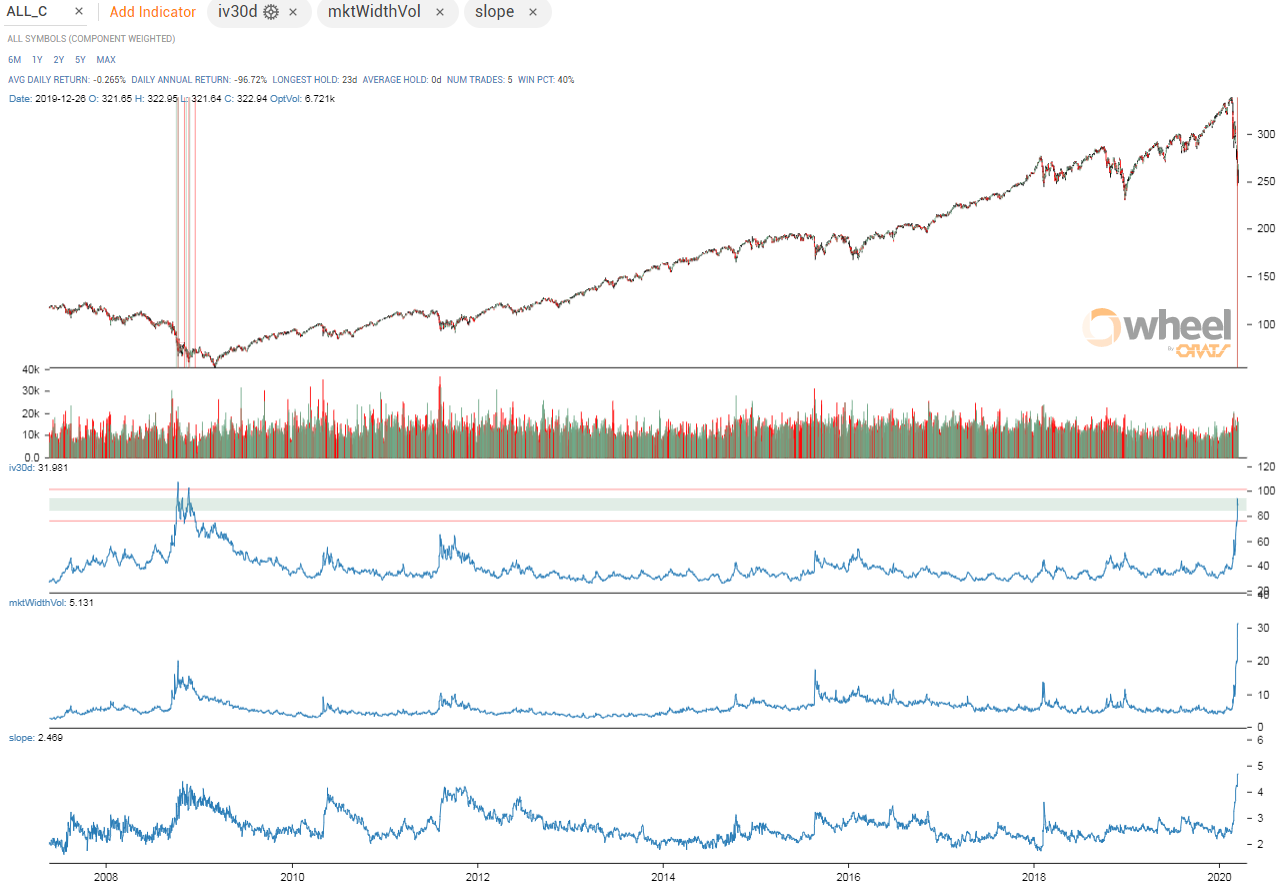
One way to observe fear in a market is to average options calculations over may symbols. ORATS calculates and groups options information into component weighted symbols. For example, the SPY component weighted calculations we save under "SPY_C". We do this for the following symbols including averaging all symbols under "ALL_C":
ALL_C ,DIA_C ,DJX_C ,GDX_C ,IBB_C ,IGN_C ,ITB_C ,IWM_C ,IYR_C ,KBE_C ,KRE_C ,MDY_C ,NDX_C ,NQX_C ,OIH_C ,QQQ_C ,RUT_C ,SMH_C ,SPX_C ,SPY_C ,XBI_C ,XHB_C ,XLB_C ,XLC_C ,XLE_C ,XLF_C ,XLI_C ,XLK_C ,XLP_C ,XLRE_C ,XLU_C ,XLV_C ,XLY_C ,XOP_C ,XSP_C
For each "_C" symbol we present weighted average calculations for all of our Core data. For example, IV30 for QQQ_C is the weighted average of the Nasdaq 100, 30 day IVs for each component. These averages can be seen charted historically in the Indicator graphing tool which you can use for free at wheel.orats.com
Let's look at the major market wide ETFs and their components.
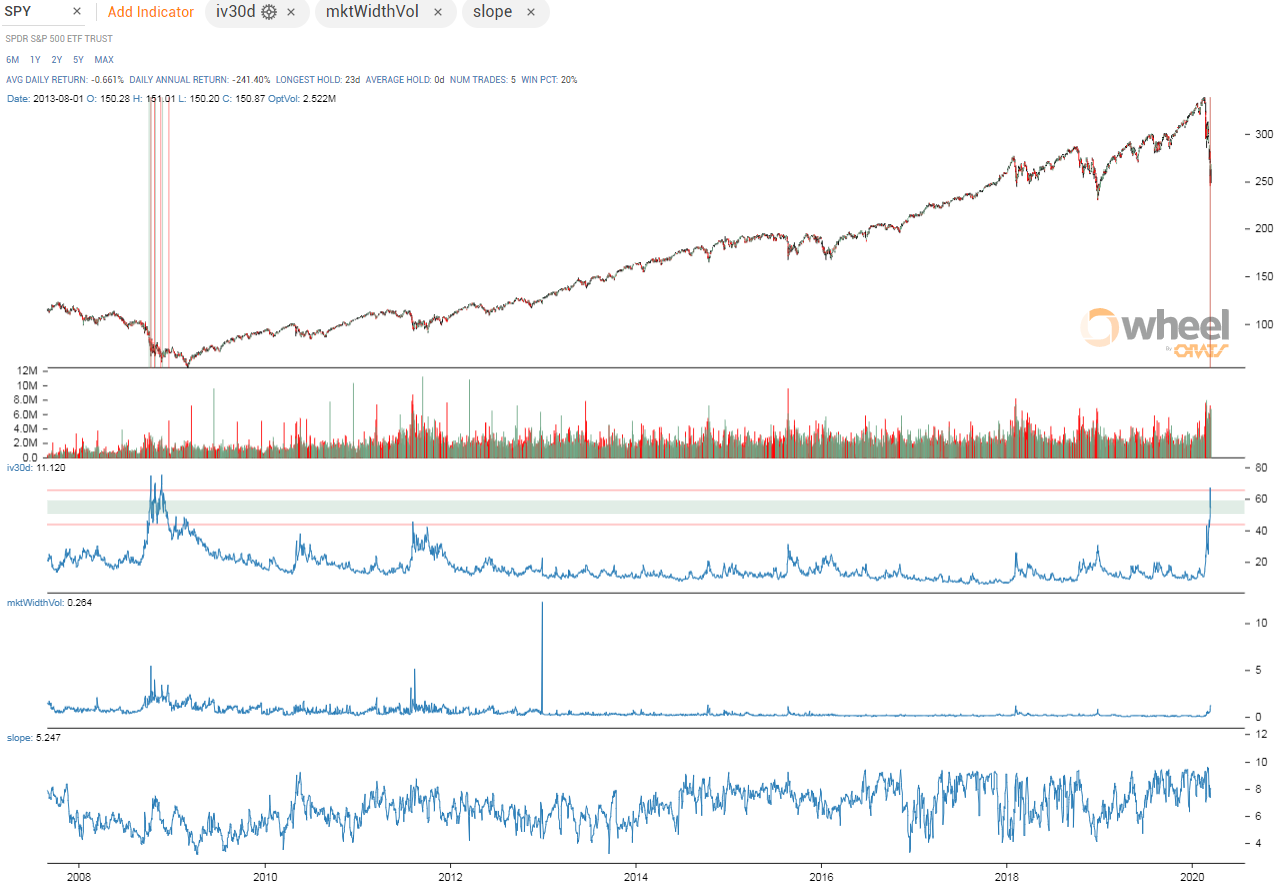
The components of SPY, had implied volatility rise to nearly 2008 global financial crisis levels. The market width of options bid-ask spreads, measured in volatility points, far surpassed 2008. The slope of the implied volatility skew surpassed 2008.
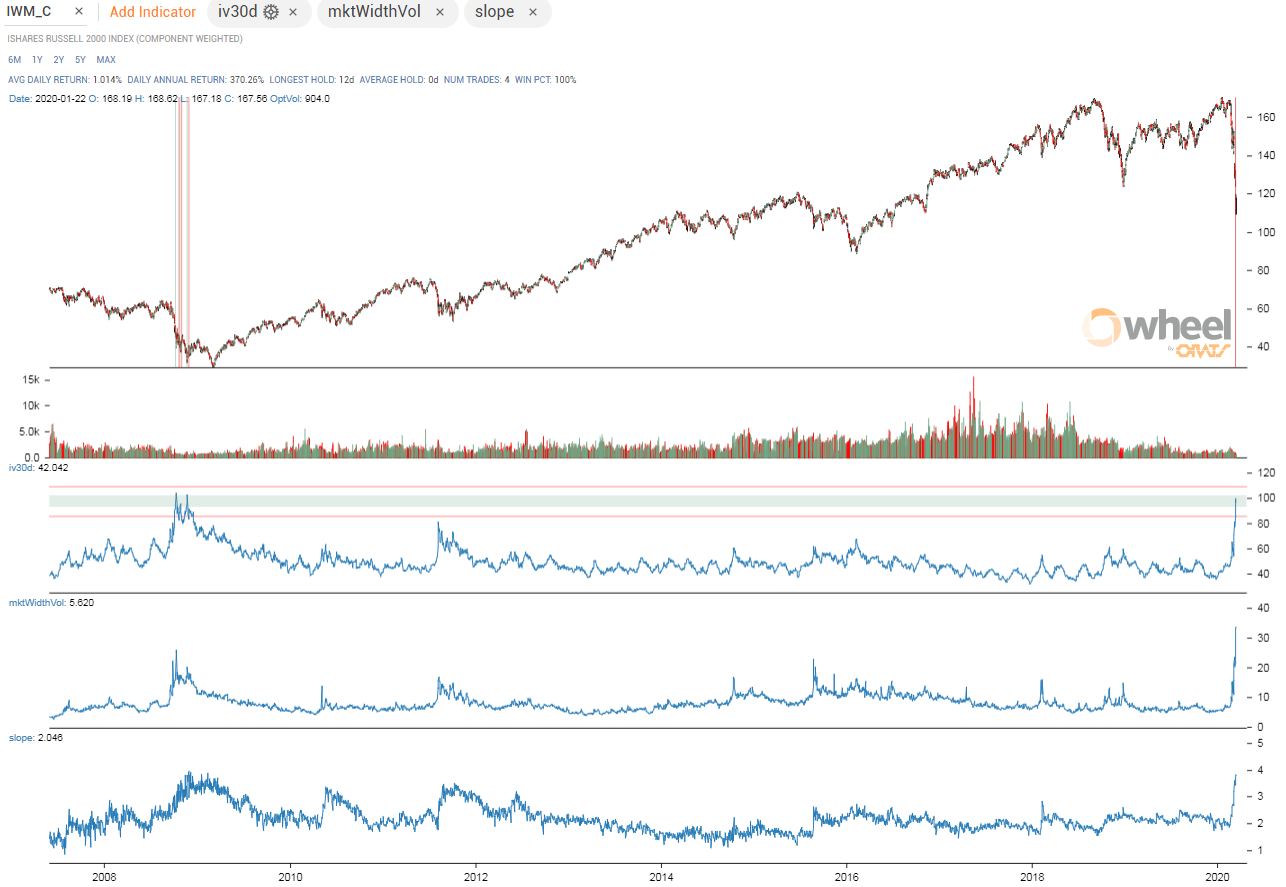
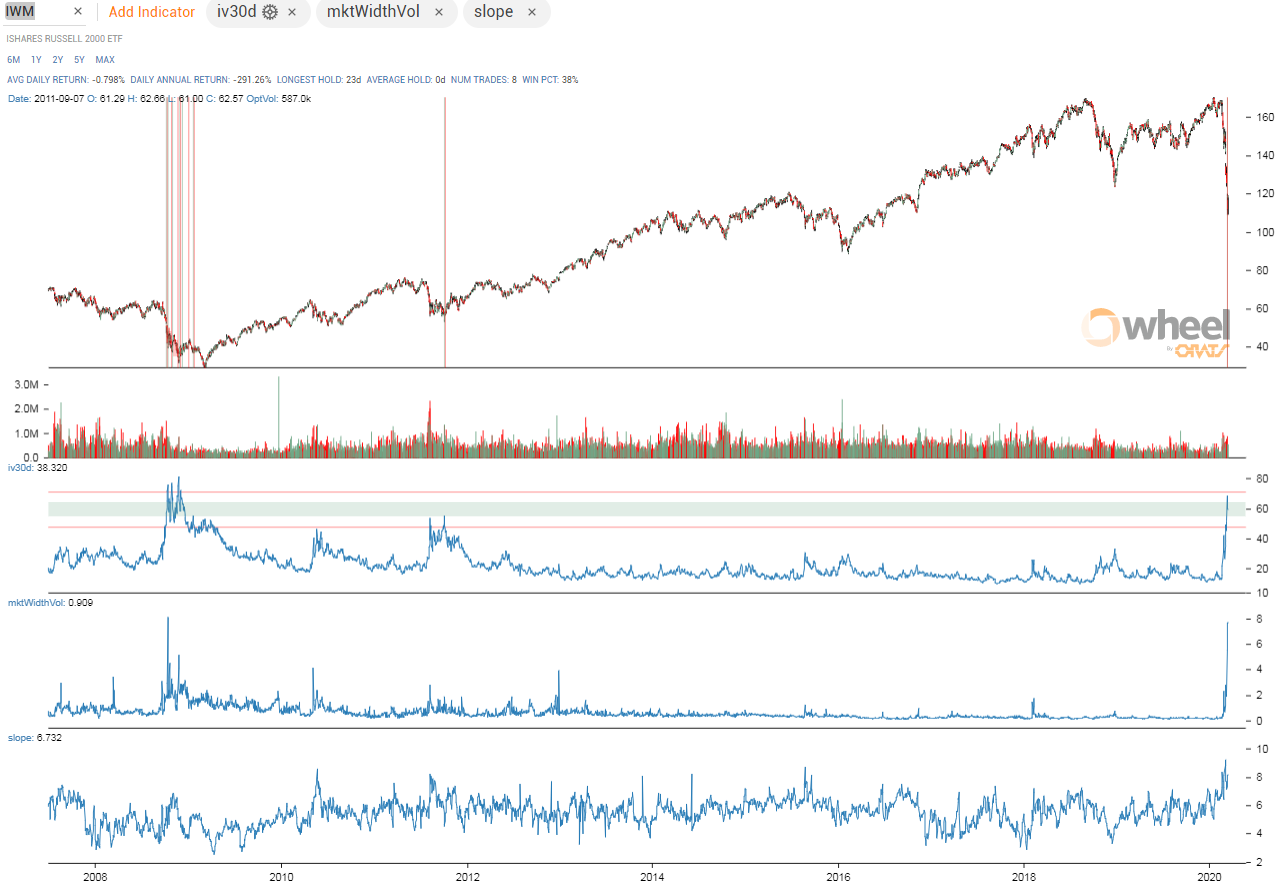
The components of IWM, the Russell 2000, had IV, market width, and slope above 2008 levels.
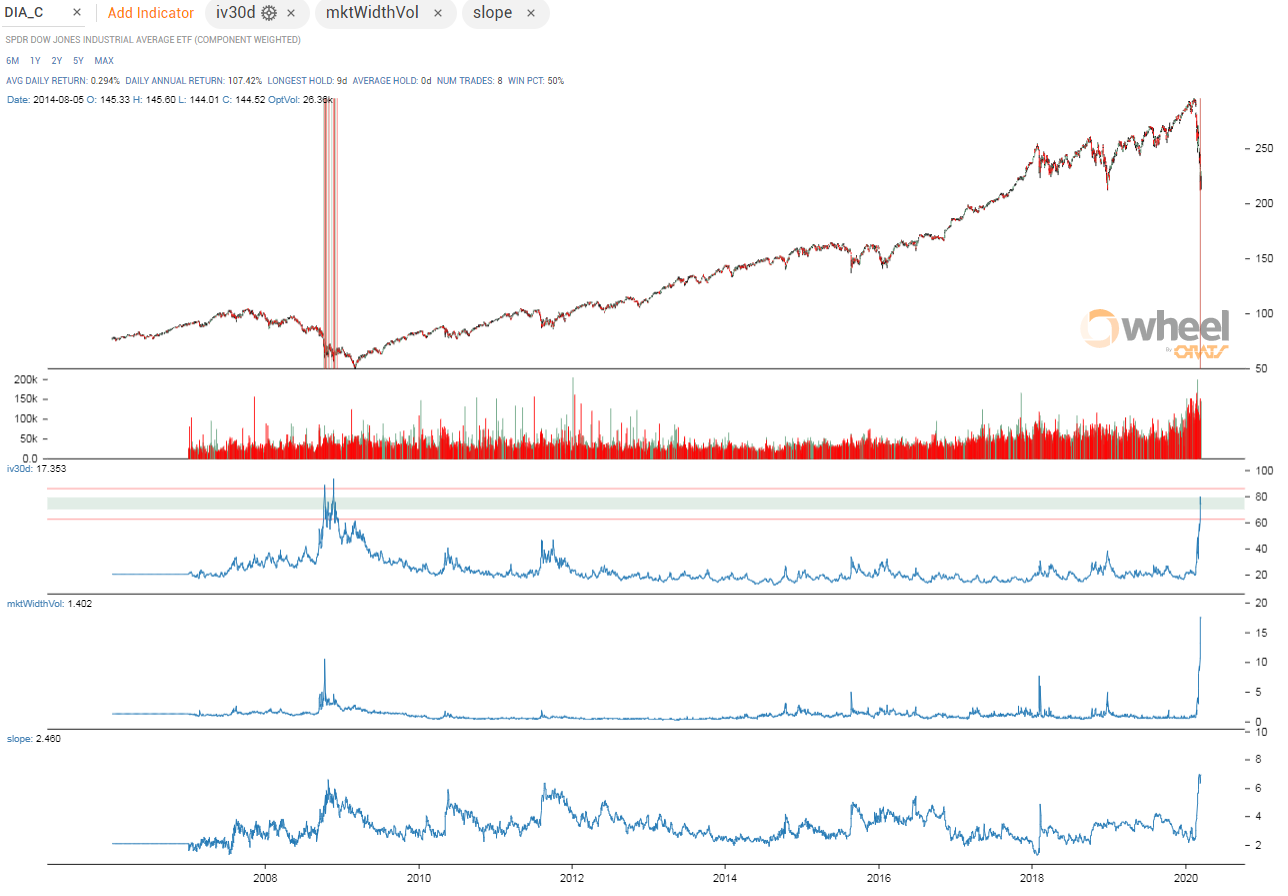
The components of DIA, the Dow 30, had IV close to 2008, but market width and slope were above 2008 levels.
The average of all symbols ALL_C had IV near 2008 levels, market width and slope were above.
The SPY, S&P 500 ETF, had IV near 2008. The market width of the bid-ask held up very well in this market and did not get close to 2008. The slope rose to 2008 levels.
IWM equaled the IV, market width was well below 2008, and slope surpassed 2008.
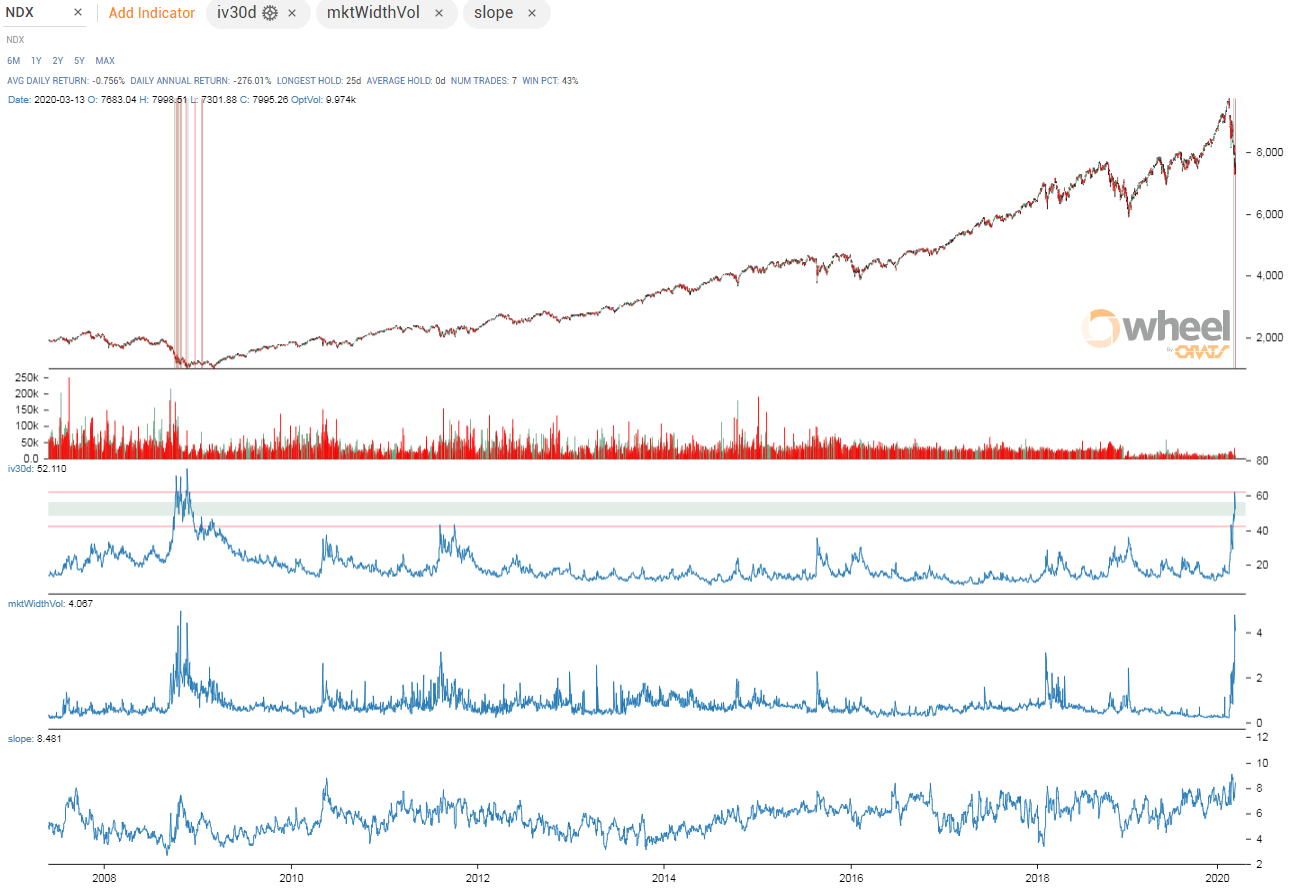
The NDX IV rose to nearly 2008 levels. The market width equaled 2008 and slope surpassed 2008.
The takeaways from the options volatility information is that market fear and capitulation are at levels not seen since the 2008 GFC. What isn't known is whether the virus is worse for the market than the financial woes were 12 years ago.
Disclaimer:
The opinions and ideas presented herein are for informational and educational purposes only and should not be construed to represent trading or investment advice tailored to your investment objectives. You should not rely solely on any content herein and we strongly encourage you to discuss any trades or investments with your broker or investment adviser, prior to execution. None of the information contained herein constitutes a recommendation that any particular security, portfolio, transaction, or investment strategy is suitable for any specific person. Option trading and investing involves risk and is not suitable for all investors.
All opinions are based upon information and systems considered reliable, but we do not warrant the completeness or accuracy, and such information should not be relied upon as such. We are under no obligation to update or correct any information herein. All statements and opinions are subject to change without notice.
Past performance is not indicative of future results. We do not, will not and cannot guarantee any specific outcome or profit. All traders and investors must be aware of the real risk of loss in following any strategy or investment discussed herein.
Owners, employees, directors, shareholders, officers, agents or representatives of ORATS may have interests or positions in securities of any company profiled herein. Specifically, such individuals or entities may buy or sell positions, and may or may not follow the information provided herein. Some or all of the positions may have been acquired prior to the publication of such information, and such positions may increase or decrease at any time. Any opinions expressed and/or information are statements of judgment as of the date of publication only.
Day trading, short term trading, options trading, and futures trading are extremely risky undertakings. They generally are not appropriate for someone with limited capital, little or no trading experience, and/ or a low tolerance for risk. Never execute a trade unless you can afford to and are prepared to lose your entire investment. In addition, certain trades may result in a loss greater than your entire investment. Always perform your own due diligence and, as appropriate, make informed decisions with the help of a licensed financial professional.
Commissions, fees and other costs associated with investing or trading may vary from broker to broker. All investors and traders are advised to speak with their stock broker or investment adviser about these costs. Be aware that certain trades that may be profitable for some may not be profitable for others, after taking into account these costs. In certain markets, investors and traders may not always be able to buy or sell a position at the price discussed, and consequently not be able to take advantage of certain trades discussed herein.
Be sure to read the OCCs Characteristics and Risks of Standardized Options to learn more about options trading.
Related Posts