Data API
Thursday, November 19th 2026
S&P 500 Options: Fed, CPI and Jobs Days Moved About as Much as Priced
We compared the move S&P 500 options priced for each day with the move that followed, over 1,109 trading days.
Summary
We compared the move S&P 500 options priced for each day, read from ORATS WHAM history, with the move that followed over 1,109 trading days. Fed, CPI and jobs-report days were priced at 1.31 times an ordinary day and moved 1.30 times as far, and WHAM had listed most of them five trading days ahead.
Option prices imply how far the S&P 500 is expected to move on each coming day, and WHAM, an ORATS dataset, separates that expected move into one value per day. From May 2022 to November 2026, the options priced the 136 Fed, CPI and jobs-report days to move 1.31 times as far as an ordinary day, and those days moved 1.30 times as far. WHAM had listed most of them five trading days ahead.
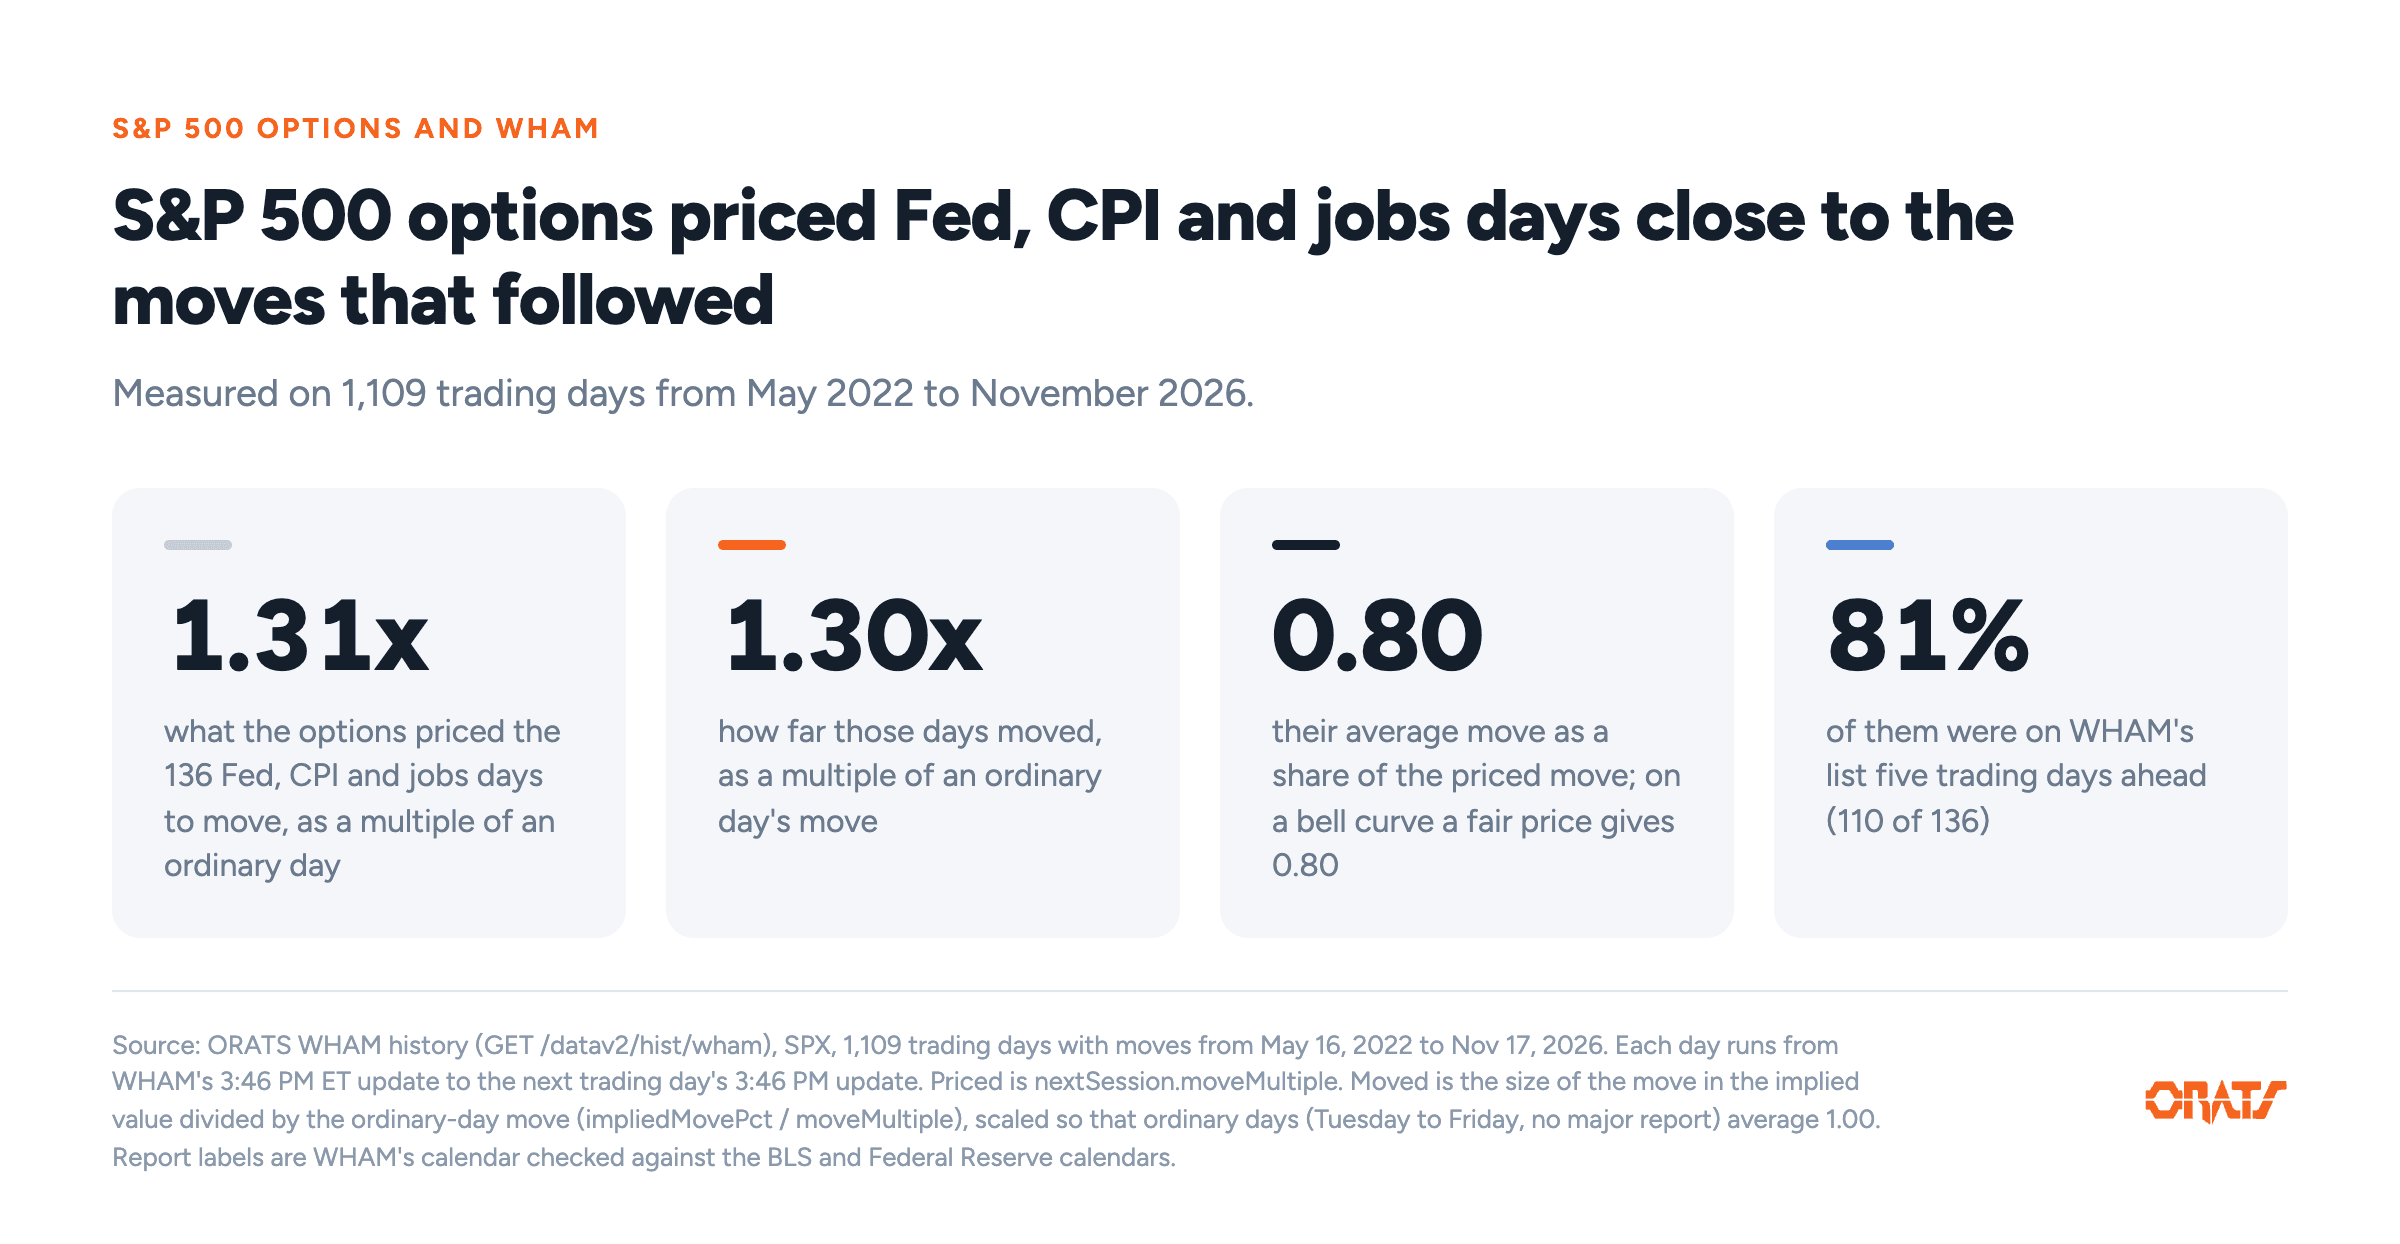
Headline numbers for the 136 S&P 500 report days. Source: ORATS WHAM history, SPX, May 16, 2022 to November 17, 2026.
A holiday and three major reports fall in the next four weeks
The market is closed on November 26 for Thanksgiving. The jobs report comes out on December 4, the Federal Reserve decides on rates on December 9, and the consumer price index (CPI) follows on December 10. On November 10 a Fed governor raised the possibility of a half-point increase in December, and October's CPI came in above forecasts that morning (IBKR Traders' Insight).
An option expiring after December 10 covers all of those days in one price, and a trader holding it would want to know how much of the price belongs to each day. One day says little about whether such prices are right. On November 5 WHAM's implied value of the S&P 500 fell 4.2% on a day priced like an ordinary day, and the next day's jobs report was priced for 1.8% and moved 0.3%.
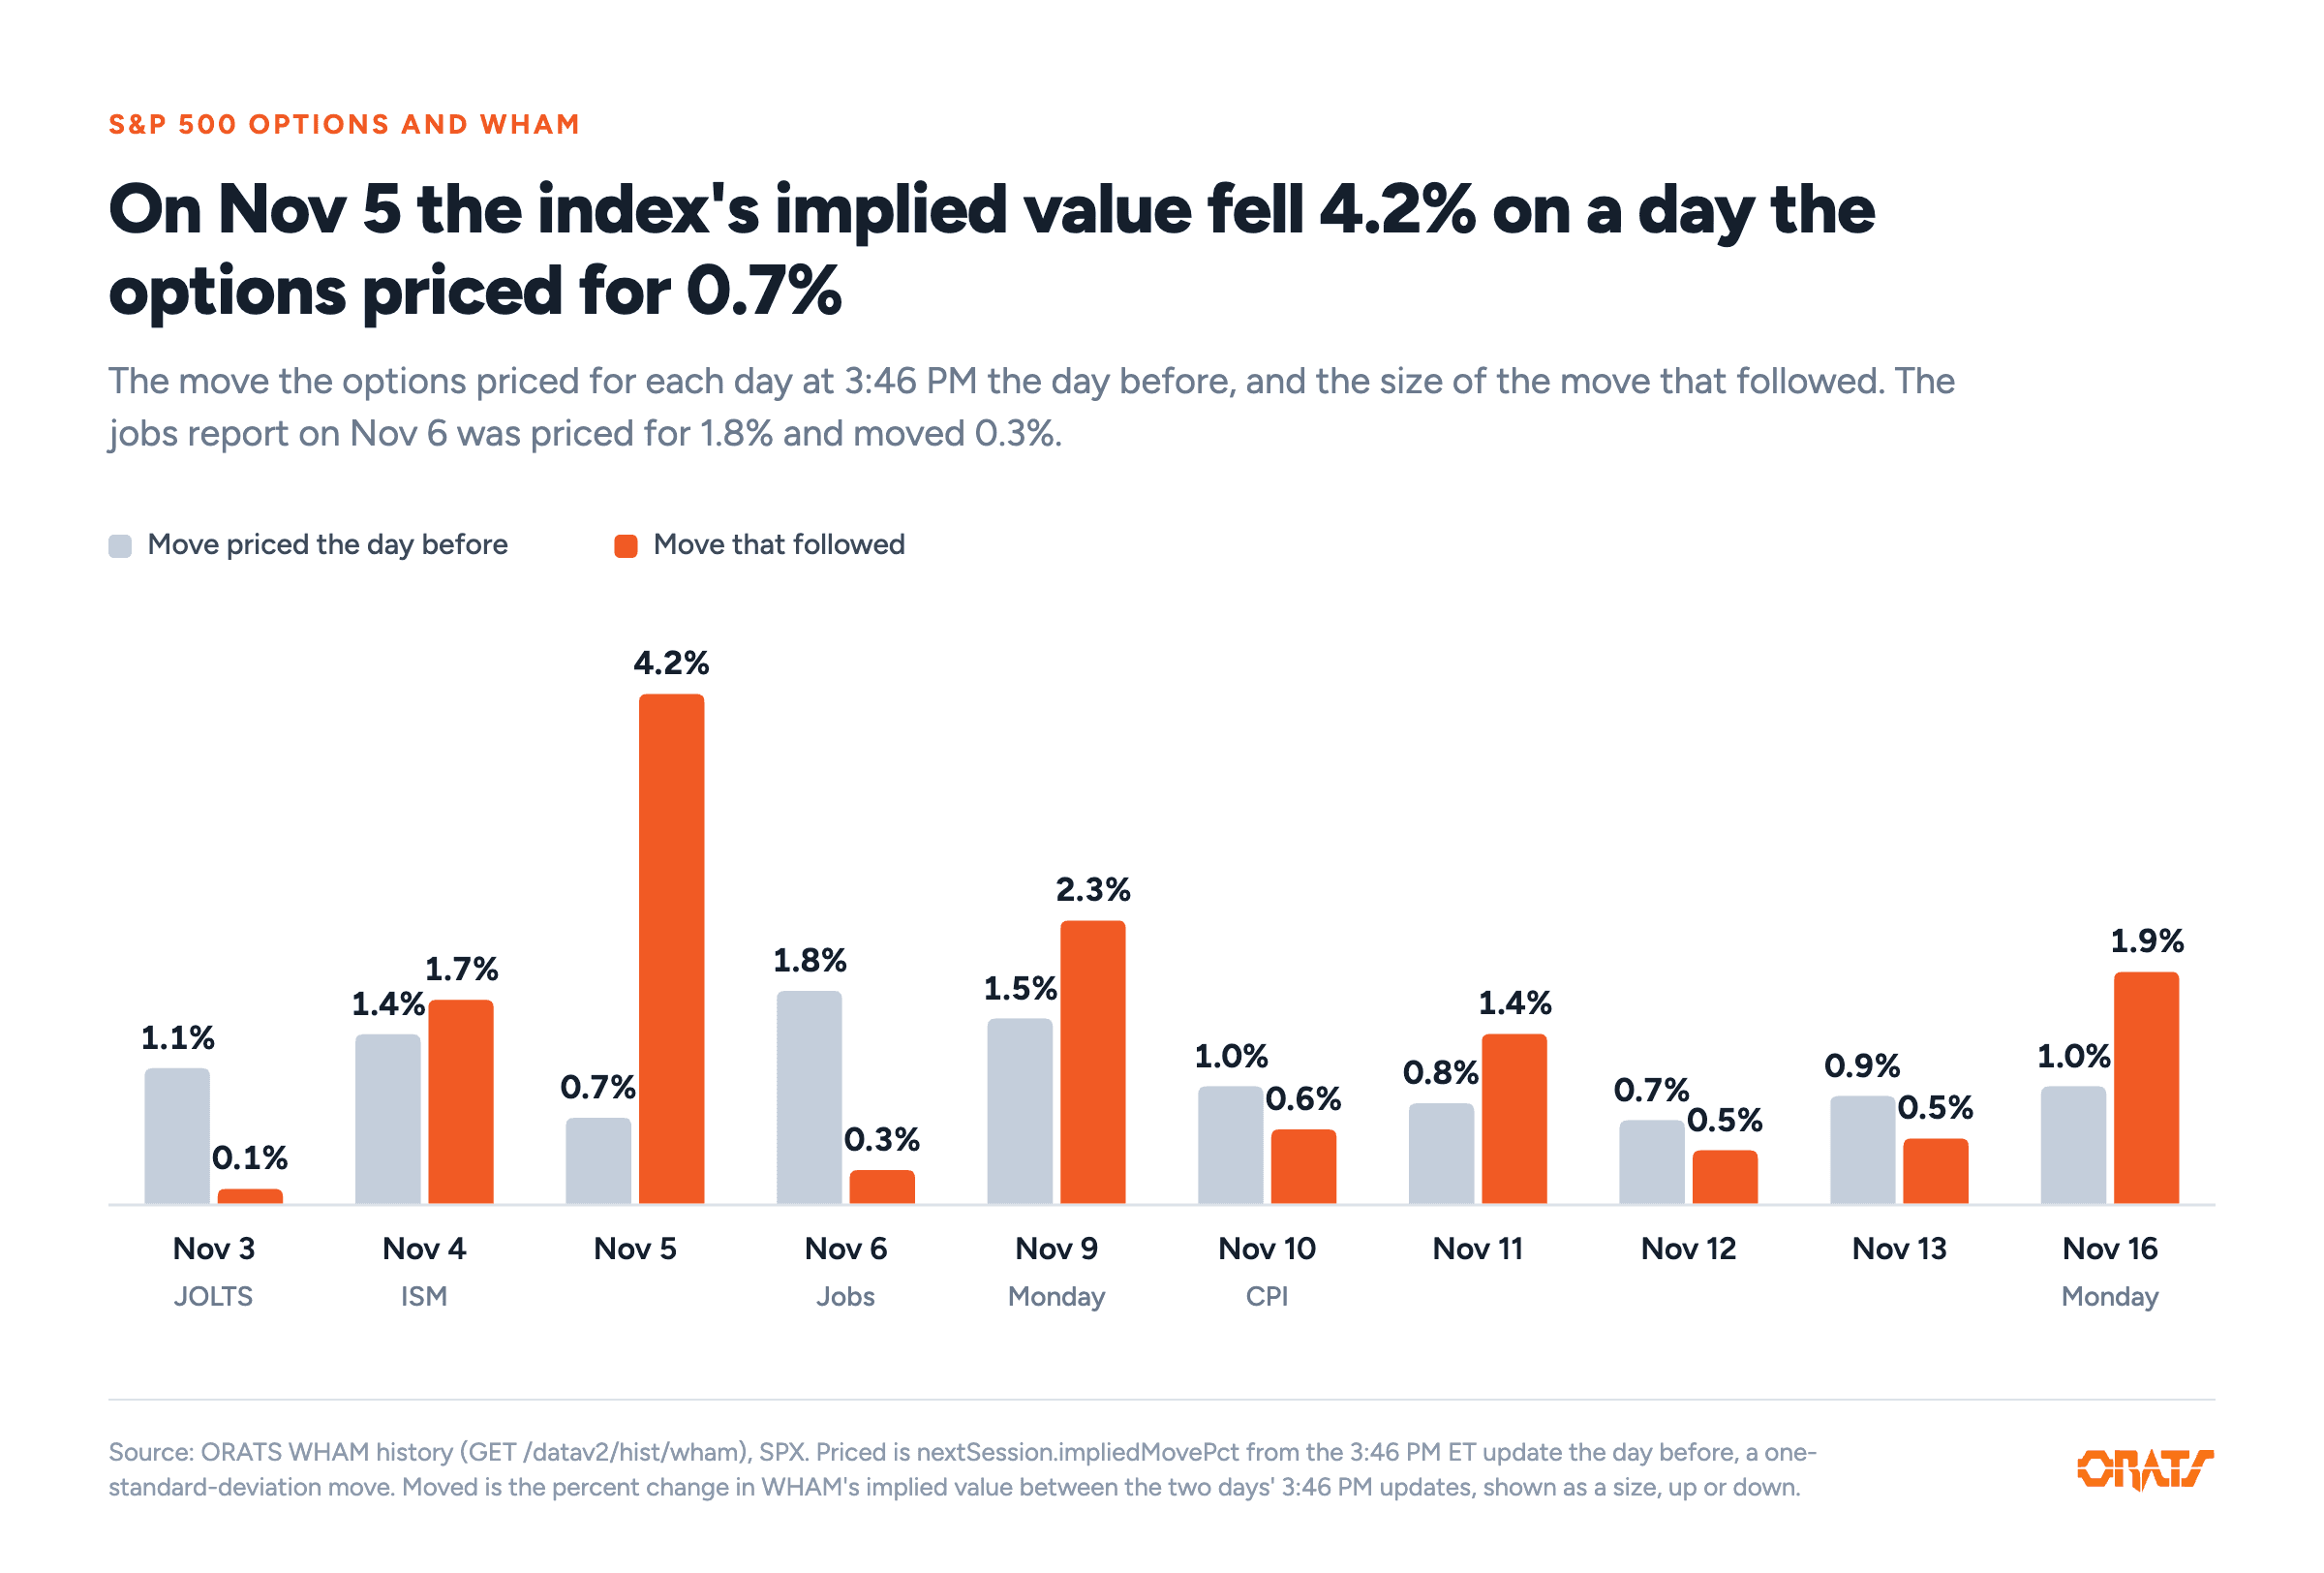
The move priced the day before and the move that followed, November 3 to 16, 2026. Source: ORATS WHAM history, SPX.
How WHAM measures the move priced for one day
The move an option price implies is one standard deviation, a size the day's move stays under about two days in three. S&P 500 options expire every trading day, so the extra movement priced into a Thursday option over a Wednesday option is the price of Thursday alone. WHAM (Weekend and Holiday Adjustments and Macro-Moves) does this across about three weeks of expirations, counting weekends and holidays as a small part of a day. It states each day's price in the field moveMultiple as a multiple of an ordinary day, a day with no scheduled report. A day priced at 1.31 is priced to move 31% more than an ordinary day.
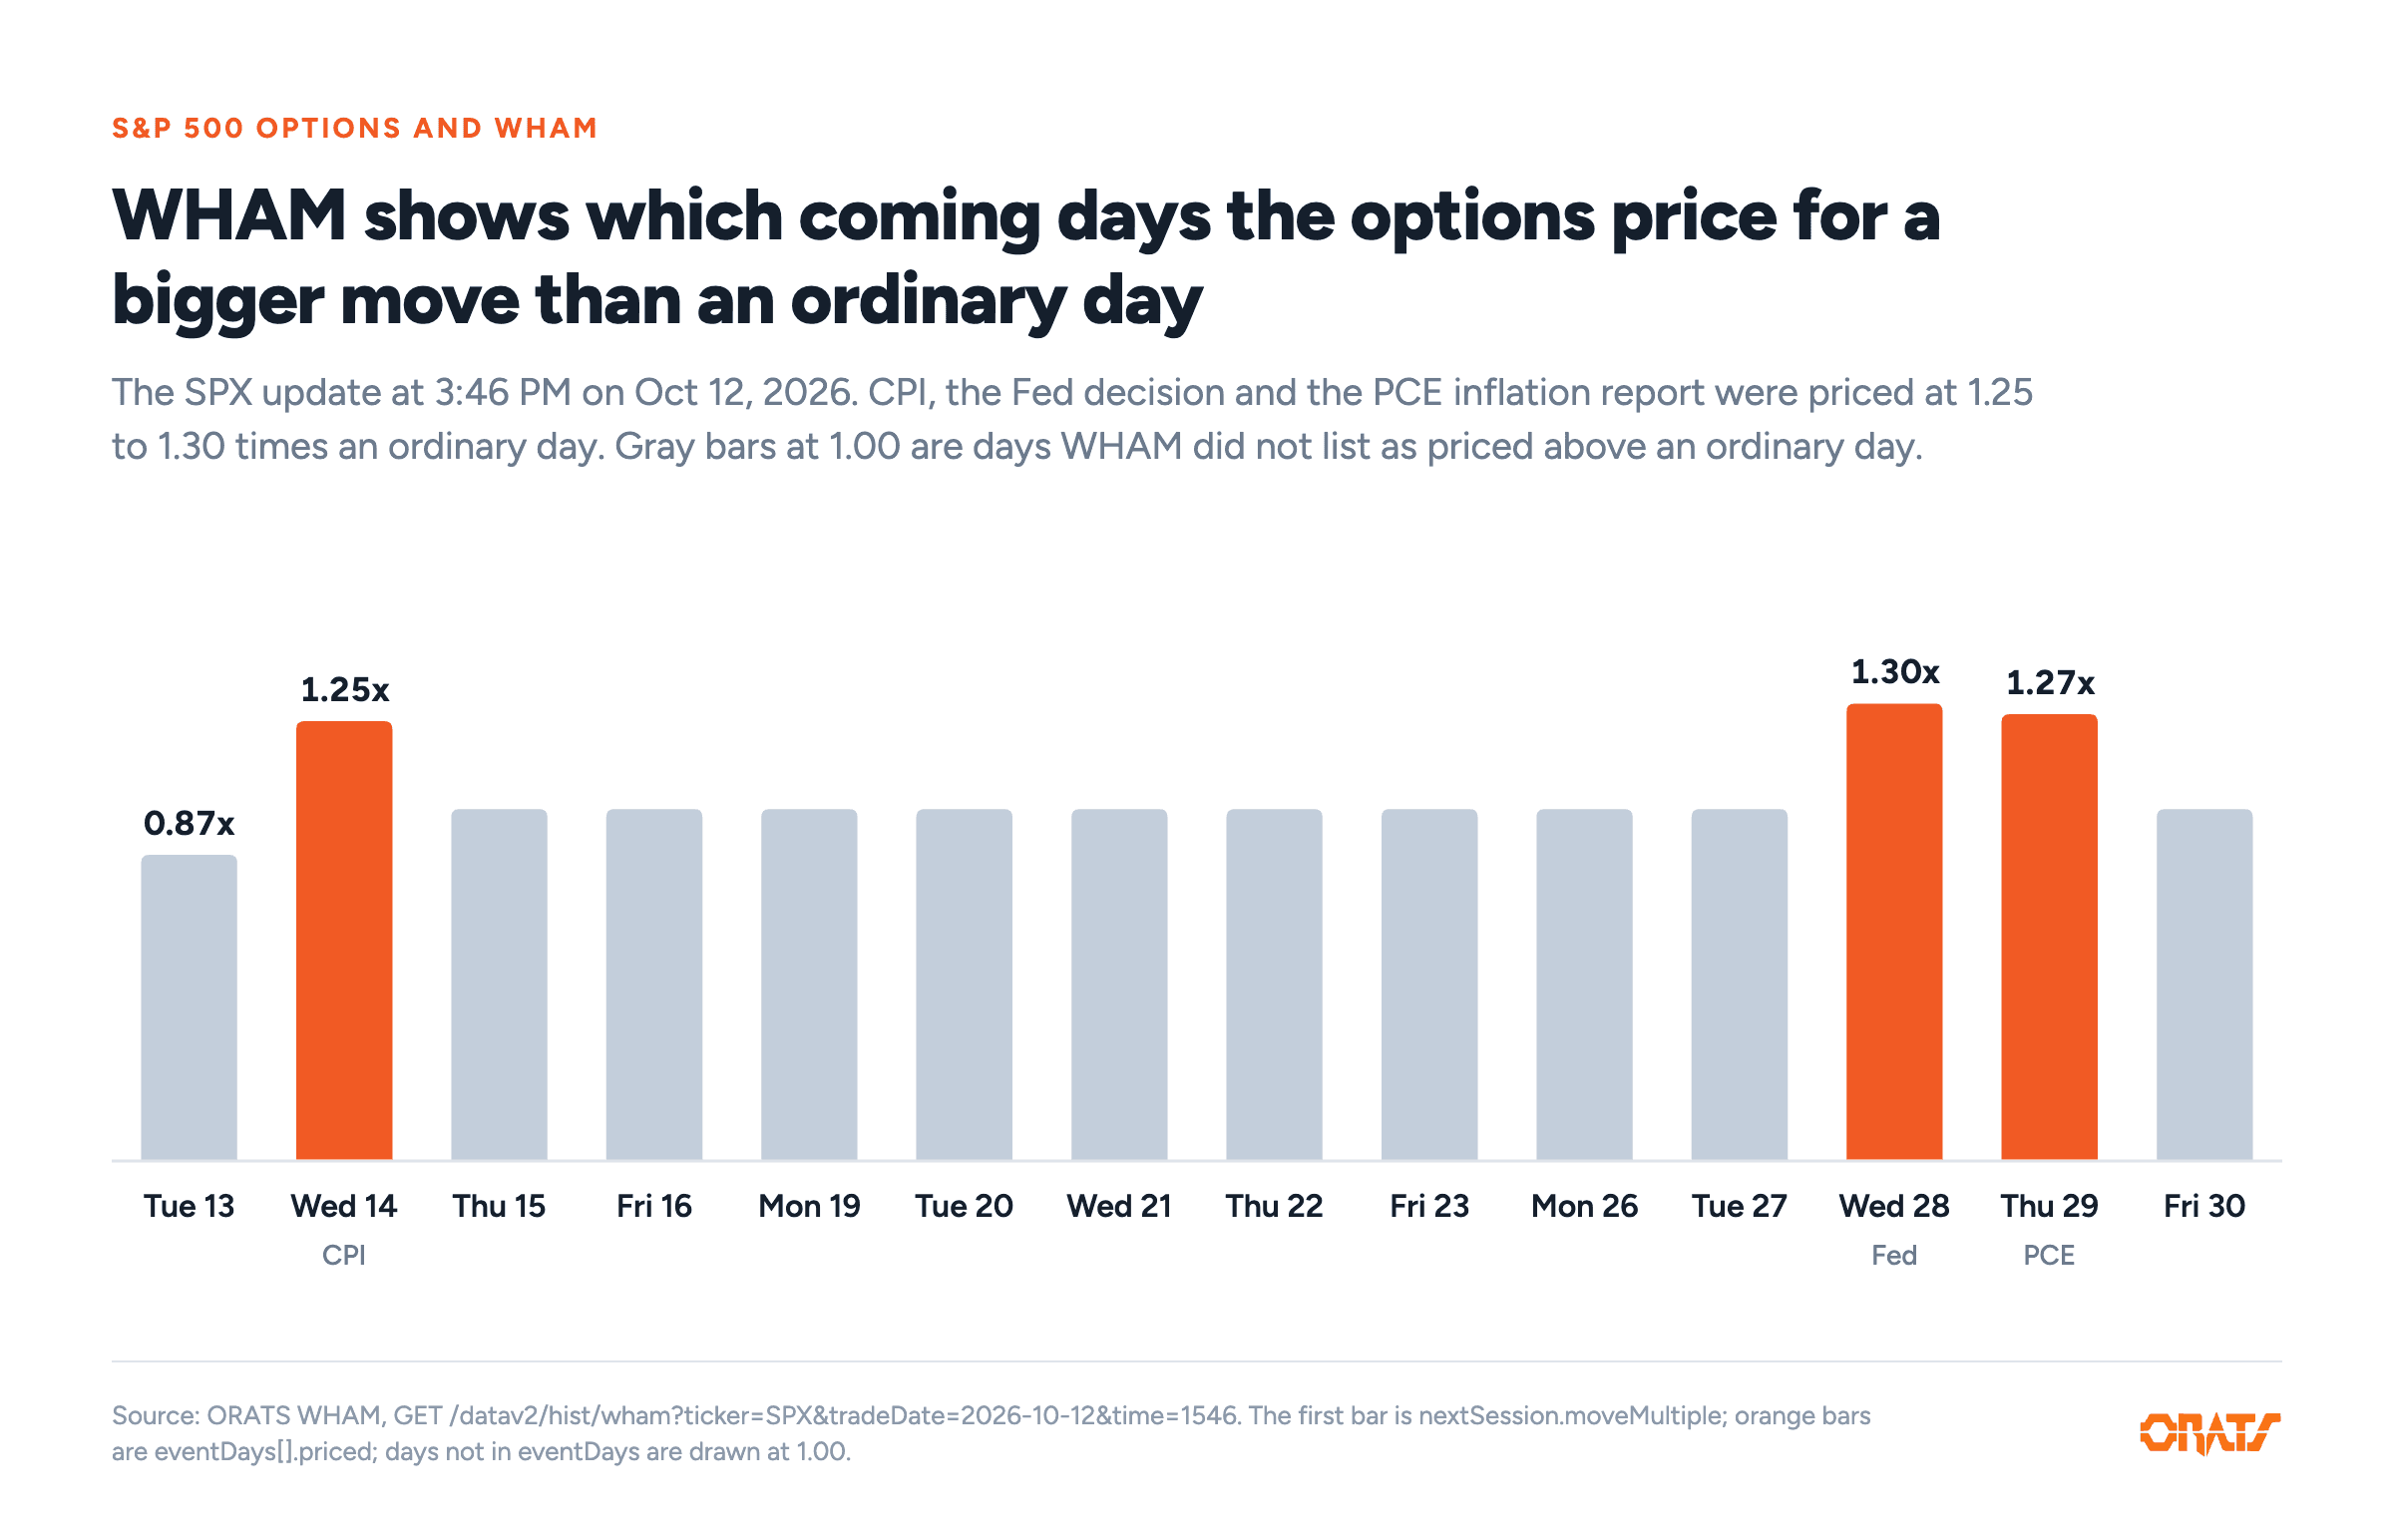
The priced multiple for each coming day in the update of October 12, 2026. Source: ORATS WHAM, SPX, 3:46 PM ET update.
The test put the price and the move on the same scale
For each trading day we read the multiple priced for the next day in WHAM's last update, at 3:46 PM ET. We then measured how far the index moved by the same time the next day and divided that by the move WHAM priced for an ordinary day. Because a priced move is one standard deviation, the average day moves less than its price, about 0.80 of it on a bell curve. So we compared each group's average with the average for ordinary days (Tuesday to Friday with no major report). A group priced at 1.31 that "moved 1.30" moved as much more than ordinary days as the options expected.
That gave 1,109 days, after leaving out 25 with an early close, a missing price, a skipped date or an implausible update. We checked report days against the Bureau of Labor Statistics and Federal Reserve calendars and corrected 8 labels, most of them reports the 2025 government shutdown cancelled.
Report days moved more than ordinary days by about the amount priced
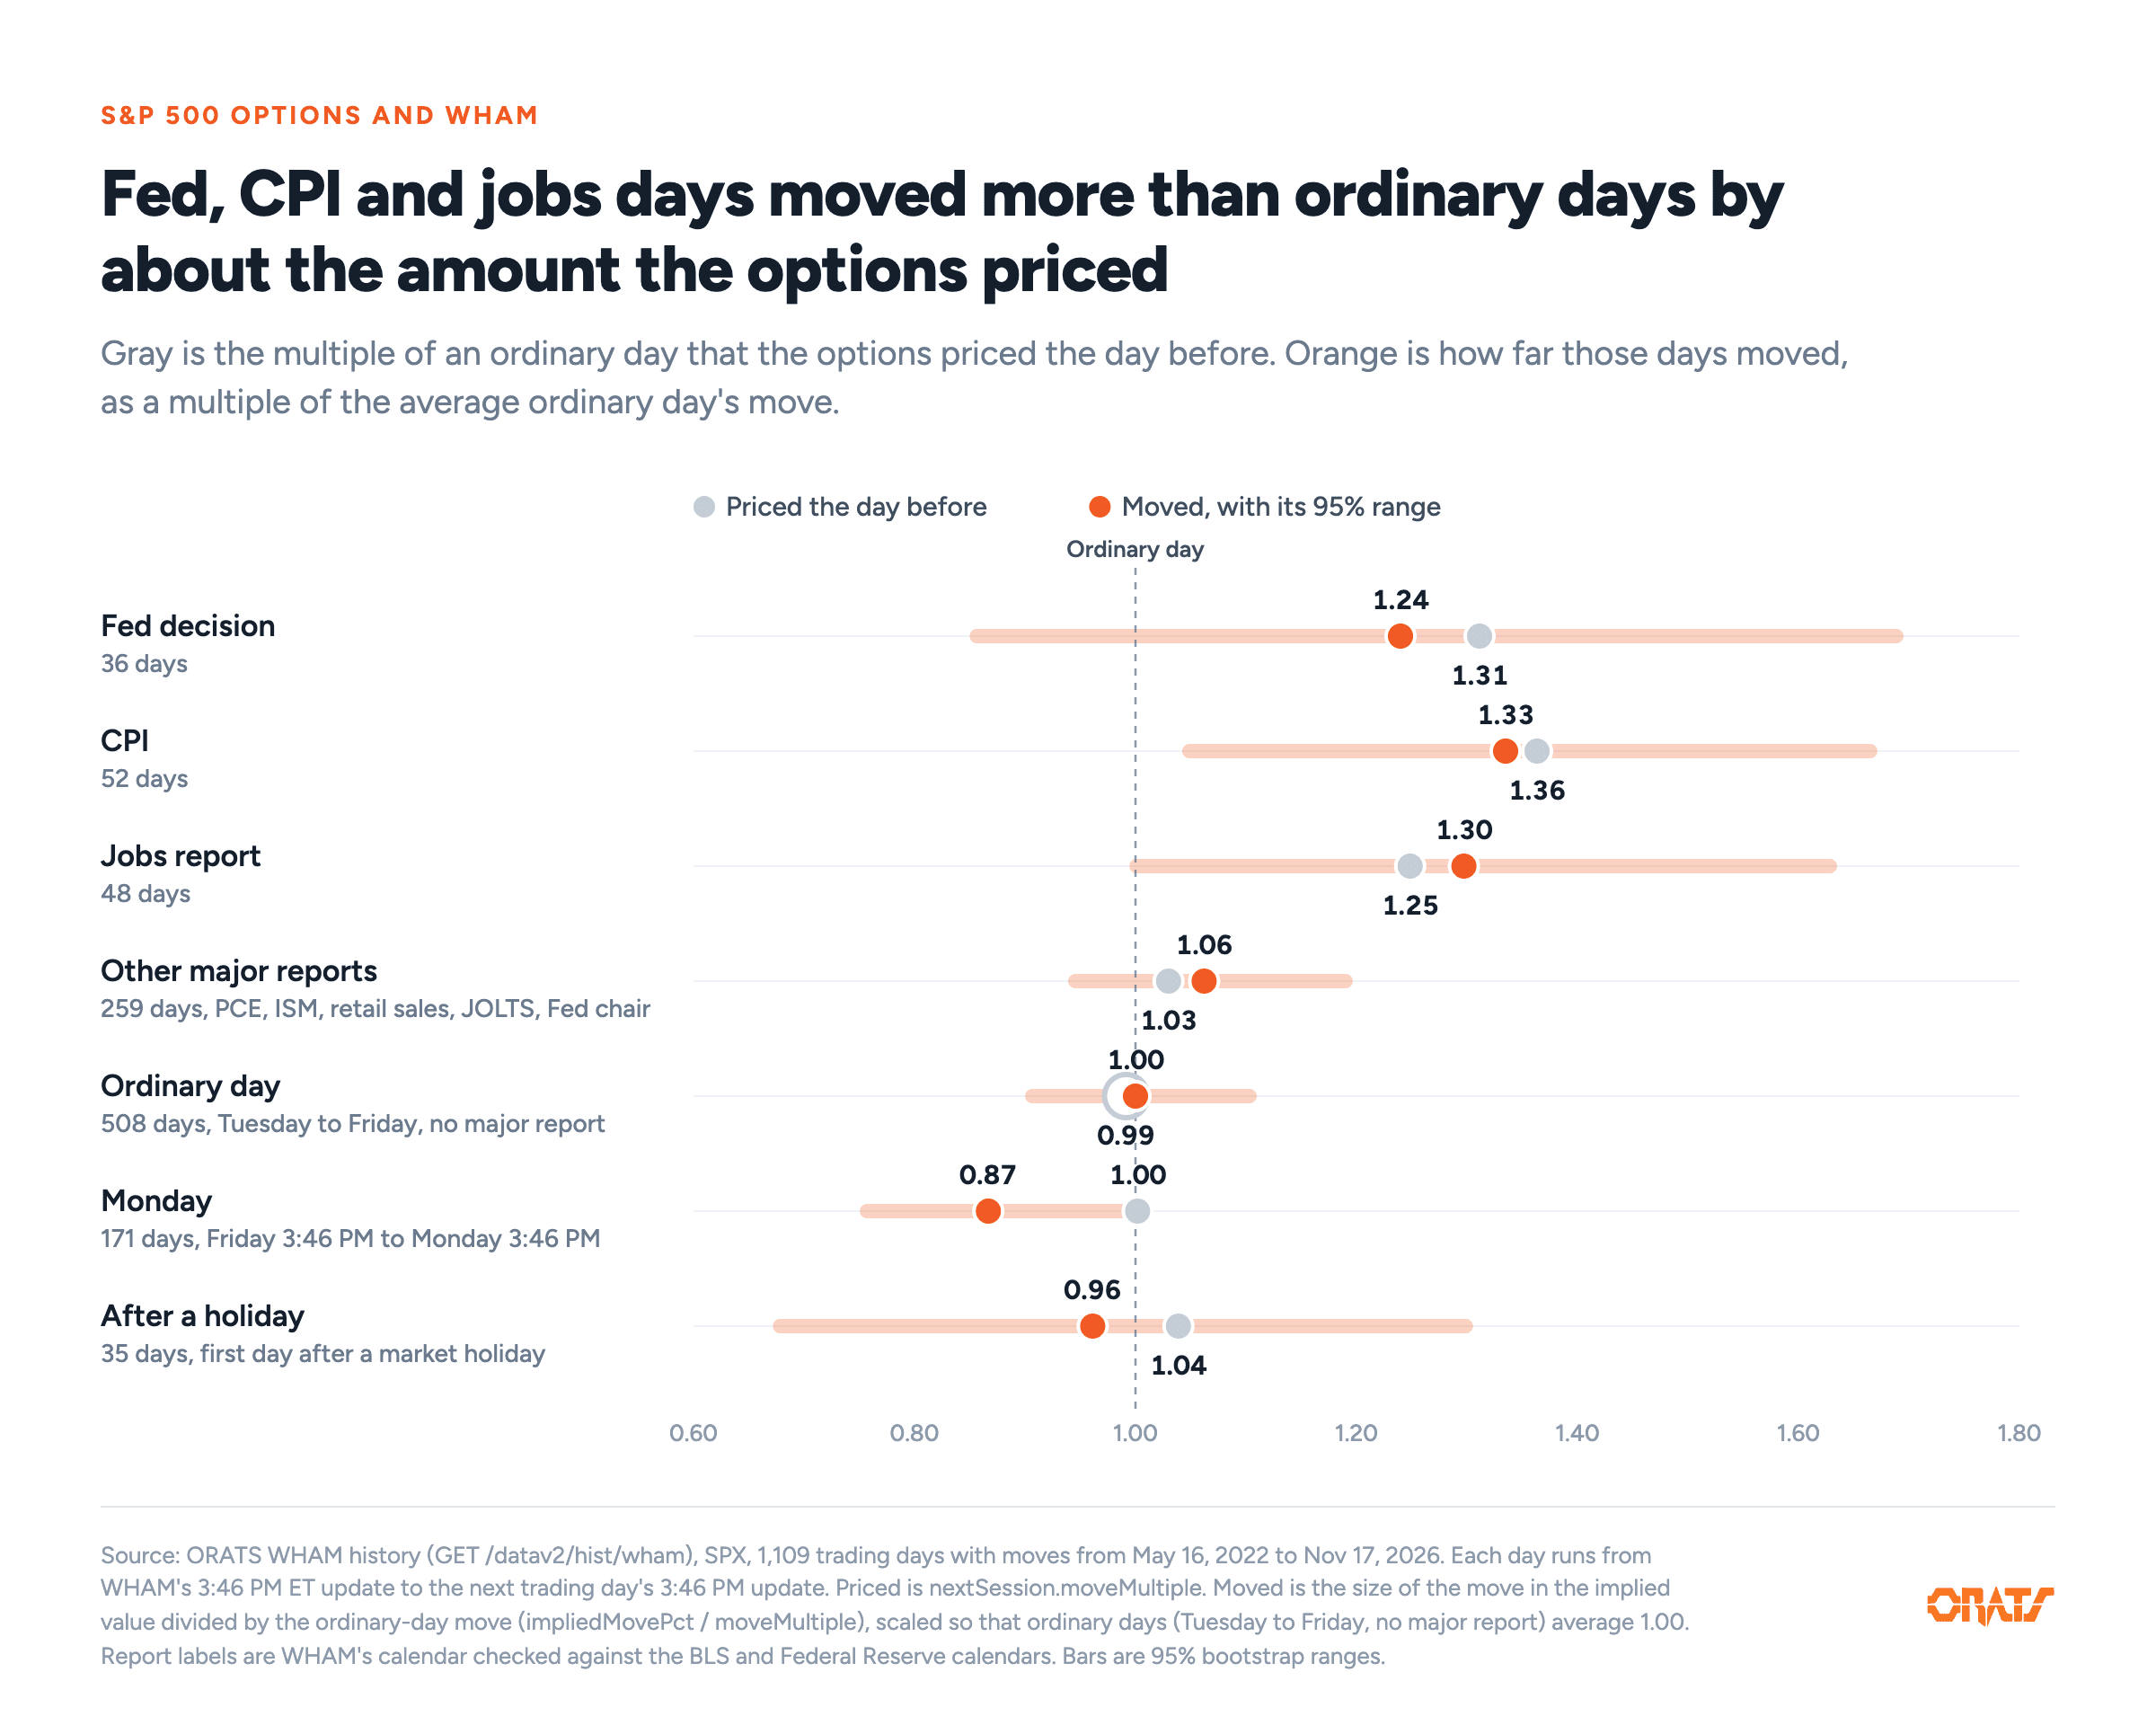
Priced and moved multiples for seven kinds of day. Source: ORATS WHAM history, SPX, 1,109 days.
The 136 report days were priced at 1.31 and moved 1.30. If the same number of days were drawn again at random, their average would fall between 1.10 and 1.52 in 95% of draws.
For their price, report days moved 0.99 times as much as ordinary days. Reshuffling the report and ordinary labels 20,000 times gave a gap at least that large 88% of the time (p = 0.88), and the range of 0.83 to 1.16 makes a mispricing above about 17% either way unlikely. Report days also moved 0.80 of their priced move on average, the share a bell curve gives.
Grouped by price alone, days priced above 1.15 moved more, by about the amount priced, and below 1.15 the price did not separate the days.
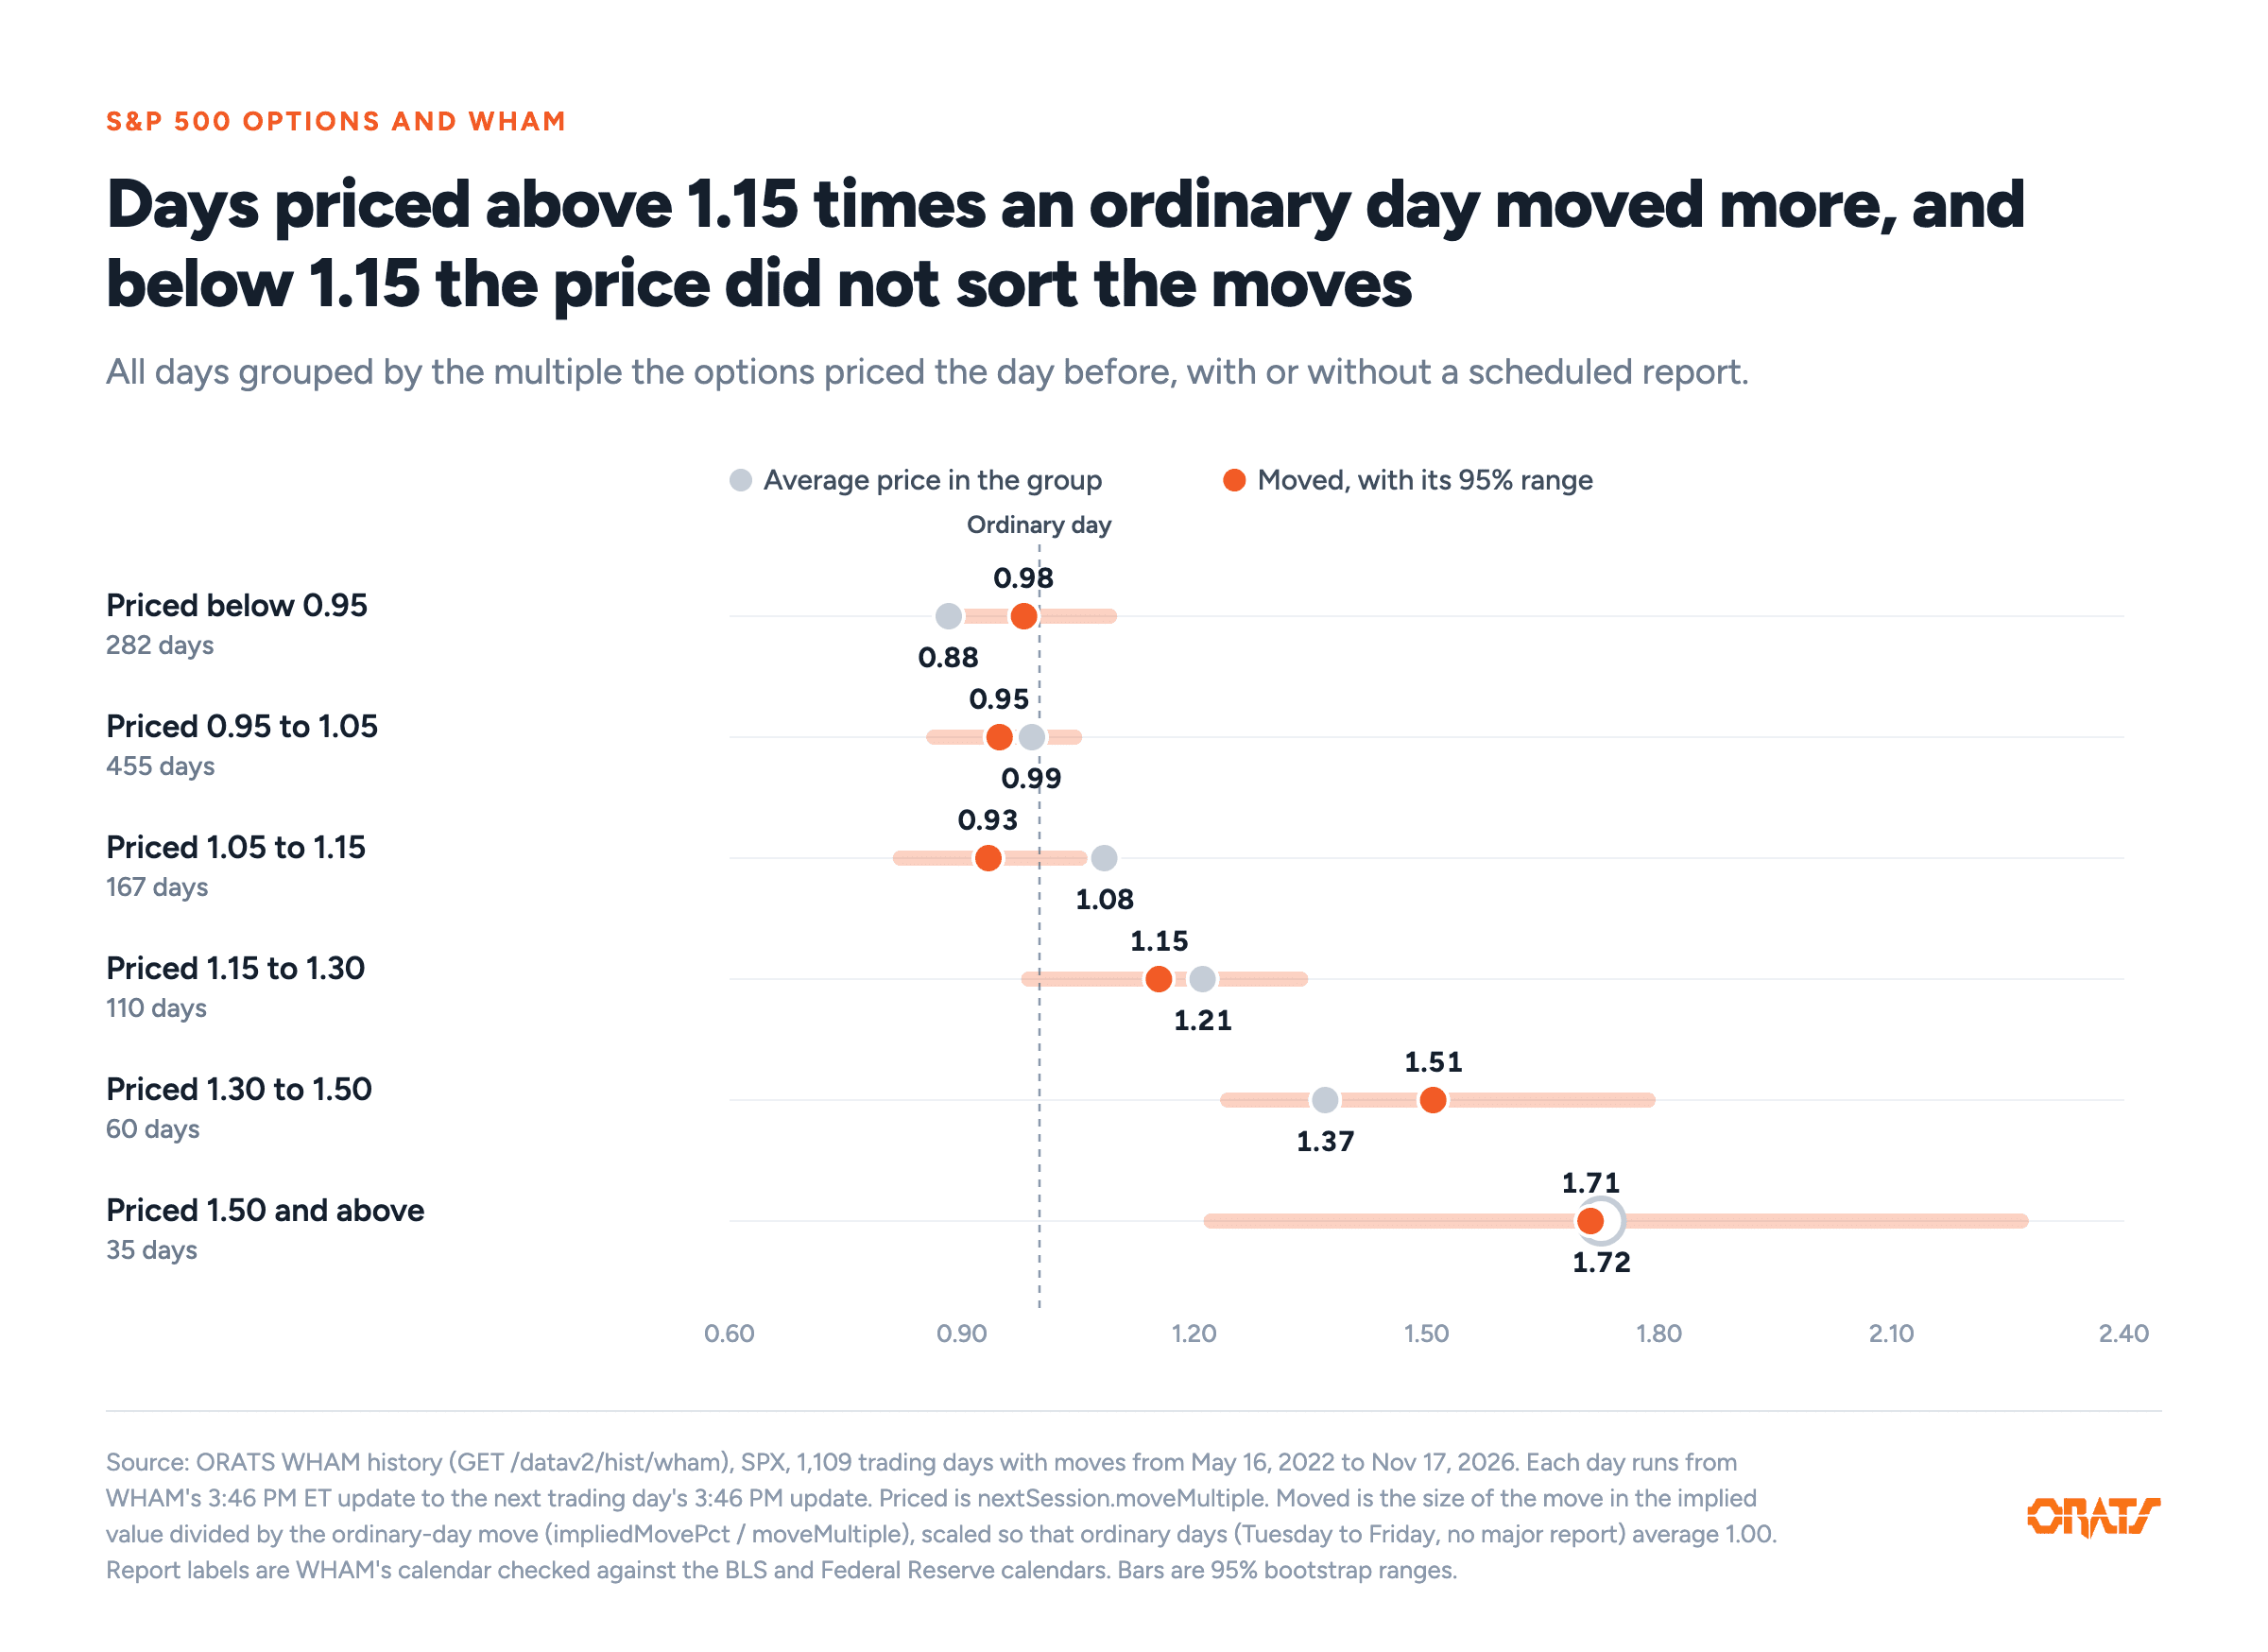
All days grouped by the multiple priced the day before. Source: ORATS WHAM history, SPX, 1,109 days.
The result held across years and on the Nasdaq-100
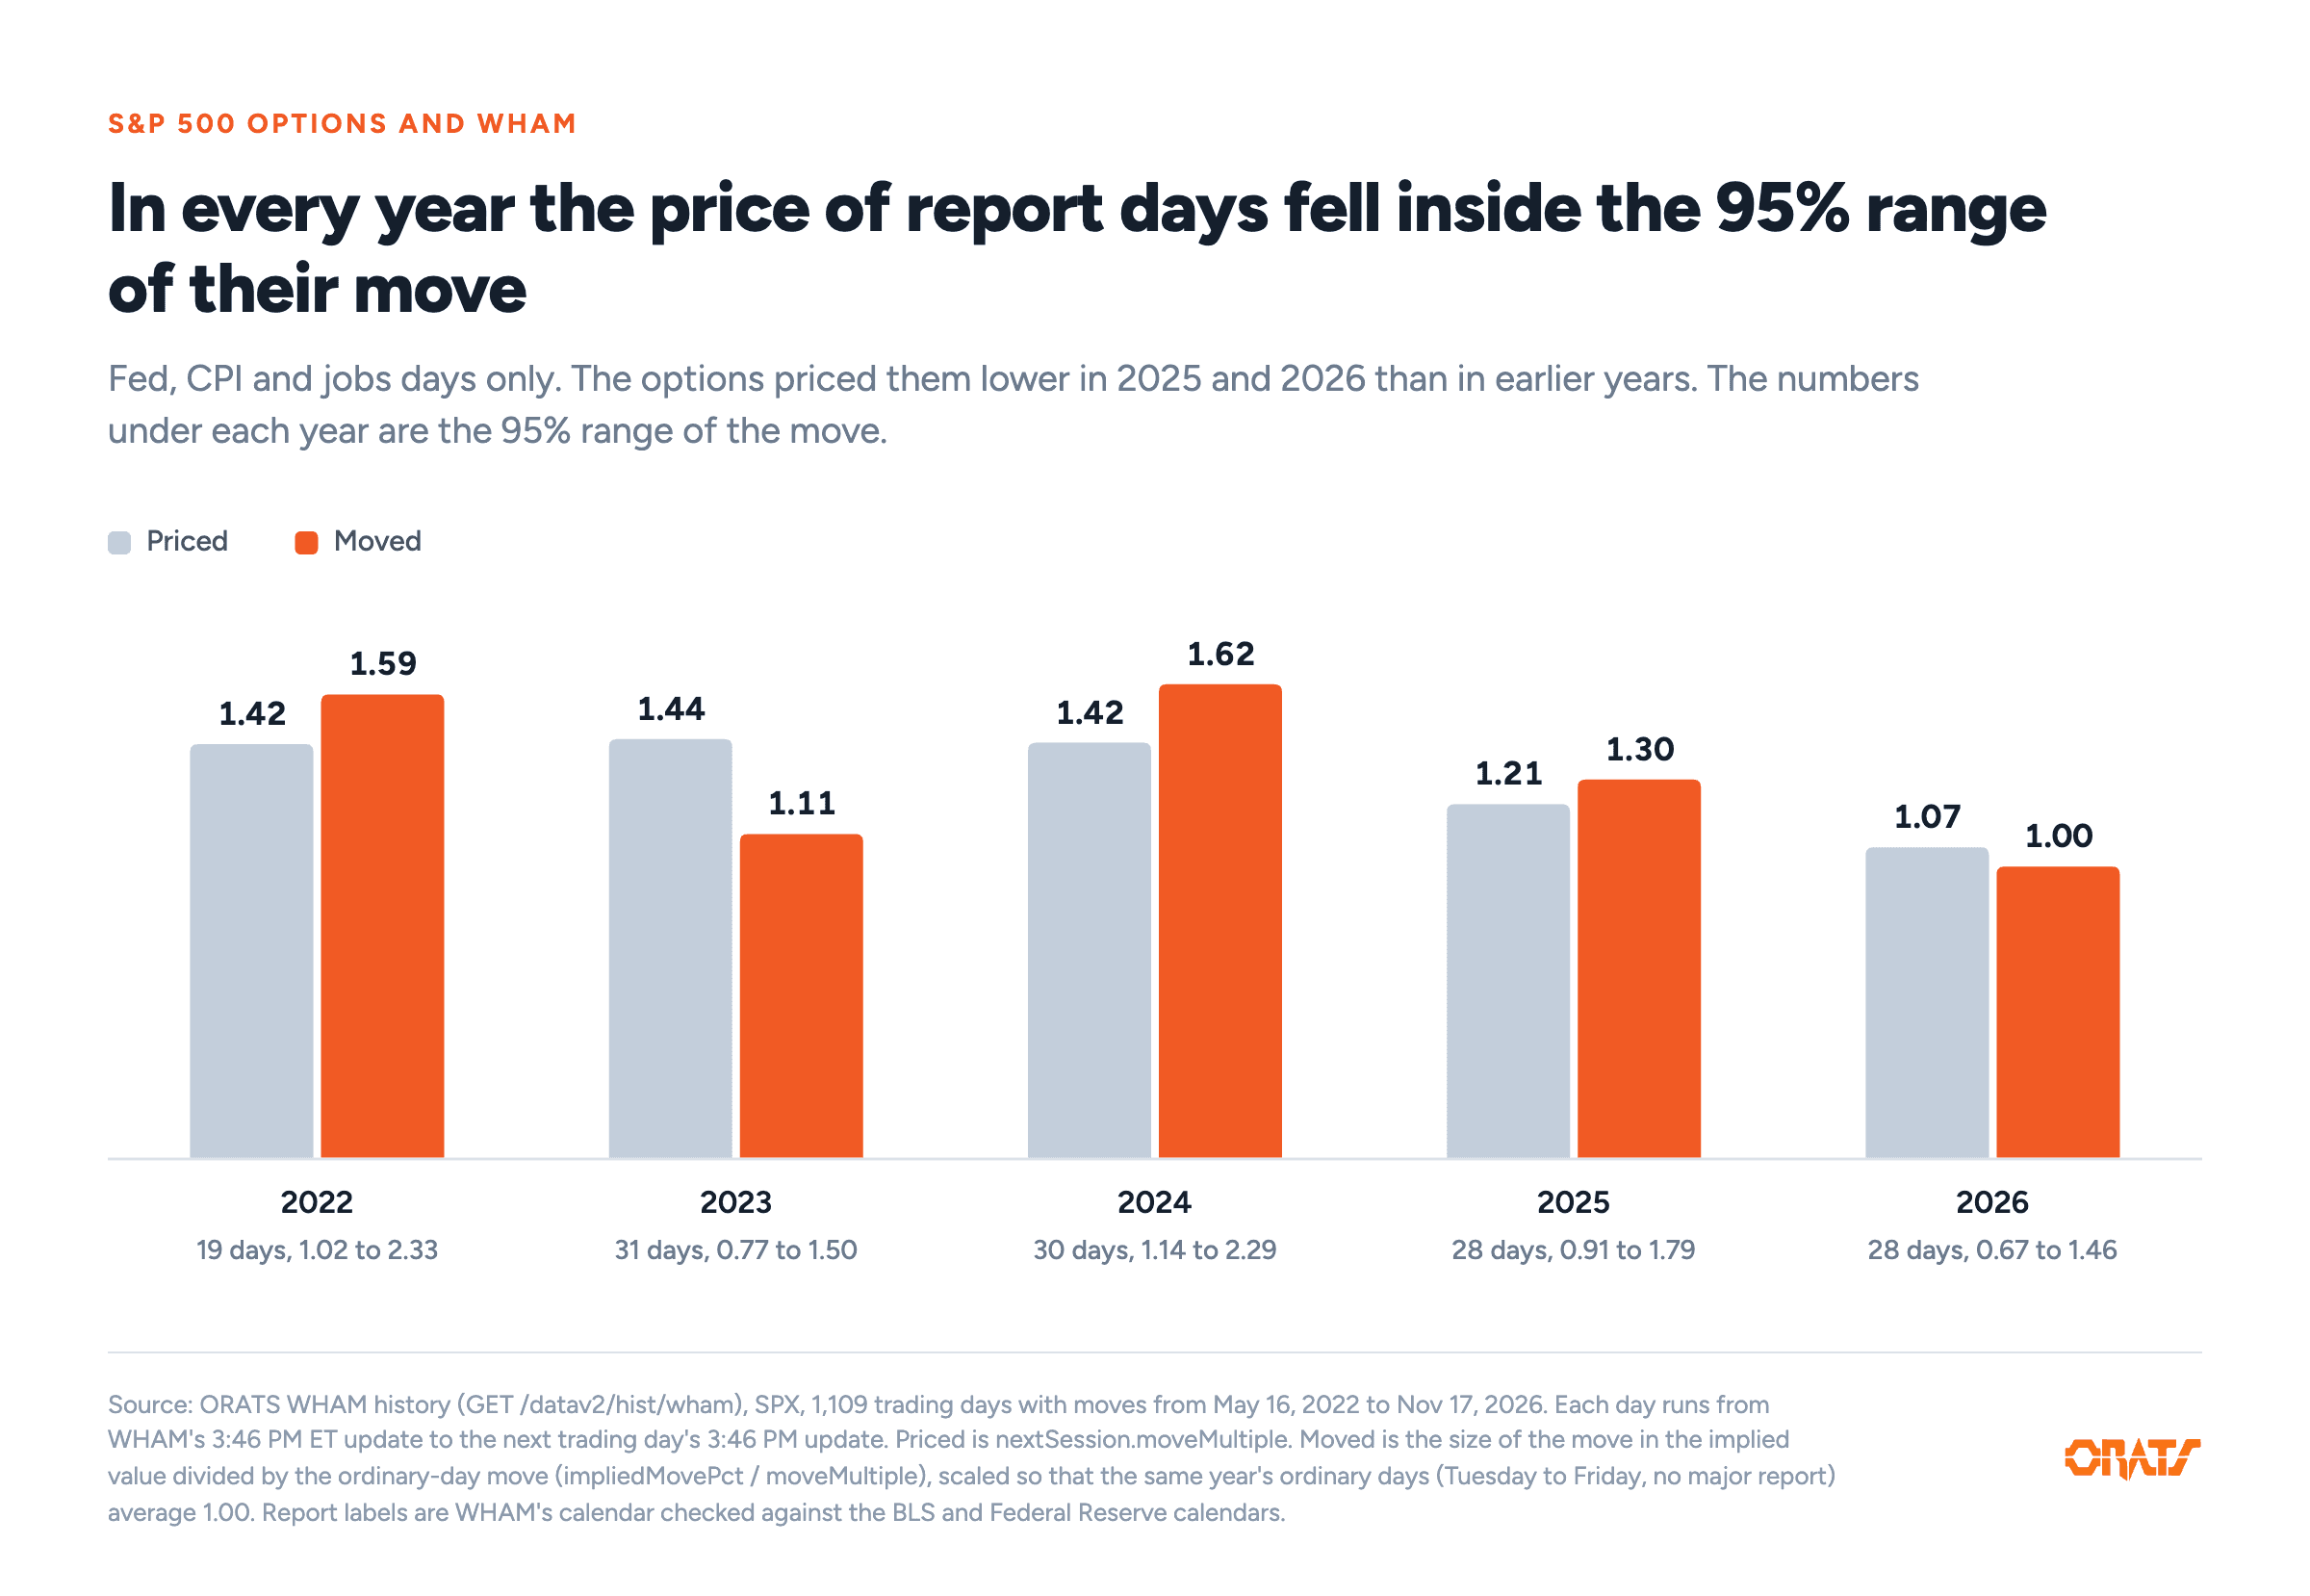
Report days by year, each against that year's ordinary days. Source: ORATS WHAM history, SPX.
With 19 to 31 report days a year, the yearly gaps are within what chance produces, and report days moved about as priced in both calm and volatile halves of the sample. Nasdaq-100 report days moved 1.01 times as much as ordinary days for their price. Russell 2000 report days, with history from 2024, moved about 16% less than priced (p = 0.10).
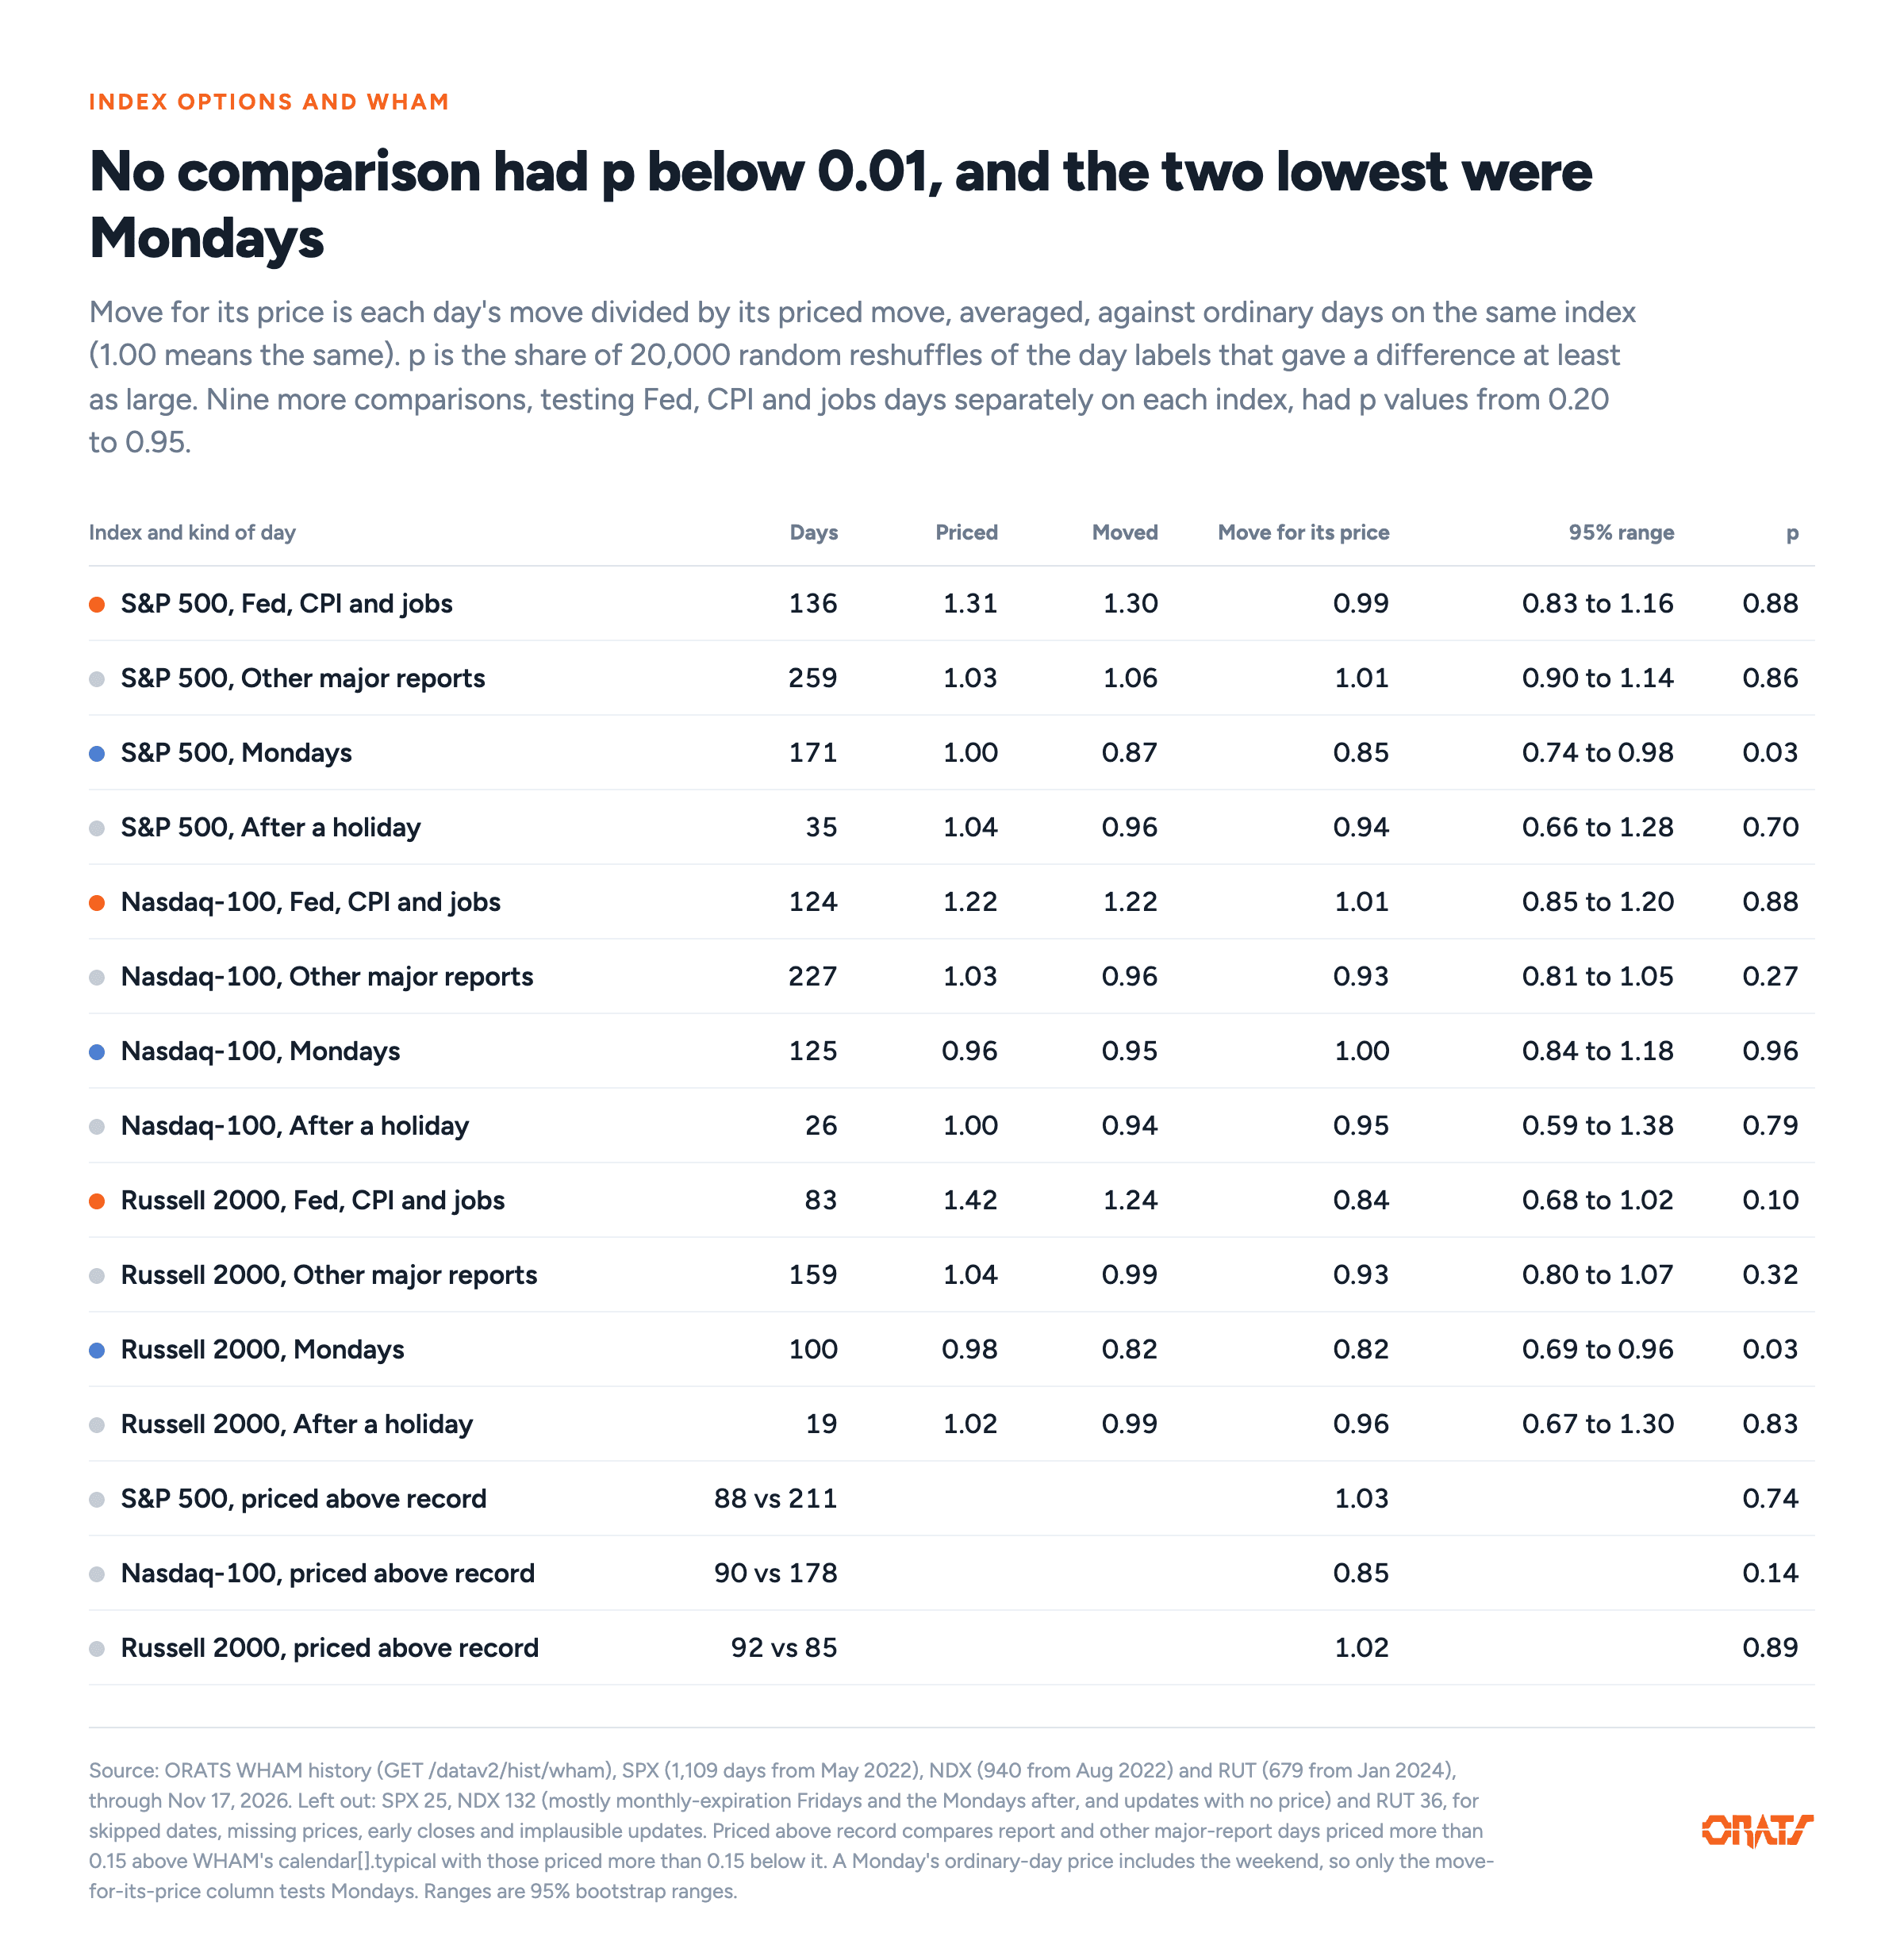
Every group of days compared on the S&P 500, Nasdaq-100 and Russell 2000. Source: ORATS WHAM history.
This series calls a gap real only at p below 0.01, and none of our 24 comparisons reached it. About one in 24 would fall below 0.05 by chance. Two did, and both were Mondays, measured from Friday 3:46 PM. On the S&P 500 and the Russell 2000, Mondays moved 15% to 18% less for their price than ordinary days (p = 0.03), and most of the S&P 500 gap came in 2022 and 2023.
WHAM's history is calculated with its current method, which was designed on the same history, so new days may fit it less well. Since WHAM became available on October 15, its three report days all moved less than priced, which is too few days to judge.
WHAM listed most report days five trading days ahead
The eventDays field lists the coming days priced above an ordinary day. Five trading days before each report it included 110 of the 136. Those 110 had been priced at 1.36 at that point and moved 1.35. The 26 not listed moved 1.05.
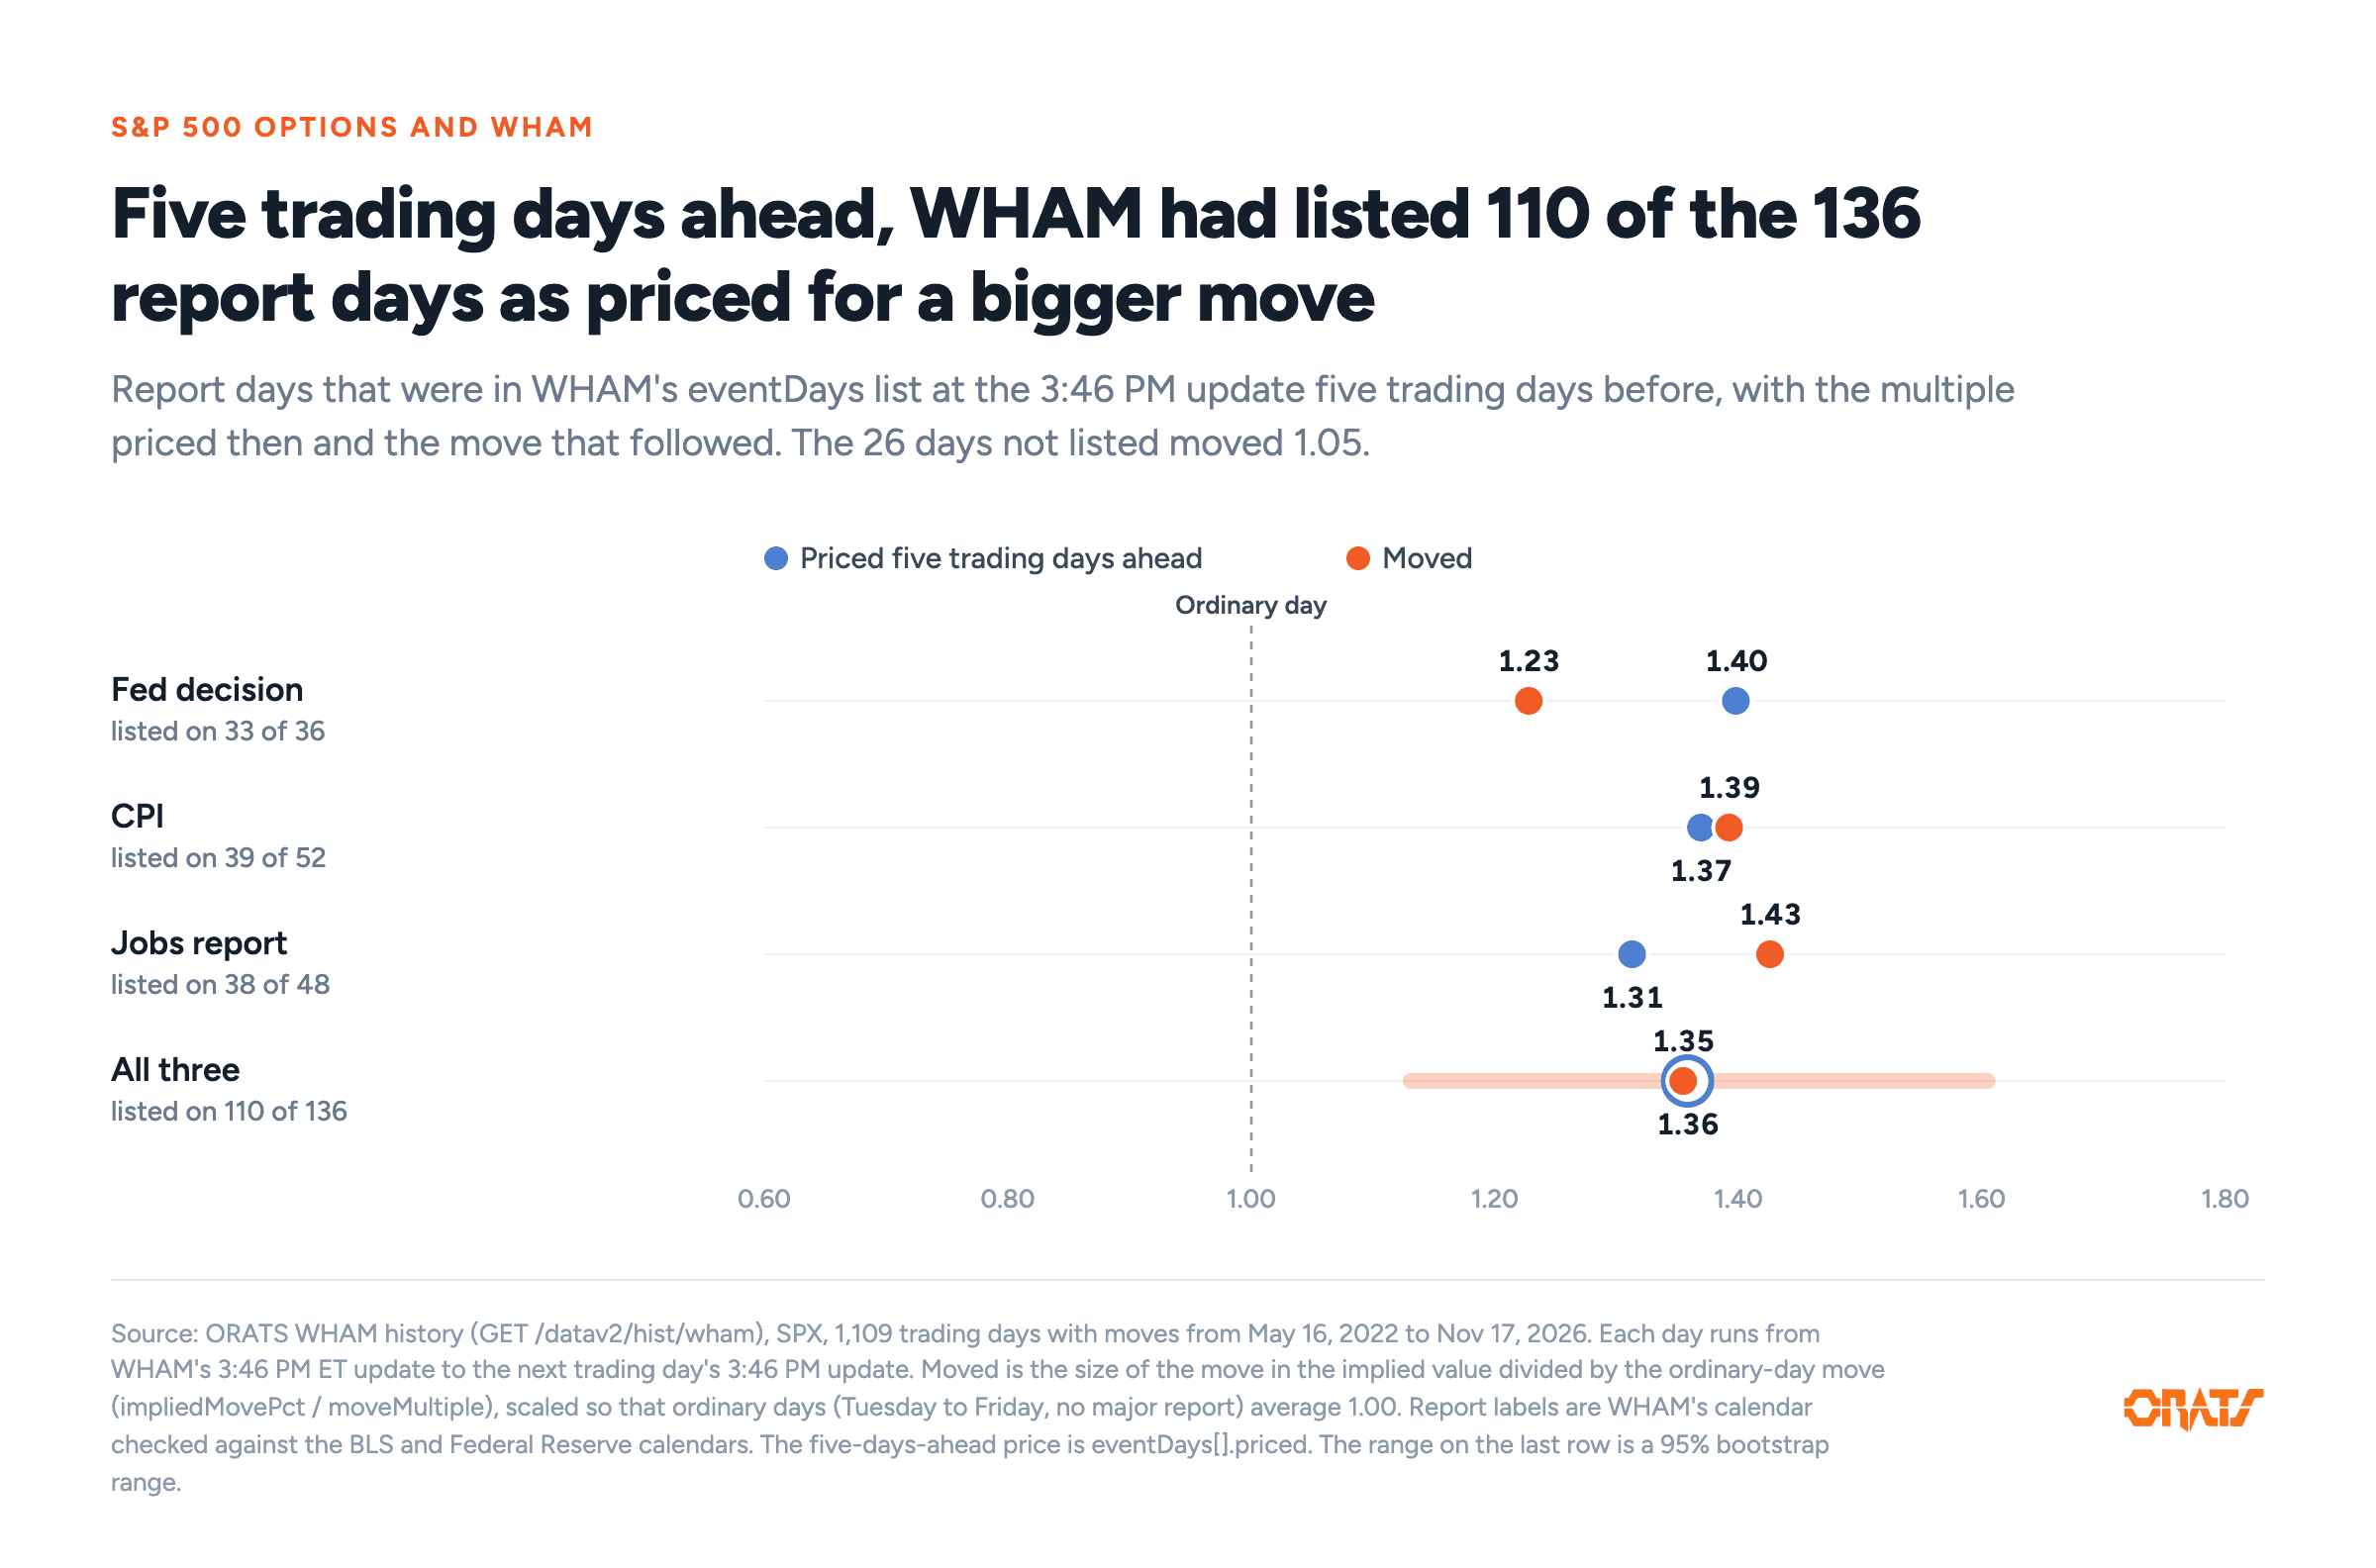
Report days as priced five trading days ahead, and the move that followed. Source: ORATS WHAM history, SPX.
The December reports are not yet in WHAM's range
WHAM has never listed a report day more than 14 trading days ahead, and on November 17 the December 9 and 10 reports were 15 and 16 trading days away. Five trading days ahead falls on November 27 for the jobs report and December 2 and 3 for the Fed and CPI. An ordinary day was priced to move 1.4%, against a 2026 average of 0.83%.
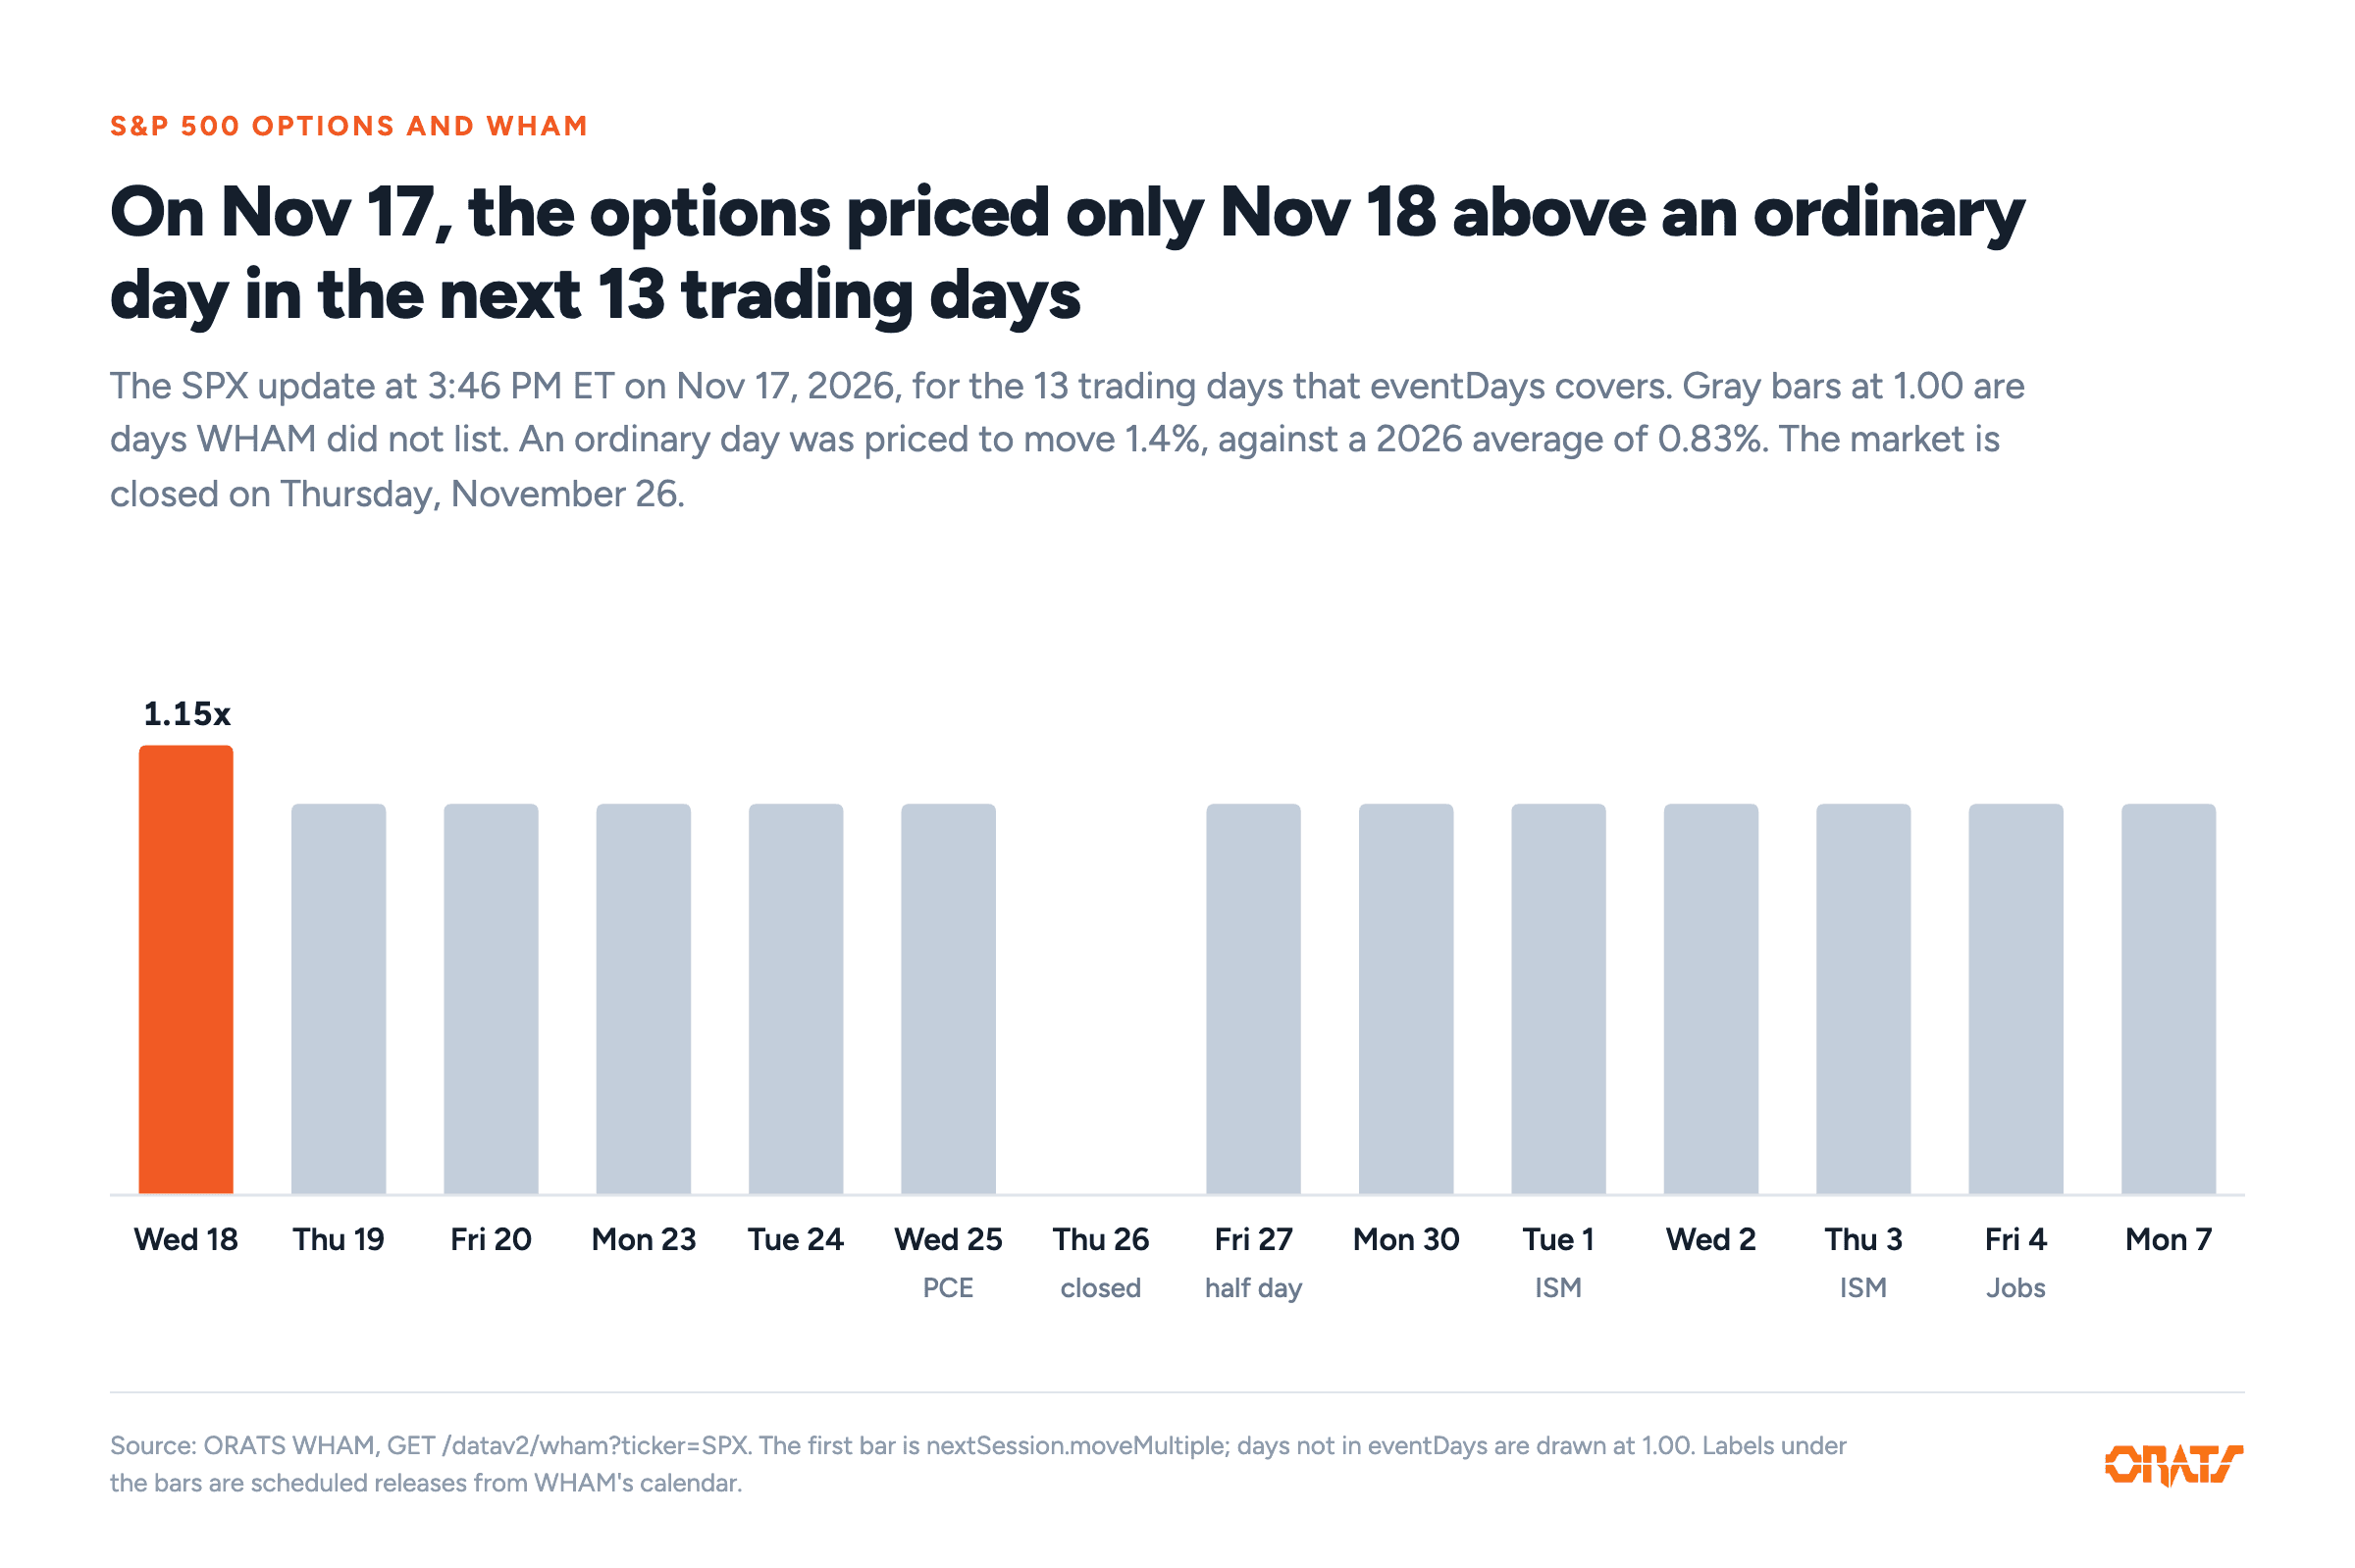
The next 13 trading days as of November 17, 2026. Source: ORATS WHAM, SPX, 3:46 PM ET update.
How to use the reading
- Before opening a position, list the eventDays between today and the option's expiration.
- On the S&P 500, days priced at 1.15 or more moved, on average, about as much more than an ordinary day as priced. The price did not reliably separate one such day from another.
- Report days did not move consistently more or less than their price, including days priced well above WHAM's typical field, the record of their last 12 occurrences (p = 0.74).
How to reproduce the numbers
WHAM is in every ORATS Data API plan. The script below needs Python 3.9 or later and nothing outside the standard library, except on Windows, where pip install tzdata adds the time zone data it uses. Set your token with export ORATS_TOKEN=your-token before running it. It makes about 1,180 requests, which count toward your plan's monthly limit, and took about eight minutes in our run with no output until the end.
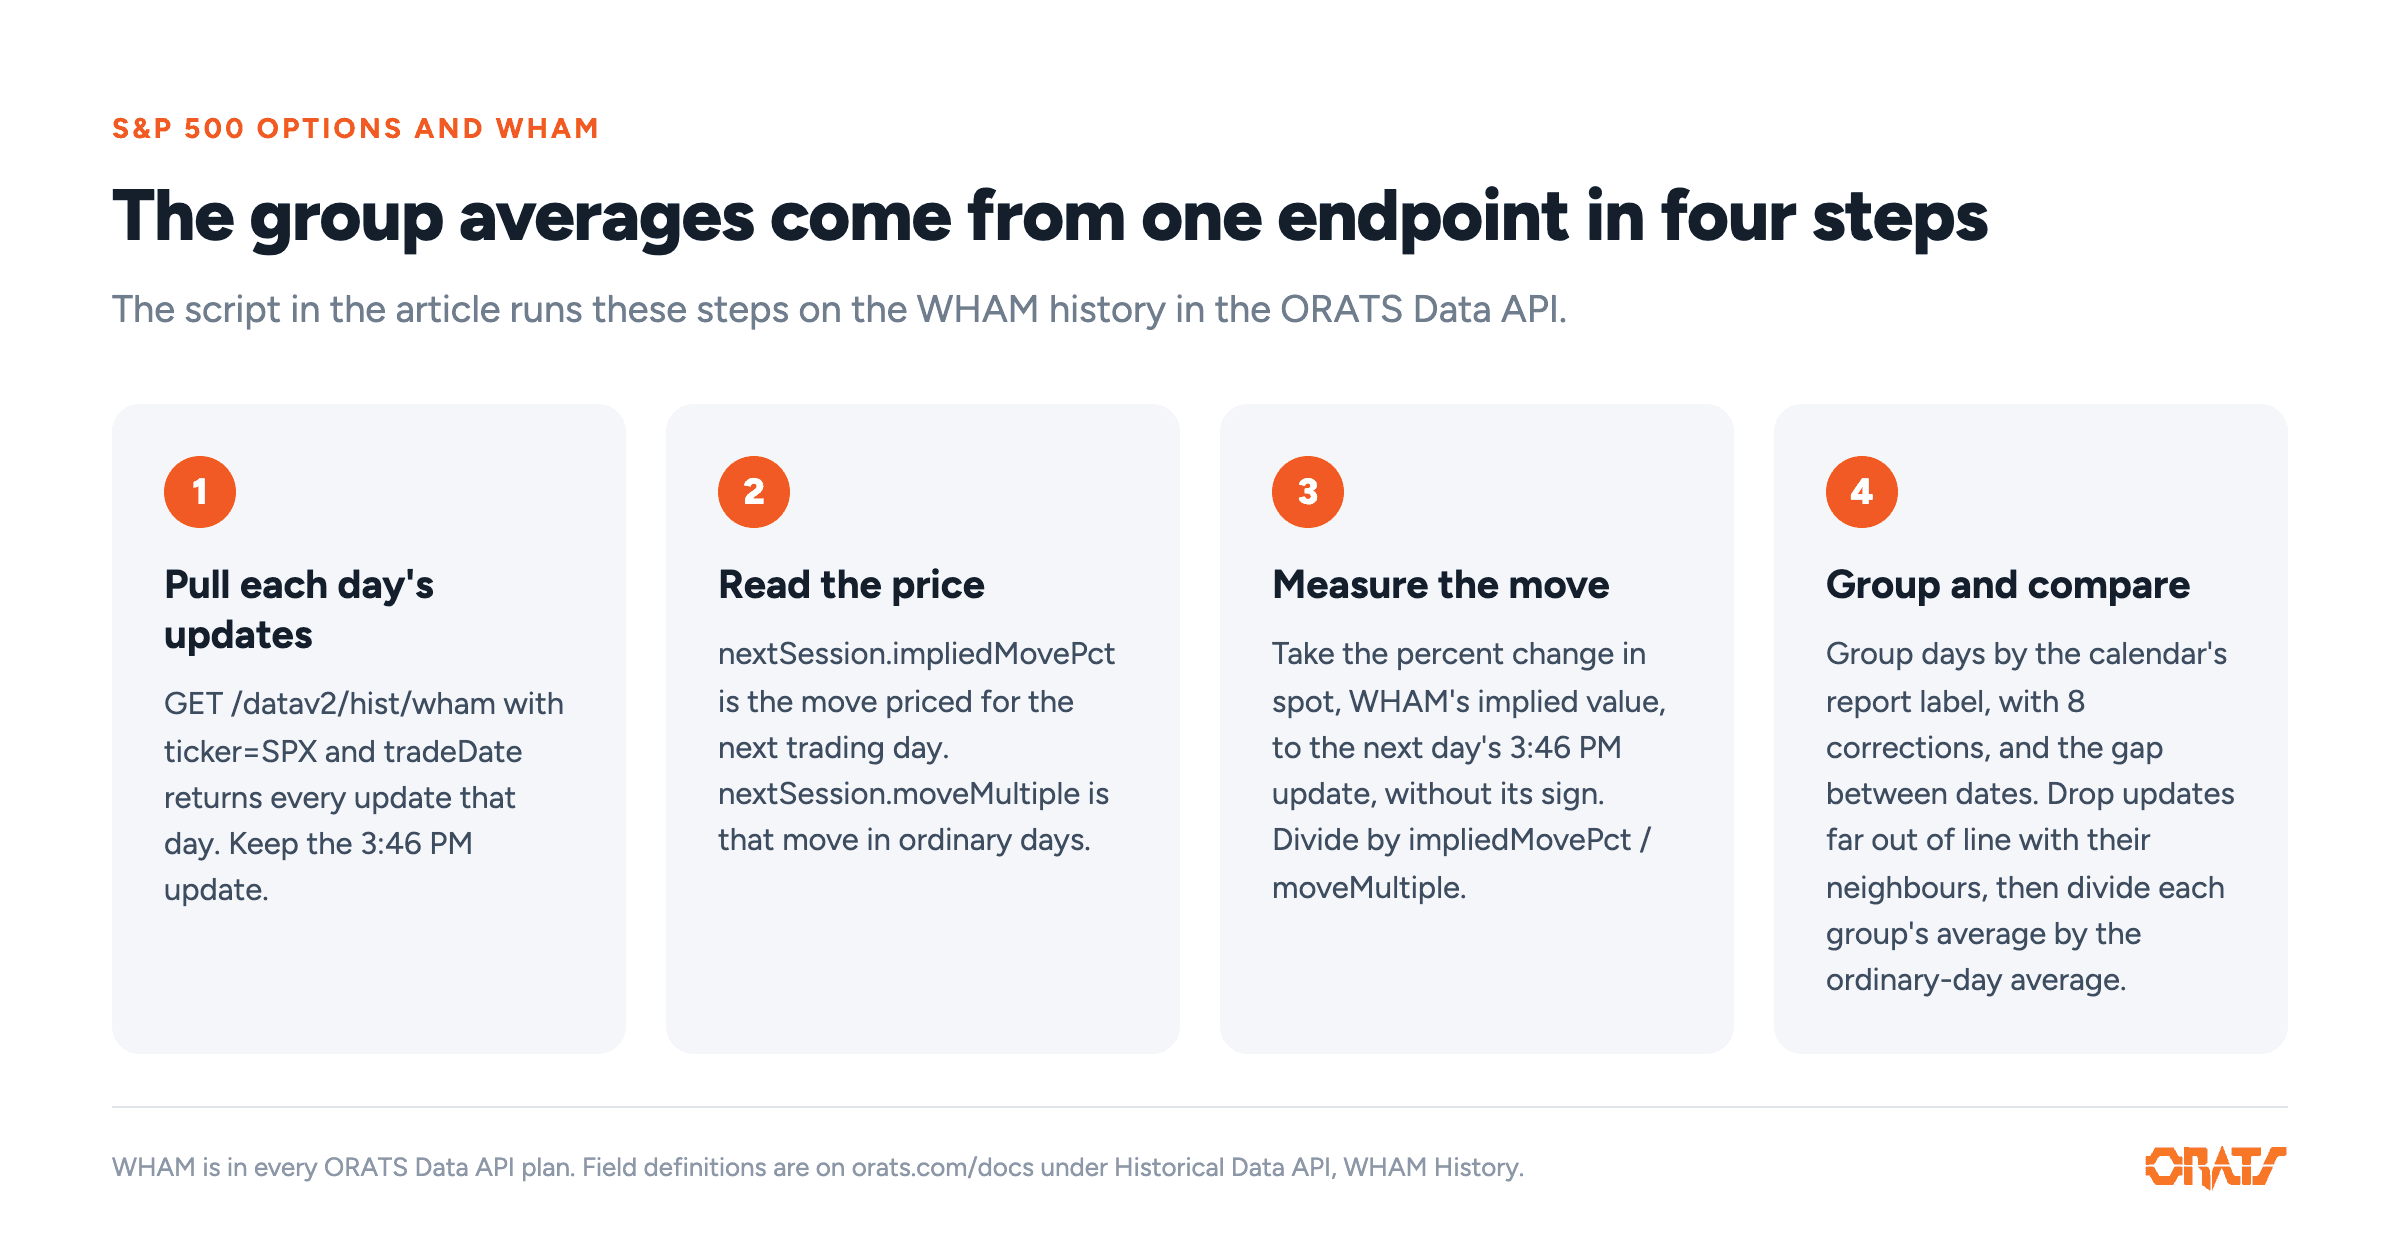
The test uses one endpoint, GET /datav2/hist/wham, in four steps.
import datetime as dt, json, os, statistics, urllib.error, urllib.parse, urllib.request
from zoneinfo import ZoneInfo

TOKEN, URL, ET = os.environ["ORATS_TOKEN"], "https://api.orats.io/datav2/hist/wham", ZoneInfo("America/New_York")
# WHAM's calendar labels these days as reports, but no such report came out that day (2025 shutdown
# cancellations and delays, a CPI revision release, a payroll benchmark release); the Fed decided on 2024-05-01.
NOT_RELEASED = {"2024-02-09", "2024-08-21", "2025-10-03", "2025-10-15", "2025-10-17", "2025-11-07", "2025-11-13"}
FED = {"2024-05-01"}
REPORTS = {"FOMC": "Fed, CPI or jobs", "CPI": "Fed, CPI or jobs", "Jobs (NFP)": "Fed, CPI or jobs", "PCE": "Other major report",
           "ISM": "Other major report", "Retail Sales": "Other major report", "JOLTS": "Other major report", "Powell": "Other major report"}

day, last = dt.date(2022, 5, 11), {}
while day <= dt.date(2026, 11, 17):                       # 1. each trading day's 3:46 PM update
    if day.weekday() < 5:
        q = urllib.parse.urlencode({"ticker": "SPX", "tradeDate": day.isoformat(), "token": TOKEN})
        try:
            rows = json.load(urllib.request.urlopen(f"{URL}?{q}", timeout=60))["data"]
            if rows:
                u = max(rows, key=lambda u: u["quoteDate"])
                t = dt.datetime.fromisoformat(u["quoteDate"].replace("Z", "+00:00")).astimezone(ET)
                last[day.isoformat()] = u if t.strftime("%H:%M") >= "15:40" else None   # None: early close
        except urllib.error.HTTPError as e:
            if e.code != 404: raise                       # 404 is a market holiday
    day += dt.timedelta(1)

dates, days = sorted(last), []
for a, b in zip(dates, dates[1:]):
    u, v = last[a], last[b]
    if not u or not v: continue
    ns = u["nextSession"]
    if ns["date"] != b or not ns["impliedMovePct"] or not ns["moveMultiple"]: continue
    cal = [c for c in u["calendar"] if a < c["date"] <= b]
    kind = "FOMC" if b in FED else None if b in NOT_RELEASED else cal[-1].get("eventType")
    if any(c.get("closed") for c in cal): g = "After a holiday"
    elif kind in REPORTS: g = REPORTS[kind]
    elif (dt.date.fromisoformat(b) - dt.date.fromisoformat(a)).days == 3: g = "Monday"
    else: g = "Ordinary day"
    normal = ns["impliedMovePct"] / ns["moveMultiple"]                       # the ordinary-day move
    days.append((g, ns["moveMultiple"], abs(v["spot"] / u["spot"] - 1) / normal, normal))   # 2. price, 3. move

keep = []                                                 # drop updates far out of line with their neighbours
for i, d in enumerate(days):
    near = statistics.median(x[3] for x in days[max(0, i - 5):i] + days[i + 1:i + 6])
    if 1 / 3 <= d[3] / near <= 3: keep.append(d)
base = statistics.mean(d[2] for d in keep if d[0] == "Ordinary day")    # 4. compare with ordinary days
print(len(keep), "days")
for g in ["Fed, CPI or jobs", "Other major report", "Ordinary day", "Monday", "After a holiday"]:
    x = [d for d in keep if d[0] == g]
    print(f"{g:20s} {len(x):4d} days  priced {statistics.mean(d[1] for d in x):.2f}  moved {statistics.mean(d[2] for d in x) / base:.2f}")
It should print 1,109 days, with Fed, CPI or jobs days priced at 1.31 and moved 1.30, and Mondays priced at 1.00 and moved 0.87. The spot field is WHAM's implied value of the index, derived from option prices, and the script uses it only for percent changes. The script reproduces the group averages. The ranges and p values come from resampling and reshuffling the same days. For the next trading day, nextSession.moveMultiple and that day's eventDays value can differ by a few hundredths, and the test uses nextSession. Missing prices come back as 0.
Every field is defined in the ORATS Historical Data API docs under WHAM History, and the update schedule is on the WHAM page.
Tyler Cheves is a Product Manager at ORATS (Option Research & Technology Services), a provider of options data, analytics, and backtesting infrastructure.
For educational purposes only and not a recommendation. ORATS data is as of November 17, 2026. The study covers 1,109 SPX trading days with moves from May 16, 2022 to November 17, 2026, with comparisons on NDX (940 days from August 2022) and RUT (679 days from January 2024) over overlapping dates. It measures moves, not trading results. Moves use WHAM's implied value at 3:46 PM ET, not the index close. WHAM's history is calculated with its current method, which was designed using the same history, and past results do not guarantee future results. The 0.80 comparison assumes a bell curve; on a root-mean-square measure, which does not, report days moved 1.06 times their priced move and ordinary days 1.05.
Options involve risk and are not suitable for all investors. See Characteristics and Risks of Standardized Options at theocc.com. S&P 500 is a registered trademark of Standard & Poor's Financial Services LLC. Nasdaq-100 is a registered trademark of Nasdaq, Inc. Russell 2000 is a trademark of Frank Russell Company.
Disclaimer:
The opinions and ideas presented herein are for informational and educational purposes only and should not be construed to represent trading or investment advice tailored to your investment objectives. You should not rely solely on any content herein and we strongly encourage you to discuss any trades or investments with your broker or investment adviser, prior to execution. None of the information contained herein constitutes a recommendation that any particular security, portfolio, transaction, or investment strategy is suitable for any specific person. Option trading and investing involves risk and is not suitable for all investors.
All opinions are based upon information and systems considered reliable, but we do not warrant the completeness or accuracy, and such information should not be relied upon as such. We are under no obligation to update or correct any information herein. All statements and opinions are subject to change without notice.
Past performance is not indicative of future results. We do not, will not and cannot guarantee any specific outcome or profit. All traders and investors must be aware of the real risk of loss in following any strategy or investment discussed herein.
Owners, employees, directors, shareholders, officers, agents or representatives of ORATS may have interests or positions in securities of any company profiled herein. Specifically, such individuals or entities may buy or sell positions, and may or may not follow the information provided herein. Some or all of the positions may have been acquired prior to the publication of such information, and such positions may increase or decrease at any time. Any opinions expressed and/or information are statements of judgment as of the date of publication only.
Day trading, short term trading, options trading, and futures trading are extremely risky undertakings. They generally are not appropriate for someone with limited capital, little or no trading experience, and/ or a low tolerance for risk. Never execute a trade unless you can afford to and are prepared to lose your entire investment. In addition, certain trades may result in a loss greater than your entire investment. Always perform your own due diligence and, as appropriate, make informed decisions with the help of a licensed financial professional.
Commissions, fees and other costs associated with investing or trading may vary from broker to broker. All investors and traders are advised to speak with their stock broker or investment adviser about these costs. Be aware that certain trades that may be profitable for some may not be profitable for others, after taking into account these costs. In certain markets, investors and traders may not always be able to buy or sell a position at the price discussed, and consequently not be able to take advantage of certain trades discussed herein.
Be sure to read the OCCs Characteristics and Risks of Standardized Options to learn more about options trading.
Related Posts