Trading
Sunday, August 20th 2023
Find Stocks With Undervalued Implied Volatility
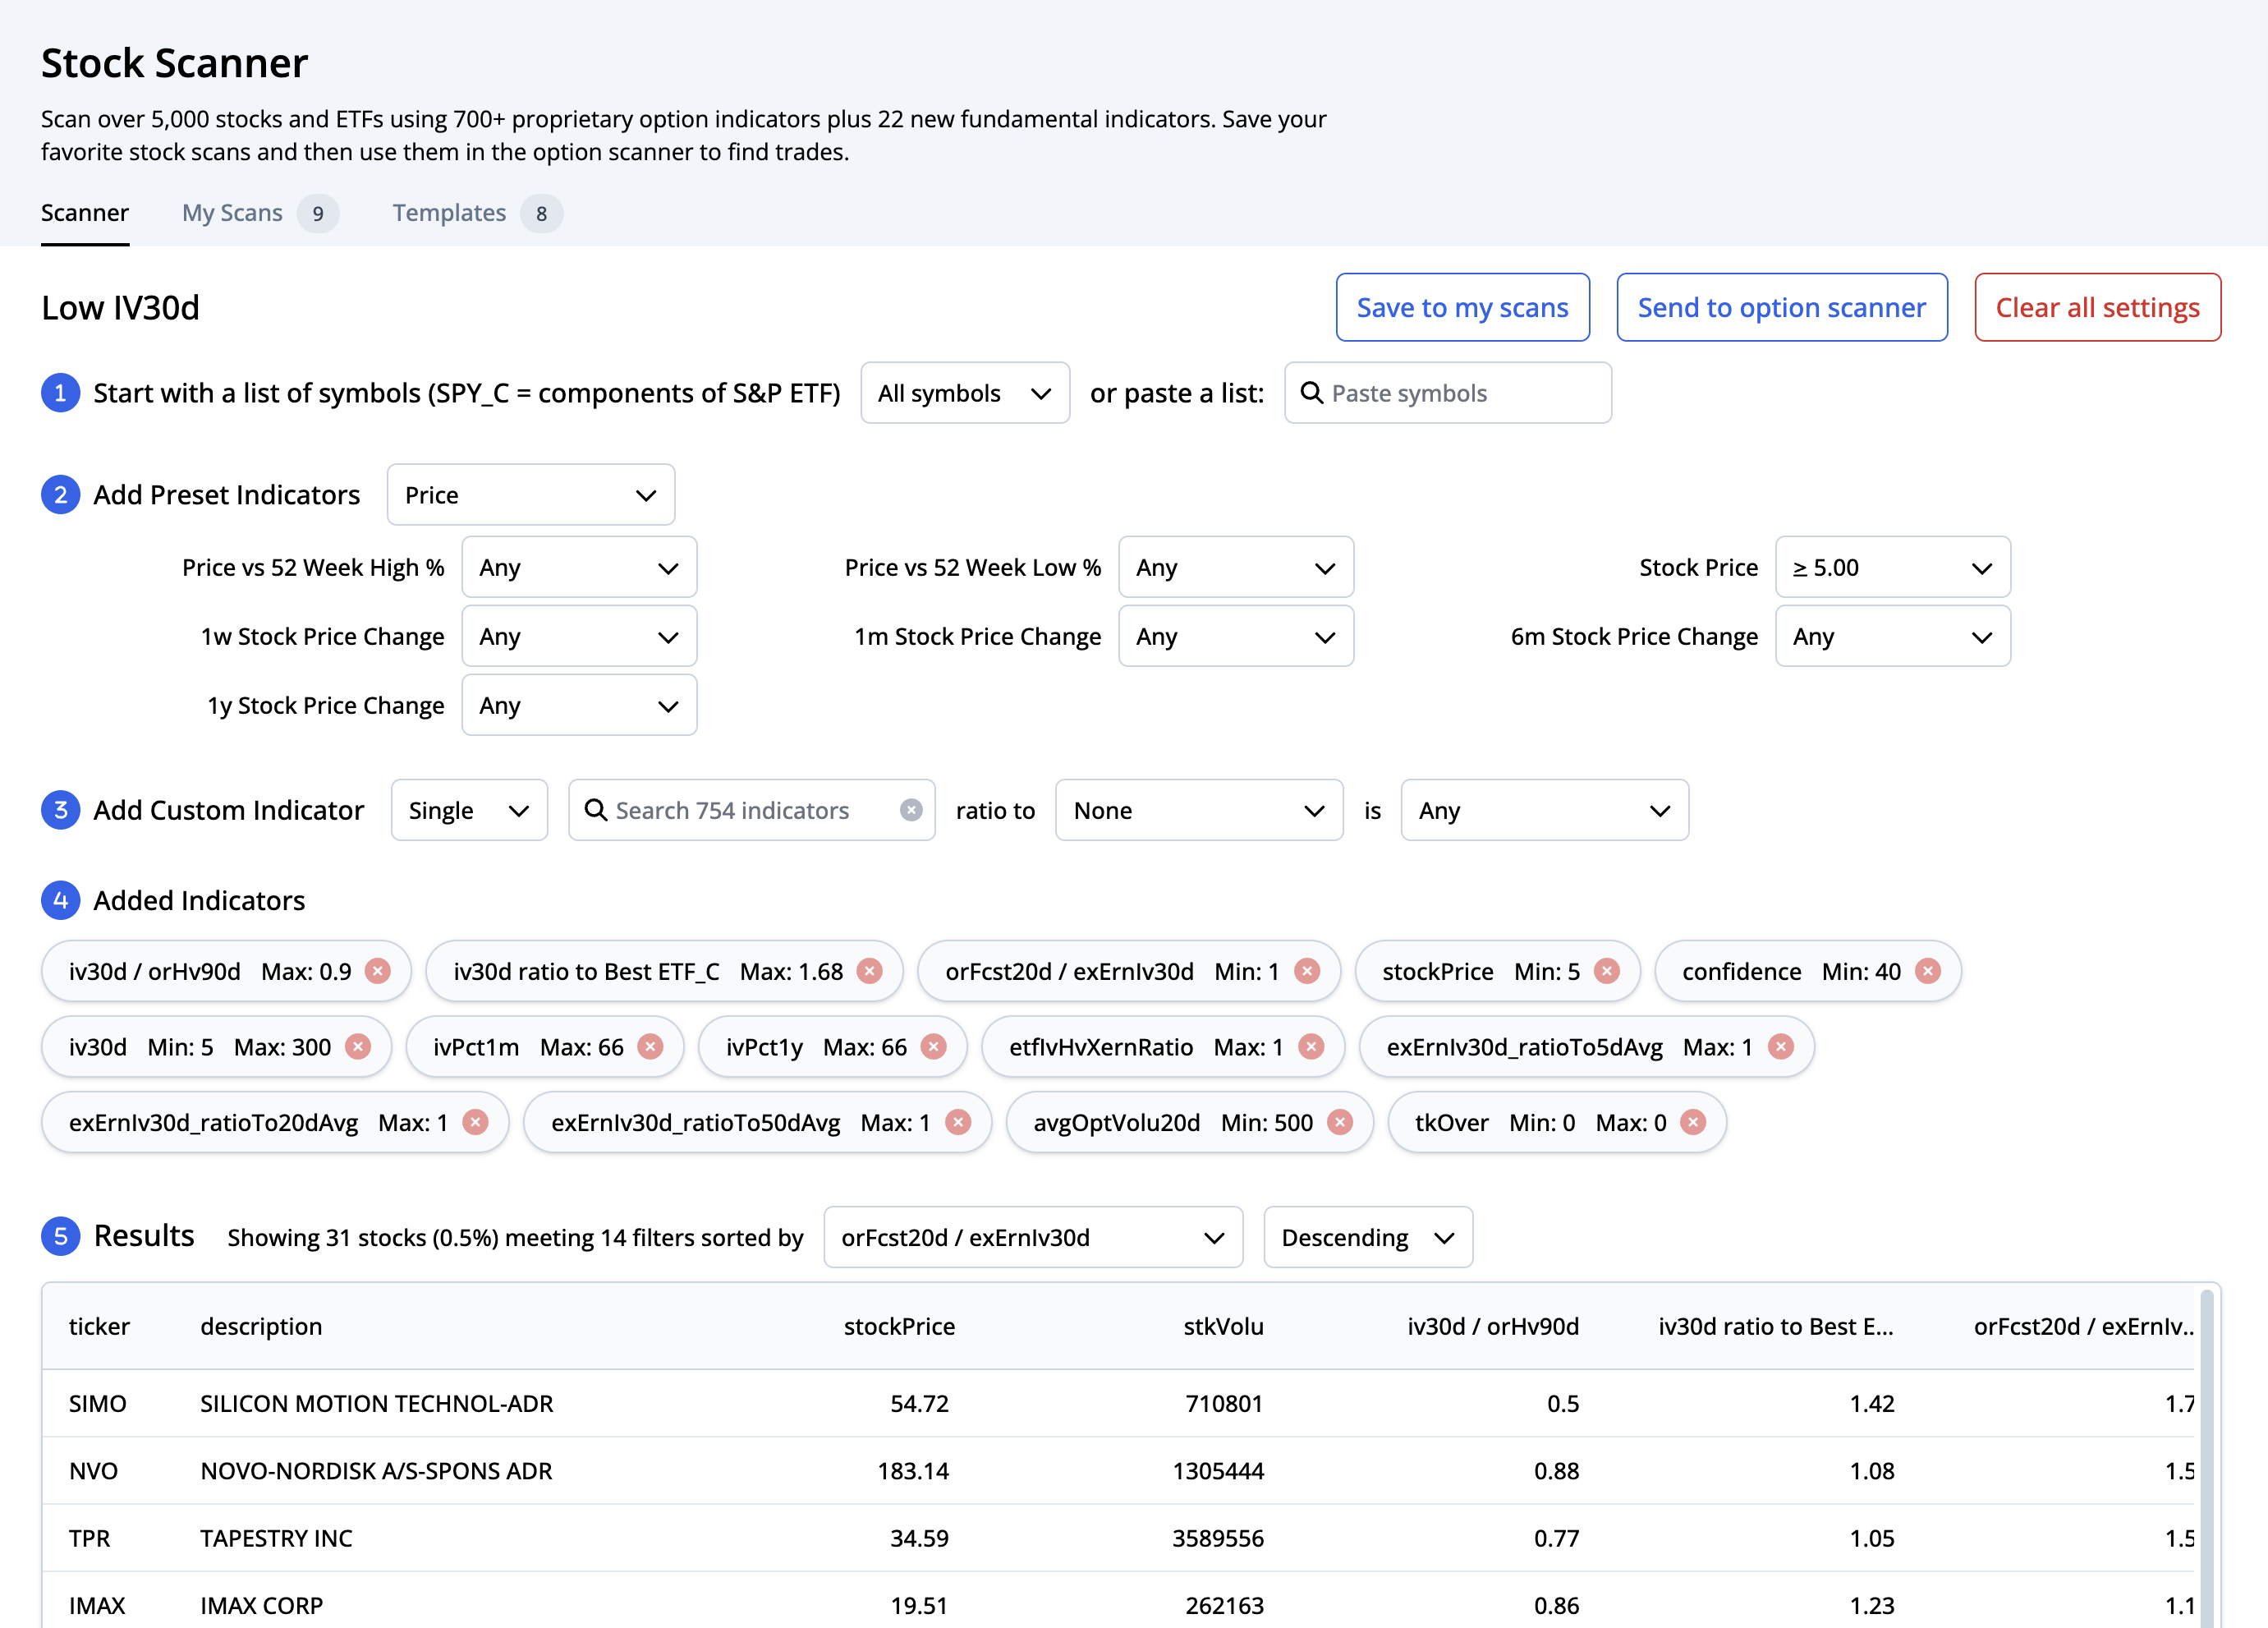
Use the Low IV30d scan in the ORATS stock scanner to identify stocks with undervalued implied volatility.
Summary
This post introduces the Low IV30d stock scan, designed to identify stocks with undervalued implied volatility. The scan uses ex-earnings IV to normalize comparisons to historical data and ETFs, and filters stocks based on their IV ratios and sector comparisons. Long straddles and strangles are good strategies for trading undervalued volatility.
Introduction
Scanning for stocks is a critical component in any trader’s toolkit. Since volatility is such a primary driver of options prices, scanning for stocks with meaningful changes to their implied volatility can help options traders make informed decisions on which stocks to trade. In this post, we’ll look at the Low IV30d scan, designed to identify stocks where the implied volatility (IV) is undervalued. You can check out the scan here: https://dashboard.orats.com/stock-scanner/scanner?id=2251799813685402.
Identifying undervalued stocks
Sometimes, the implied volatility of a stock gets undervalued usually because of supply and demand imbalances in the options. We look at the ratio of the ex-earnings 30-day implied volatility versus its 5-day, 20-day, and 50-day average to identify these times. We also look at how the implied volatility of each stock compares to other stocks in its same sector. The filtered stocks would be candidates for long straddles or strangles.
Why is ex-earnings implied volatility important?
We use ex-earnings implied volatility in this stock scan because it provides a normalized comparison to historical data as well as to the stock’s best ETF. Earnings effects are seen when a stock is approaching it’s earnings date, and the implied volatility steadily rises until the moment earnings are reported, at which point it falls immediately back to normal levels. ORATS’ ex-earnings indicators are a reflection of the true implied volatility of the stock without any of the earnings effects.
How to trade undervalued volatility
Once you’ve run the scan and identified trades with undervalued implied volatility, you can hop over to the option scanner and import the stock scan in the “Add symbols” section. This will take the top 25 symbols and scan for options that meet your criteria. Long straddles and strangles are good strategies to take advantage of undervalued volatility, because you’re expecting volatility to increase back to its normal levels. Any strategy with a positive Vega goes well with this stock scan.
Indicators

Here is a list of all the indicators used in this stock scan:
- iv30d / orHv90d is <0.9: 30 calendar day interpolated implied volatility / 90-day historical intraday volatility.
- iv30d ratio to Best ETF_C is <1.68: The Best ETF_C is the component ETF that tracks a weighted average of the components of the symbol’s closest SPDR sector ETF.
- orFcst20d / exErnIv30d is >1: The orFcst20d tracks the ORATS forecast of stock volatility for the next 20 days based on data with earnings taken out. Forecasts are developed using a combination of ex-earnings implied volatility, historical volatility patterns, and relationships to the volatility of the best ETF_C.
- stockPrice is >5
- confidence is >40: The total weighted confidence from the monthly implied volatilities derived from each month’s number of options and bid ask width of the options markets. A higher confidence indicates that ORATS is more confident in its forecast of volatility.
- iv30d is >5
- ivPct1m is <66: A measure of implied volatility vs its past 1 month values. If IV percentile is 66% – It means that current IV value is higher than 66% of previous 1 month values (and lower than 34% of them).
- ivPct1y is <66: A measure of implied volatility vs its past 1 year values. If IV percentile is 66% – It means that current IV value is higher than 66% of previous 1 year values (and lower than 34% of them).
- etfIvHvXernRatio is <1: orIvXern / orHvXern20d ratio divided by the ETF 30day implied / orHv20d ratio.
- exErnIv30d_ratioTo5dAvg is <1: exErnIv30d is the implied 30 calendar day interpolated implied volatility with earnings effect out. This indicator compares it to its 5-day moving average.
- exErnIv30d_ratioTo20dAvg is <1
- exErnIv30d_ratioTo50dAvg is <1
- avgOptVolu20d is >500: The average option volume for all strikes over the last 20 days.
- tkOver is 0: This filters out all takeovers or rumored takeovers.
Disclaimer:
The opinions and ideas presented herein are for informational and educational purposes only and should not be construed to represent trading or investment advice tailored to your investment objectives. You should not rely solely on any content herein and we strongly encourage you to discuss any trades or investments with your broker or investment adviser, prior to execution. None of the information contained herein constitutes a recommendation that any particular security, portfolio, transaction, or investment strategy is suitable for any specific person. Option trading and investing involves risk and is not suitable for all investors.
All opinions are based upon information and systems considered reliable, but we do not warrant the completeness or accuracy, and such information should not be relied upon as such. We are under no obligation to update or correct any information herein. All statements and opinions are subject to change without notice.
Past performance is not indicative of future results. We do not, will not and cannot guarantee any specific outcome or profit. All traders and investors must be aware of the real risk of loss in following any strategy or investment discussed herein.
Owners, employees, directors, shareholders, officers, agents or representatives of ORATS may have interests or positions in securities of any company profiled herein. Specifically, such individuals or entities may buy or sell positions, and may or may not follow the information provided herein. Some or all of the positions may have been acquired prior to the publication of such information, and such positions may increase or decrease at any time. Any opinions expressed and/or information are statements of judgment as of the date of publication only.
Day trading, short term trading, options trading, and futures trading are extremely risky undertakings. They generally are not appropriate for someone with limited capital, little or no trading experience, and/ or a low tolerance for risk. Never execute a trade unless you can afford to and are prepared to lose your entire investment. In addition, certain trades may result in a loss greater than your entire investment. Always perform your own due diligence and, as appropriate, make informed decisions with the help of a licensed financial professional.
Commissions, fees and other costs associated with investing or trading may vary from broker to broker. All investors and traders are advised to speak with their stock broker or investment adviser about these costs. Be aware that certain trades that may be profitable for some may not be profitable for others, after taking into account these costs. In certain markets, investors and traders may not always be able to buy or sell a position at the price discussed, and consequently not be able to take advantage of certain trades discussed herein.
Be sure to read the OCCs Characteristics and Risks of Standardized Options to learn more about options trading.
Related Posts


