Earnings
Monday, July 11th 2022
PepsiCo (PEP) Earnings Report July 11, 2022
The earnings report scans for high volume with upcoming earnings announcements, research that stock's historical earnings information, and identify a potential options trade.
Summary
The ORATS earnings report analyzes stocks with upcoming earnings announcements and identifies potential options trades. Focusing on PepsiCo, the report shows the options market expecting a move of 2.6% in either direction, breached in 0 out of the last 12 earnings. The highest ranked trade is a Long Put Calendar with strikes at 170, expiring on Friday, October 21st and Friday, August 5th, for a debit of $3.85, with a probability of profit of 53.69% and a reward to risk ratio of 1 to 1.3.
Welcome to the ORATS earnings report where we scan for companies with upcoming earnings announcements, check out historical earnings information, and find a potential options trade.
Read on or watch the video overview here: https://youtu.be/S-U3n5g-QW4.
Let's start by running a scan on stocks reporting earnings this week, which includes the total option volume indicator, sorted from greatest to least.

Focusing on PepsiCo, as we click through, we see this large-cap company in the beverages-non-alcoholic industry reports earnings on Monday, July 11th, after the close.
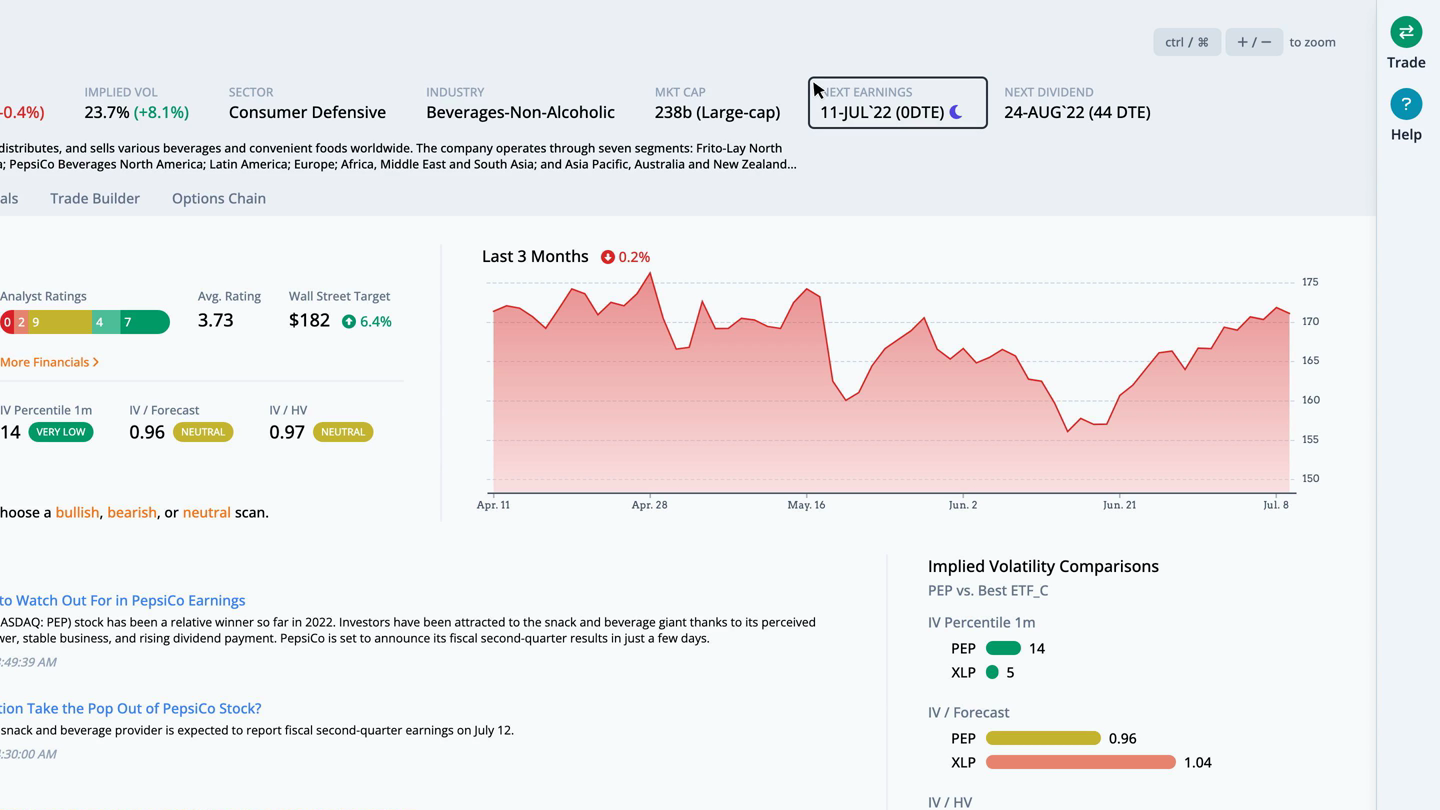
The earnings and financials tab takes us to more detail showing the options market expecting a move of 2.6% in either direction. This move was breached in 0 out of the last 12 earnings.
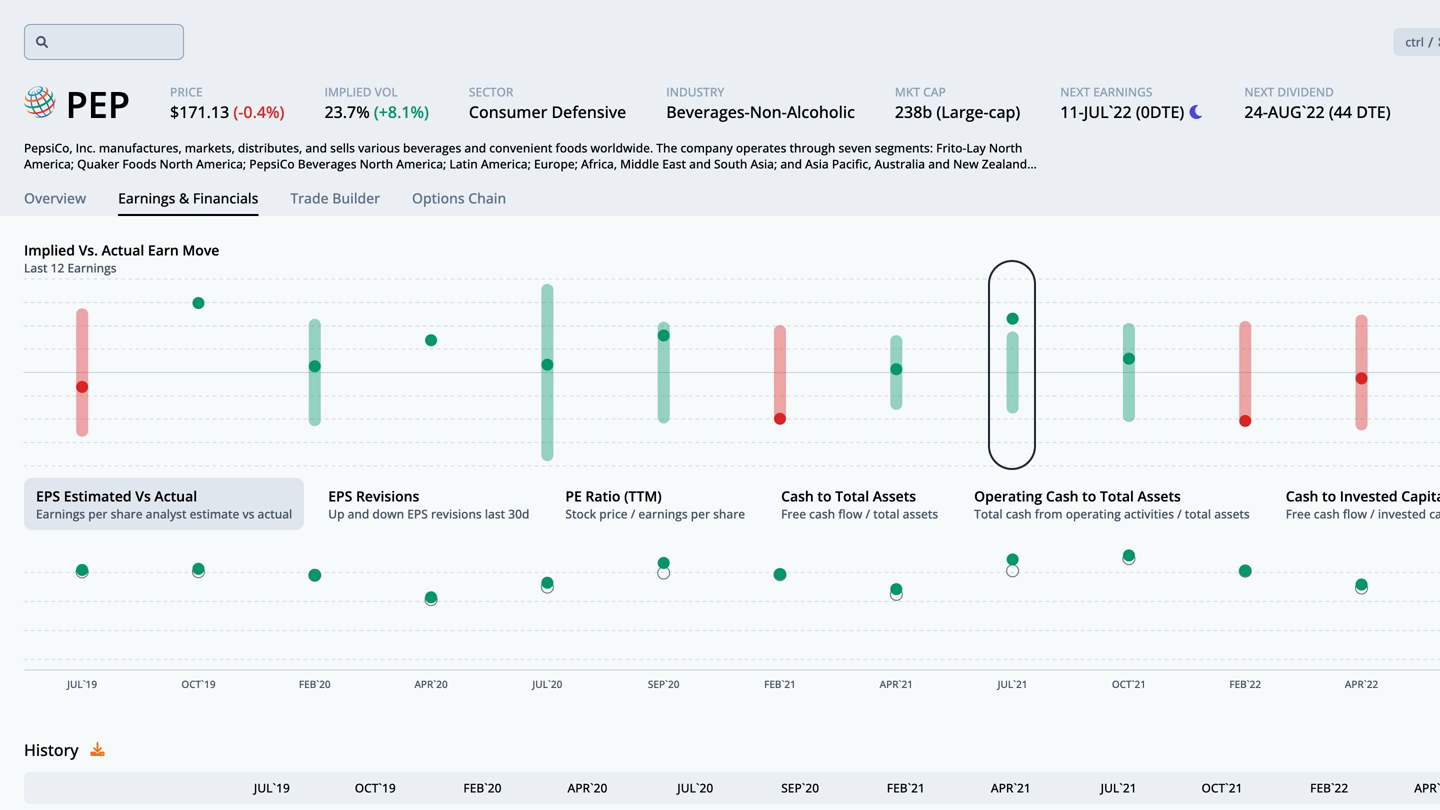
During that time, the post-earnings move was outside of the implied range 1 times. In those cases, long straddles were profitable. The rest of the earnings moves likely yielded profitable short straddles. We can overlay quarterly financial data by clicking on the ratios below the earn move graph. Let's look at the PE ratio, which is the stock price divided by the trailing twelve months earnings per share.
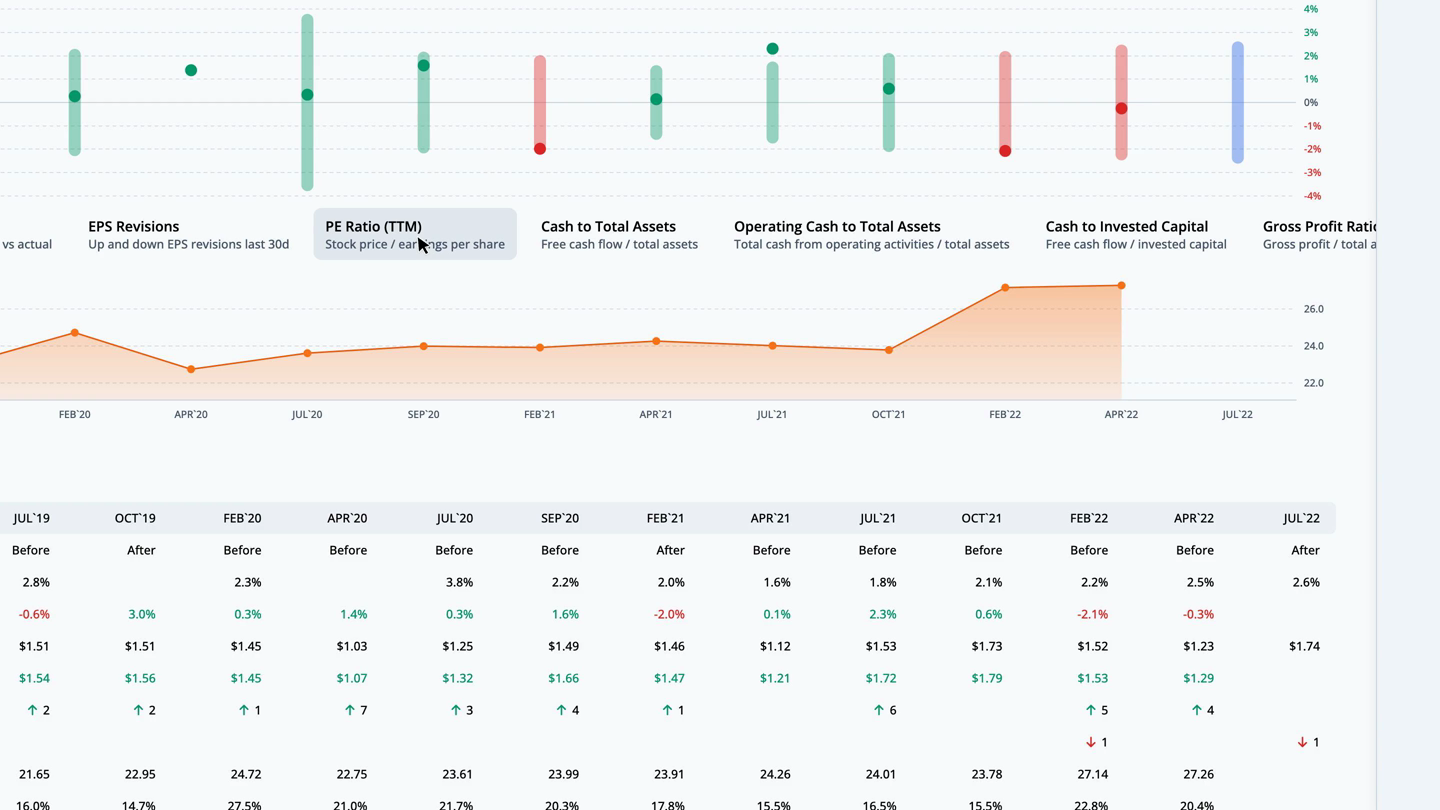
For PEP, the current PE ratio is 27.0, which is 26.9% over the average for the last twelve earnings observations. Returning to the overview tab, we can quickly run a scan to find the best option trades. Since earnings are right around the corner, we scan for neutral strategies, then filter the scan results by S%, or smoothed edge, by setting it between negative and positive 3%.
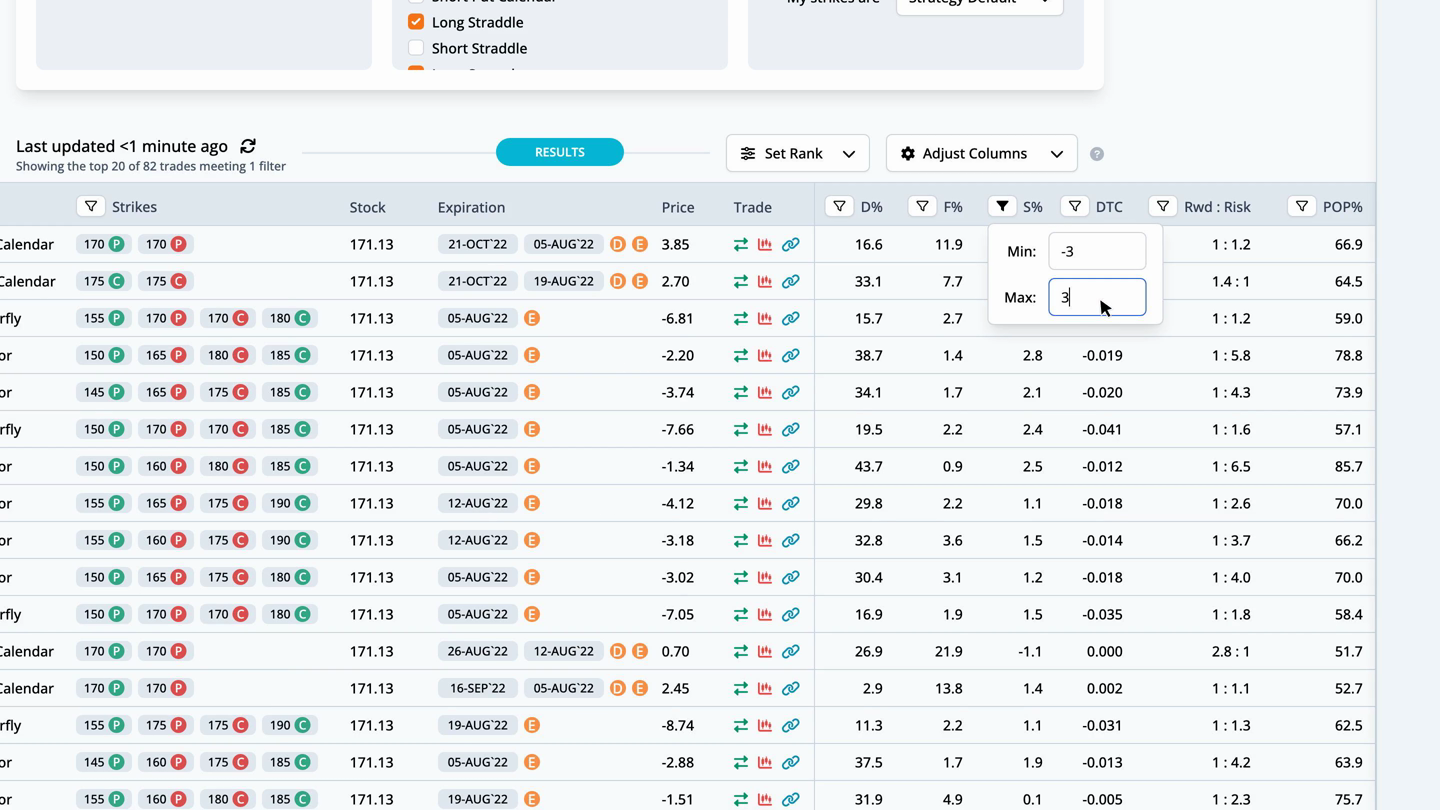
This helps narrow the results to trades that are fairly priced. The highest ranked trade is a Long Put Calendar with strikes at 170, expiring on Friday, October 21st and Friday, August 5th, for a debit of $3.85.
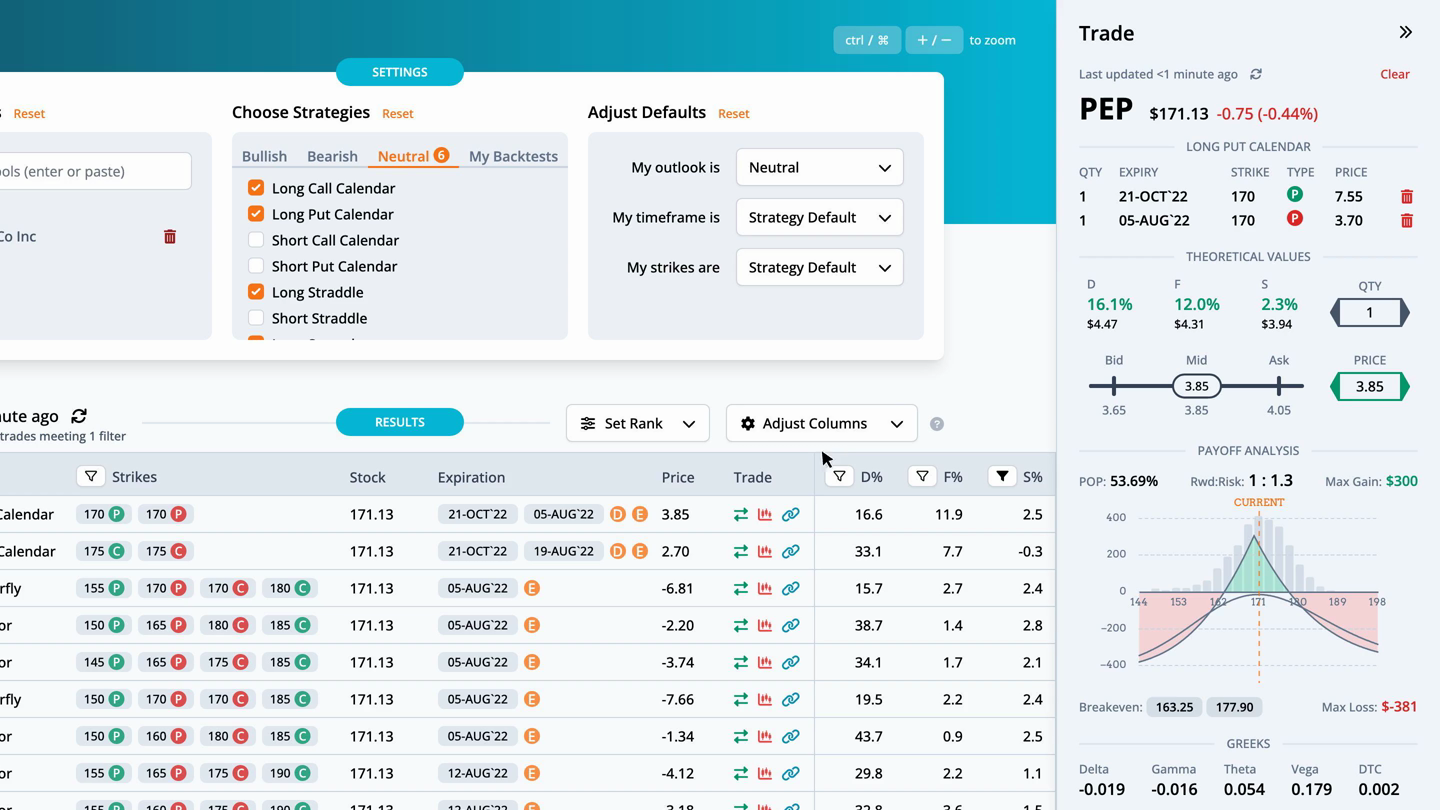
By pulling up the trade, we can see the theoretical values in more detail. The distribution edge, found by the expected value of the payoff picture on the stock's historical distribution, has an edge of 16.1%. The forecast edge, which is derived from historical volatility, has an edge of 12.0%. Lastly, the smoothed edge, which is calculated by drawing a best fit curve through the monthly implied volatilities, has an edge of 2.3%. The edge is relative to the mid-market price of the trade. Greater positive edges are a theoretical benefit to the trader. We can also look at the payoff graph. The probability of profit sums the probability of the nodes for the part of the payoff picture above the zero profit line over three standard deviations. For this trade the probability of profit is 53.69%. The reward to risk divides the max gain by the max loss. Here the 1 to 1.3 is the ratio of the max gain of $300 to the max loss of $-381. There are two break evens for this Long Put Calendar at 163.25 and 177.9. The total greeks and ThinkOrSwim code complete the information on the trade analysis popout.
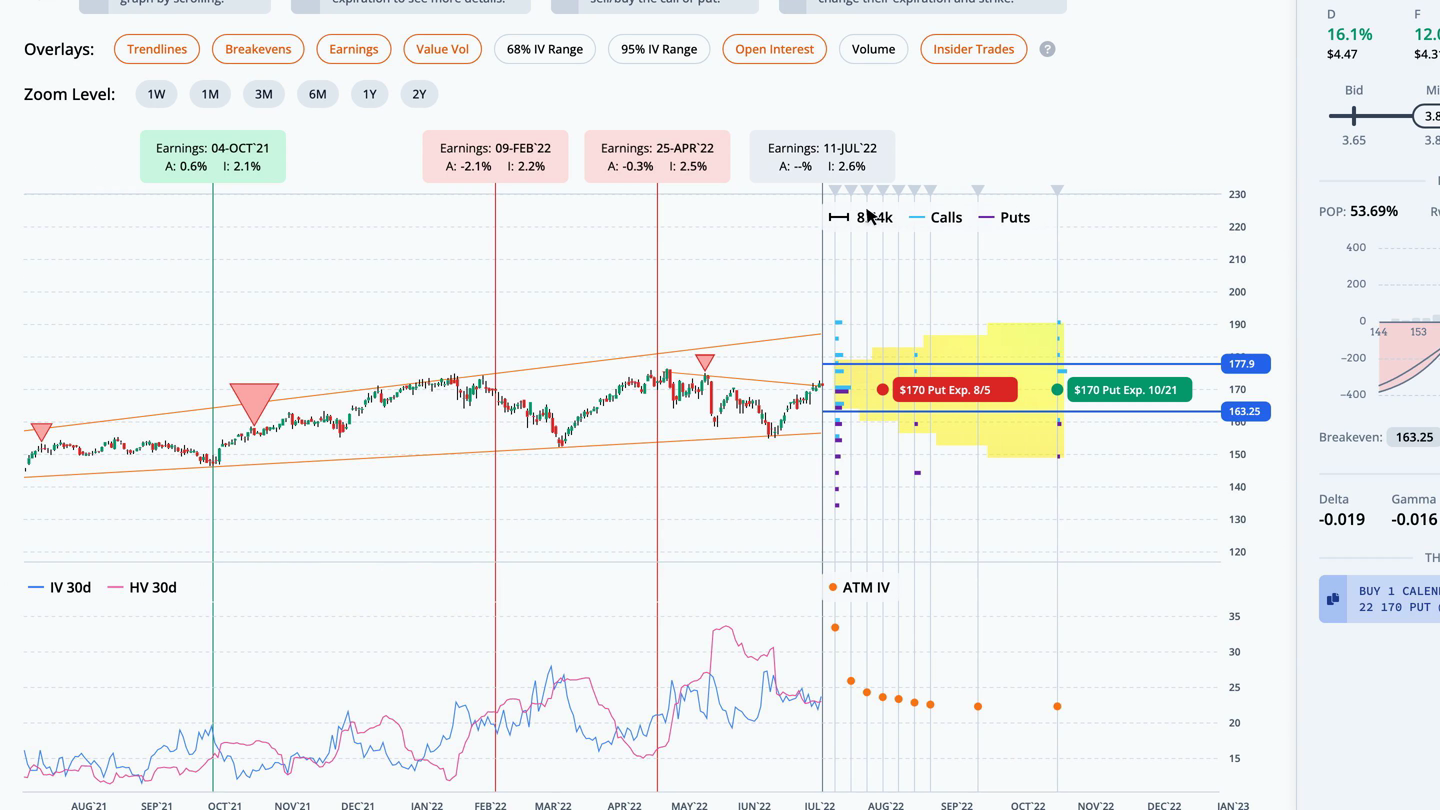
Next, let's look at this trade in the trade builder. Over the last month, the stock price rose 7.1%, while the thirty-day implied volatility fell 12.9%. The average slope of the trendlines is positive. The heatmap on the right side of the graph is green where volatility and slope are undervalued, and red where they are overvalued. In this case, short term IV and slope are neutral, while the long term is neutral.
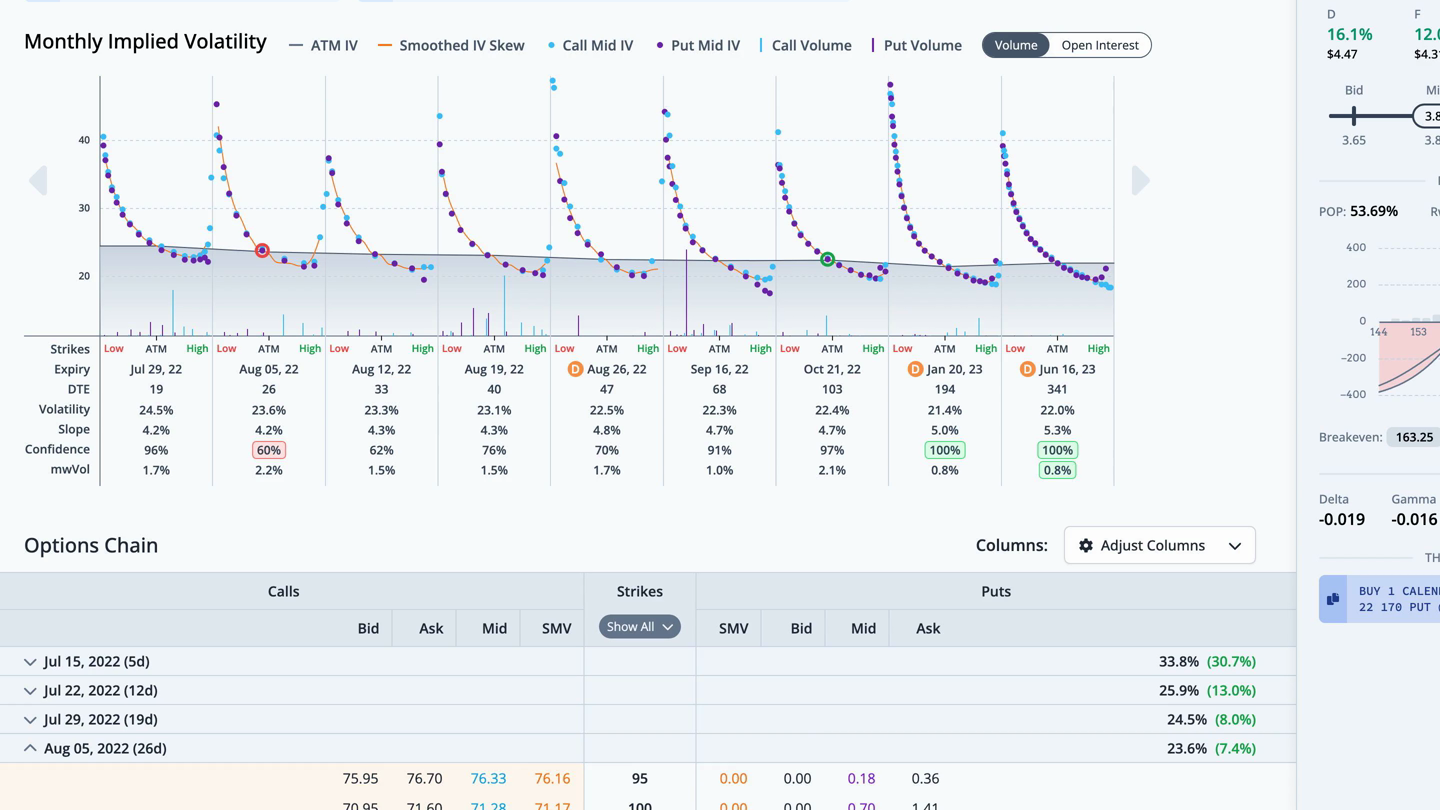
We can also see this trade overlaid on the monthly implied volatility graph in the chain tab. The legs for this trade are circled. For any questions or issues with the article, please contact otto@orats.com. To subscribe to the dashboard, please visit https://orats.com/dashboard
Disclaimer:
The opinions and ideas presented herein are for informational and educational purposes only and should not be construed to represent trading or investment advice tailored to your investment objectives. You should not rely solely on any content herein and we strongly encourage you to discuss any trades or investments with your broker or investment adviser, prior to execution. None of the information contained herein constitutes a recommendation that any particular security, portfolio, transaction, or investment strategy is suitable for any specific person. Option trading and investing involves risk and is not suitable for all investors.
All opinions are based upon information and systems considered reliable, but we do not warrant the completeness or accuracy, and such information should not be relied upon as such. We are under no obligation to update or correct any information herein. All statements and opinions are subject to change without notice.
Past performance is not indicative of future results. We do not, will not and cannot guarantee any specific outcome or profit. All traders and investors must be aware of the real risk of loss in following any strategy or investment discussed herein.
Owners, employees, directors, shareholders, officers, agents or representatives of ORATS may have interests or positions in securities of any company profiled herein. Specifically, such individuals or entities may buy or sell positions, and may or may not follow the information provided herein. Some or all of the positions may have been acquired prior to the publication of such information, and such positions may increase or decrease at any time. Any opinions expressed and/or information are statements of judgment as of the date of publication only.
Day trading, short term trading, options trading, and futures trading are extremely risky undertakings. They generally are not appropriate for someone with limited capital, little or no trading experience, and/ or a low tolerance for risk. Never execute a trade unless you can afford to and are prepared to lose your entire investment. In addition, certain trades may result in a loss greater than your entire investment. Always perform your own due diligence and, as appropriate, make informed decisions with the help of a licensed financial professional.
Commissions, fees and other costs associated with investing or trading may vary from broker to broker. All investors and traders are advised to speak with their stock broker or investment adviser about these costs. Be aware that certain trades that may be profitable for some may not be profitable for others, after taking into account these costs. In certain markets, investors and traders may not always be able to buy or sell a position at the price discussed, and consequently not be able to take advantage of certain trades discussed herein.
Be sure to read the OCCs Characteristics and Risks of Standardized Options to learn more about options trading.
Related Posts