Backtesting
Thursday, November 30th 2023
Behind the Scenes of Over 50 Million Options Backtests
We reveal the process and calculations behind our groundbreaking new options backtester, engineered to help you find the perfect strategy.
Summary
Backtesting is crucial for options trading strategies, providing insights into risk and reward potential, entry and exit criteria, and the impact of market conditions. However, common pitfalls include using inaccurate trade execution prices, overfitting data, ignoring path dependency, and misunderstanding notional vs. marginal return. ORATS has designed a new backtester to address these issues, which allows for filtering by entry and exit criteria, measuring performance metrics such as Sharpe and Sortino ratios, and ranking strategies based on different algorithms. With a database of over 50 million backtests, ORATS aims to simplify and enhance the backtesting process for traders.
In this article we reveal the story behind our new and innovative options backtester, which can be used to help you find the perfect strategy. We uncover everything from conception to completion - backtesting pitfalls, best practices, calculations, and the future of backtesting and systematic trading. Before we dive into the latest tools, let’s go over the importance of backtesting.
Why backtesting?
A robust options trading strategy depends on accurate backtesting practices. A backtest shows you how the strategy performed historically, and gives you an idea of what to expect. You can learn a lot about a strategy with a backtest. While historical performance is not an indicator of future performance, a backtest can help you identify things like:
- The risk and reward potential of a strategy
- The relative performance of different entry criteria like days to expiration and strike deltas
- The impact of market conditions on strategy performance
- The importance of exit criteria like stop losses and profit targets
These are benefits, but there are also complications with backtesting. Let’s look at some of the common issues traders face when backtesting options.
Common pitfalls of options backtesting
Having been in the backtesting business for over a decade, we see many traders fall into the same traps. The complexity of backtesting options makes it easy to:
- Use inaccurate or unrealistic trade execution prices
- Overfit the data to create unrealistic returns
- Accidentally follow path dependency
- Misunderstand notional vs. marginal return
We’ve carefully designed our new backtester to solve each of these issues.
Using inaccurate or unrealistic trade execution prices
Traders often gravitate to the end-of-day closing price of the option as the correct price to use for a backtest. However, we’ve found that these closing prices are not the best representation of the true value of the end-of-day price. Rather, our data shows that 14 minutes before the close is the closest you can get without experiencing deterioration in the quality of the quote. Our backtester uses quotes from 14 minutes before the close data to simulate trades. Slippage assumptions are key for a realistic backtest and ours are based on years of experience. We use a slippage of 75% of bid ask width for single legs all the way to 56% for four leg spreads. Traveling past the mid-price to trade is a reasonable assumption, however, for multi-legged strategies the percent traveled is not as much.
Overfitting the data to create unrealistic returns
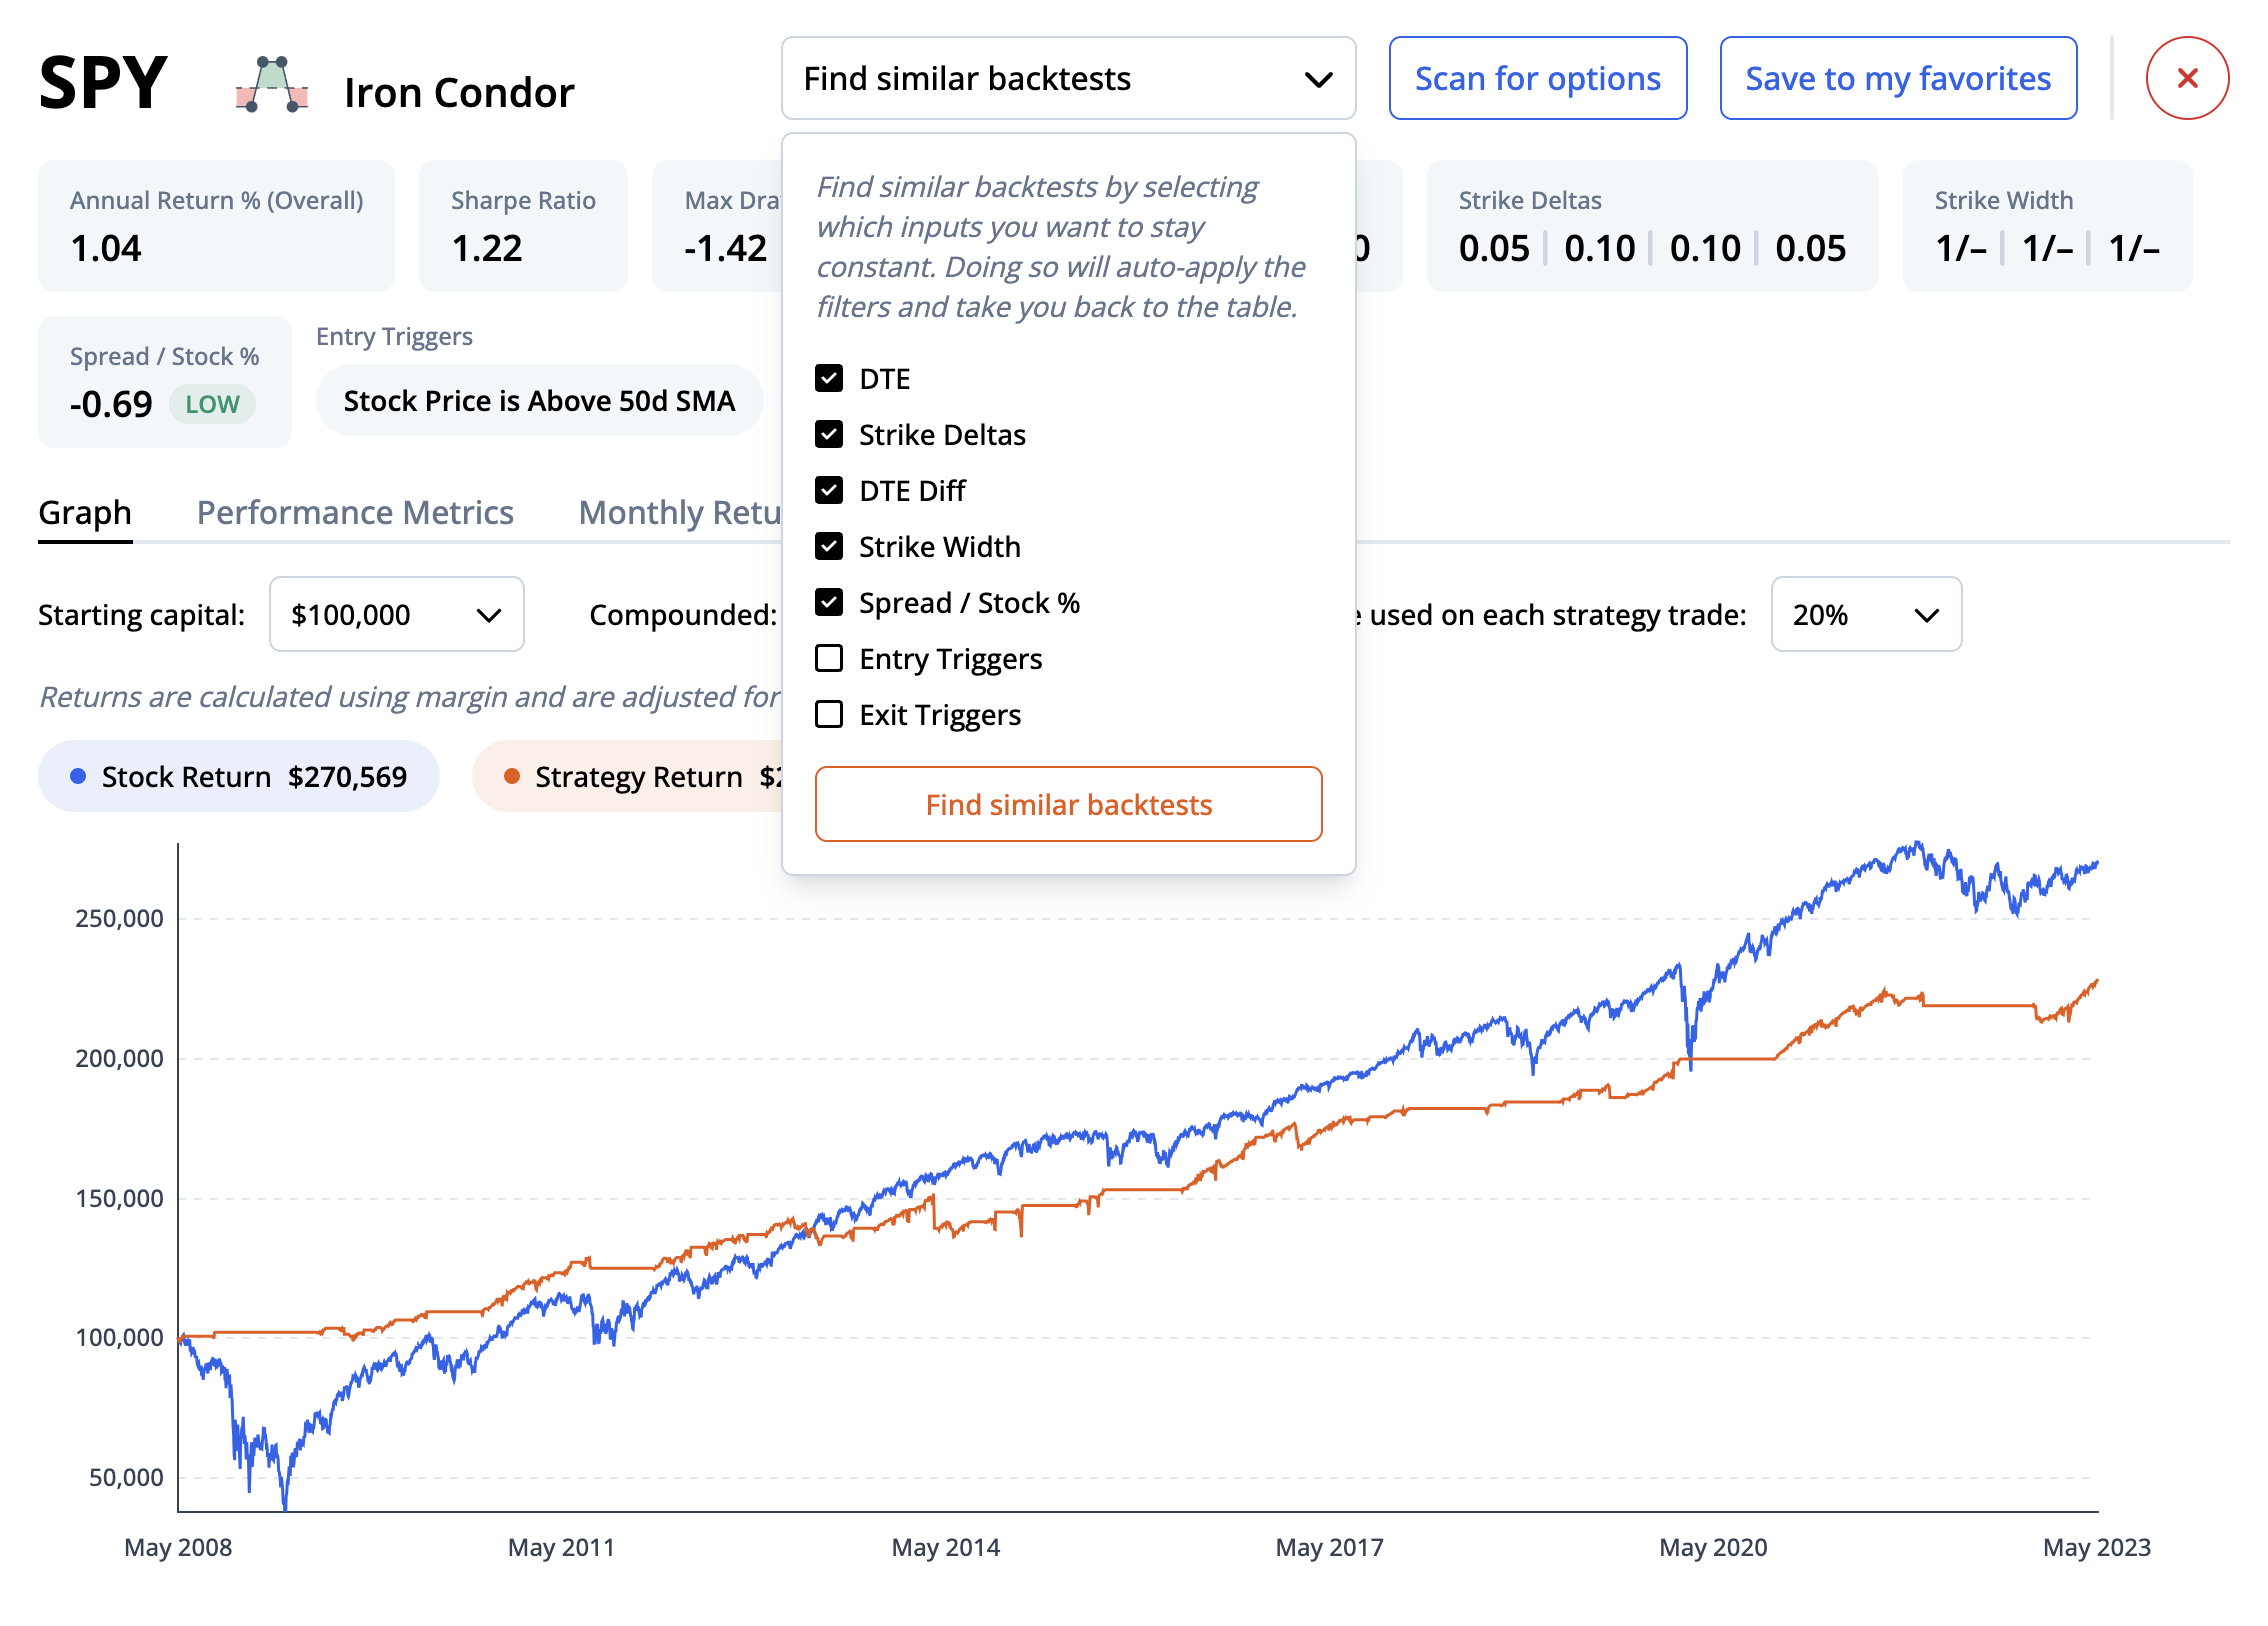
When running multiple backtests on the same data set, there are risks of overfitting. An example would be testing 10 different days to expiration for the same symbol and strategy while varying no other parameters, and then choosing the best performing backtest to trade. Instead, you should look at the other similar backtests to see if they also performed well. Backtests with similar inputs but a wide variety of results is a bad sign. That’s why in our new backtester, we’ve added a “find similar” button to help do this automatically:
Accidentally following path dependency
Path dependency refers to how the order and timing of trades can significantly affect a strategy's performance. Ignoring this aspect can lead to misleading results and unrealistic expectations. Our backtester tool takes into account path dependency in a unique way, by only putting on one trade per day, every day it meets the entry criteria. This means you can have 10 trades on at the same time, all entered one day after the previous one. While this isn’t how most people trade in real life, it provides more accurate performance metrics because it eliminates any statistical bias that would occur if you only entered one trade at a time. For example, starting a backtest on the first day of the year might have very different results than starting the backtest a few weeks later.
Misunderstanding notional vs. marginal return
Notional and margin returns are both crucial elements for assessing the profitability and efficiency of a strategy. By understanding how these returns work, investors and traders can make informed decisions when it comes to selecting the strategies that are right for them.
In options trading, the notional value of an option refers to the value of the shares controlled if the option were to either expire or be exercised or assigned. For example, if I buy a $5 call option on a $100 stock, because this option controls 100 shares of the underlying, the notional value of the trade would be 100 * $100 = $10,000. However, I would only need to pay $5 * 100 = $500 to open this trade. Thus, the notional return measure the performance relative to the $10,000, while the margin return measures the performance relative to the $500.
It’s easy to see that notional returns are much lower than margin returns. We use notional returns in the backtester because it helps standardize and normalize performance across all different types of strategies and symbols. We show the margin return to highlight how efficiently the strategy used the capital at its disposal. However, you have to be careful with margin returns, as sometimes they are not the most accurate reflection of a real-world trading environment.
Generally, if an investor is using options and stocks, or if you want to normalize and compare disparate trading strategies, the notional calculation is best. If you want to see how much you would make on the amount at risk from a brokerage firms perspective the margin returns are best to use. Brokerage firm’s margin do not always present the actual risk, so care needs to be used. For example, a short put may require 20% margin in portfolio margined accounts or 100% margin in cash accounts. The margin returns would be significantly different in either approaches.
At ORATS, we show margin returns but have more data on notional returns because they are more conservative and consistent and allow better comparisons between backtests.
Creating a database of 50 million+ backtests
The pitfalls listed above are only a brief selection of some of the most common situations we see traders deal with when backtesting options. ORATS was inspired to create an even easier, faster, and more effective way to backtest that incorporates not only solutions to the above, but changes how you think about backtesting entirely.
Our original custom backtester has been around for over five years. We threw in every feature we could dream of, which made for a highly functional but overly complex product. We wanted to build a new backtester that was ultra-fast, easy to use, and still provided traders with just as much value as the original. While at a team retreat in Florida in early 2023, we had an idea. What if instead of requiring you to input a bunch of parameters and run your own backtest, we did it for you. You would simply query a database of backtests (that already exist) for one that meets your investment objective. This would get you to the same result as before, but without the hassle, time commitment, and inevitable errors that were a part of creating your own backtest.
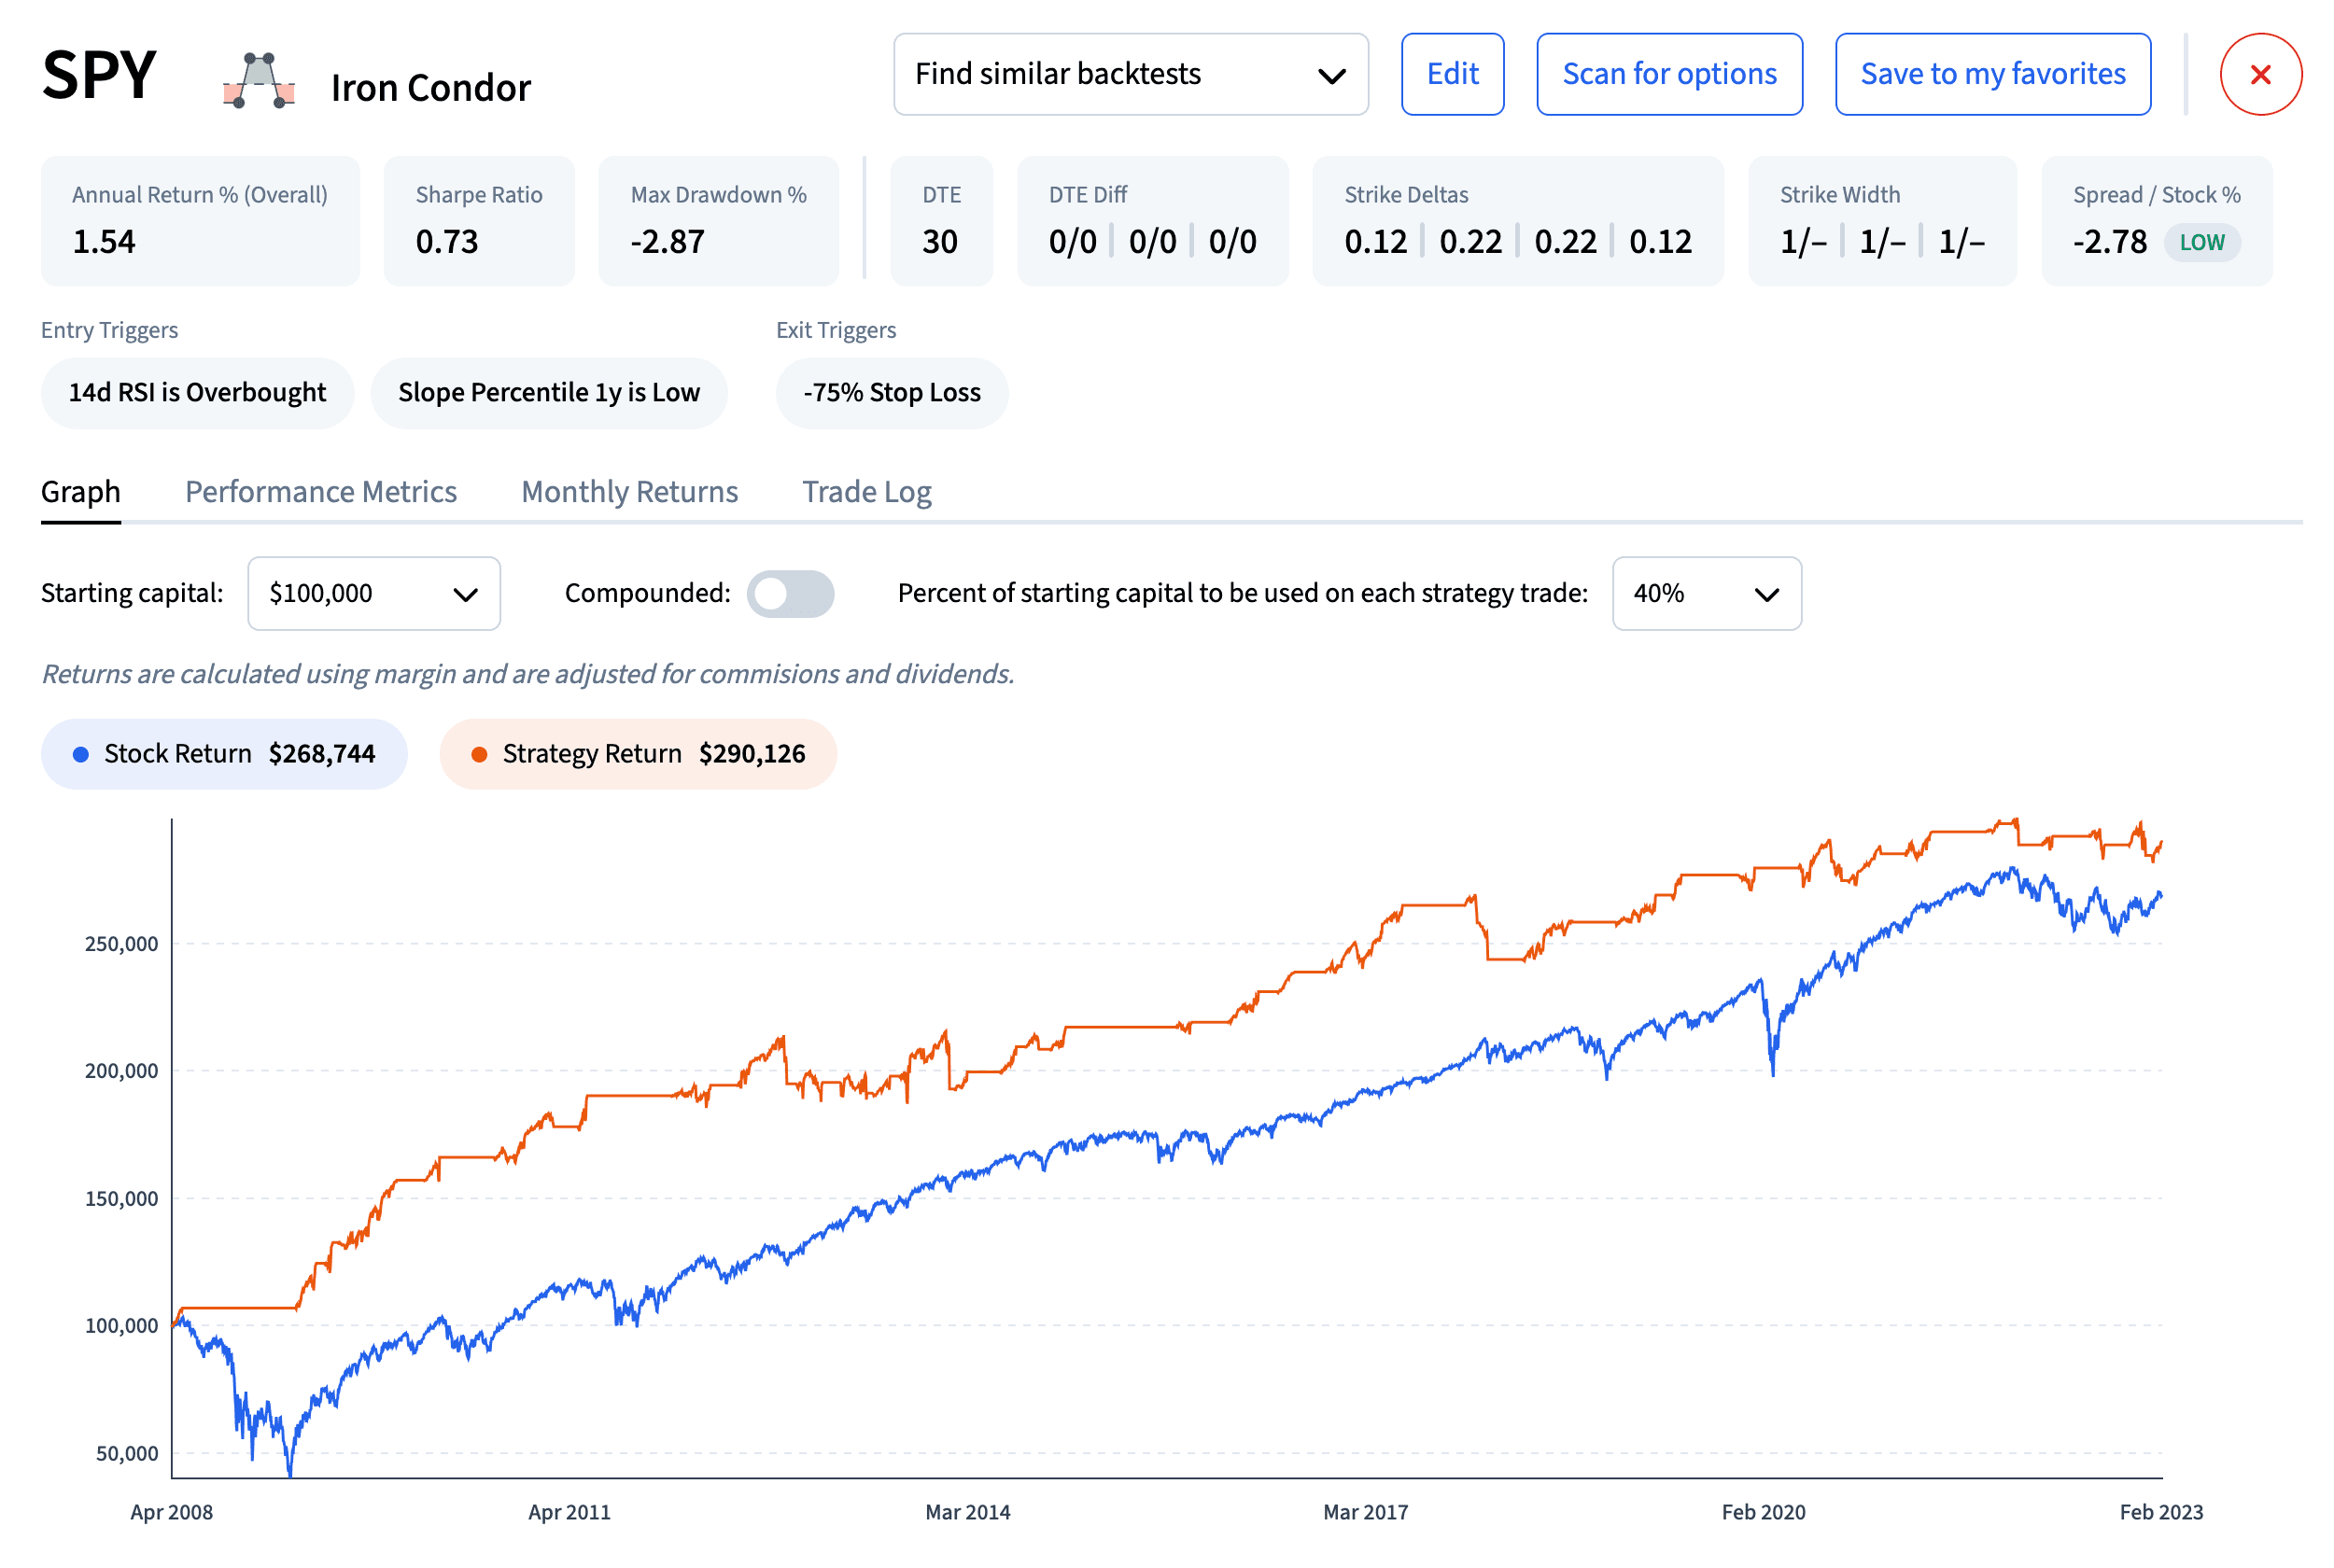
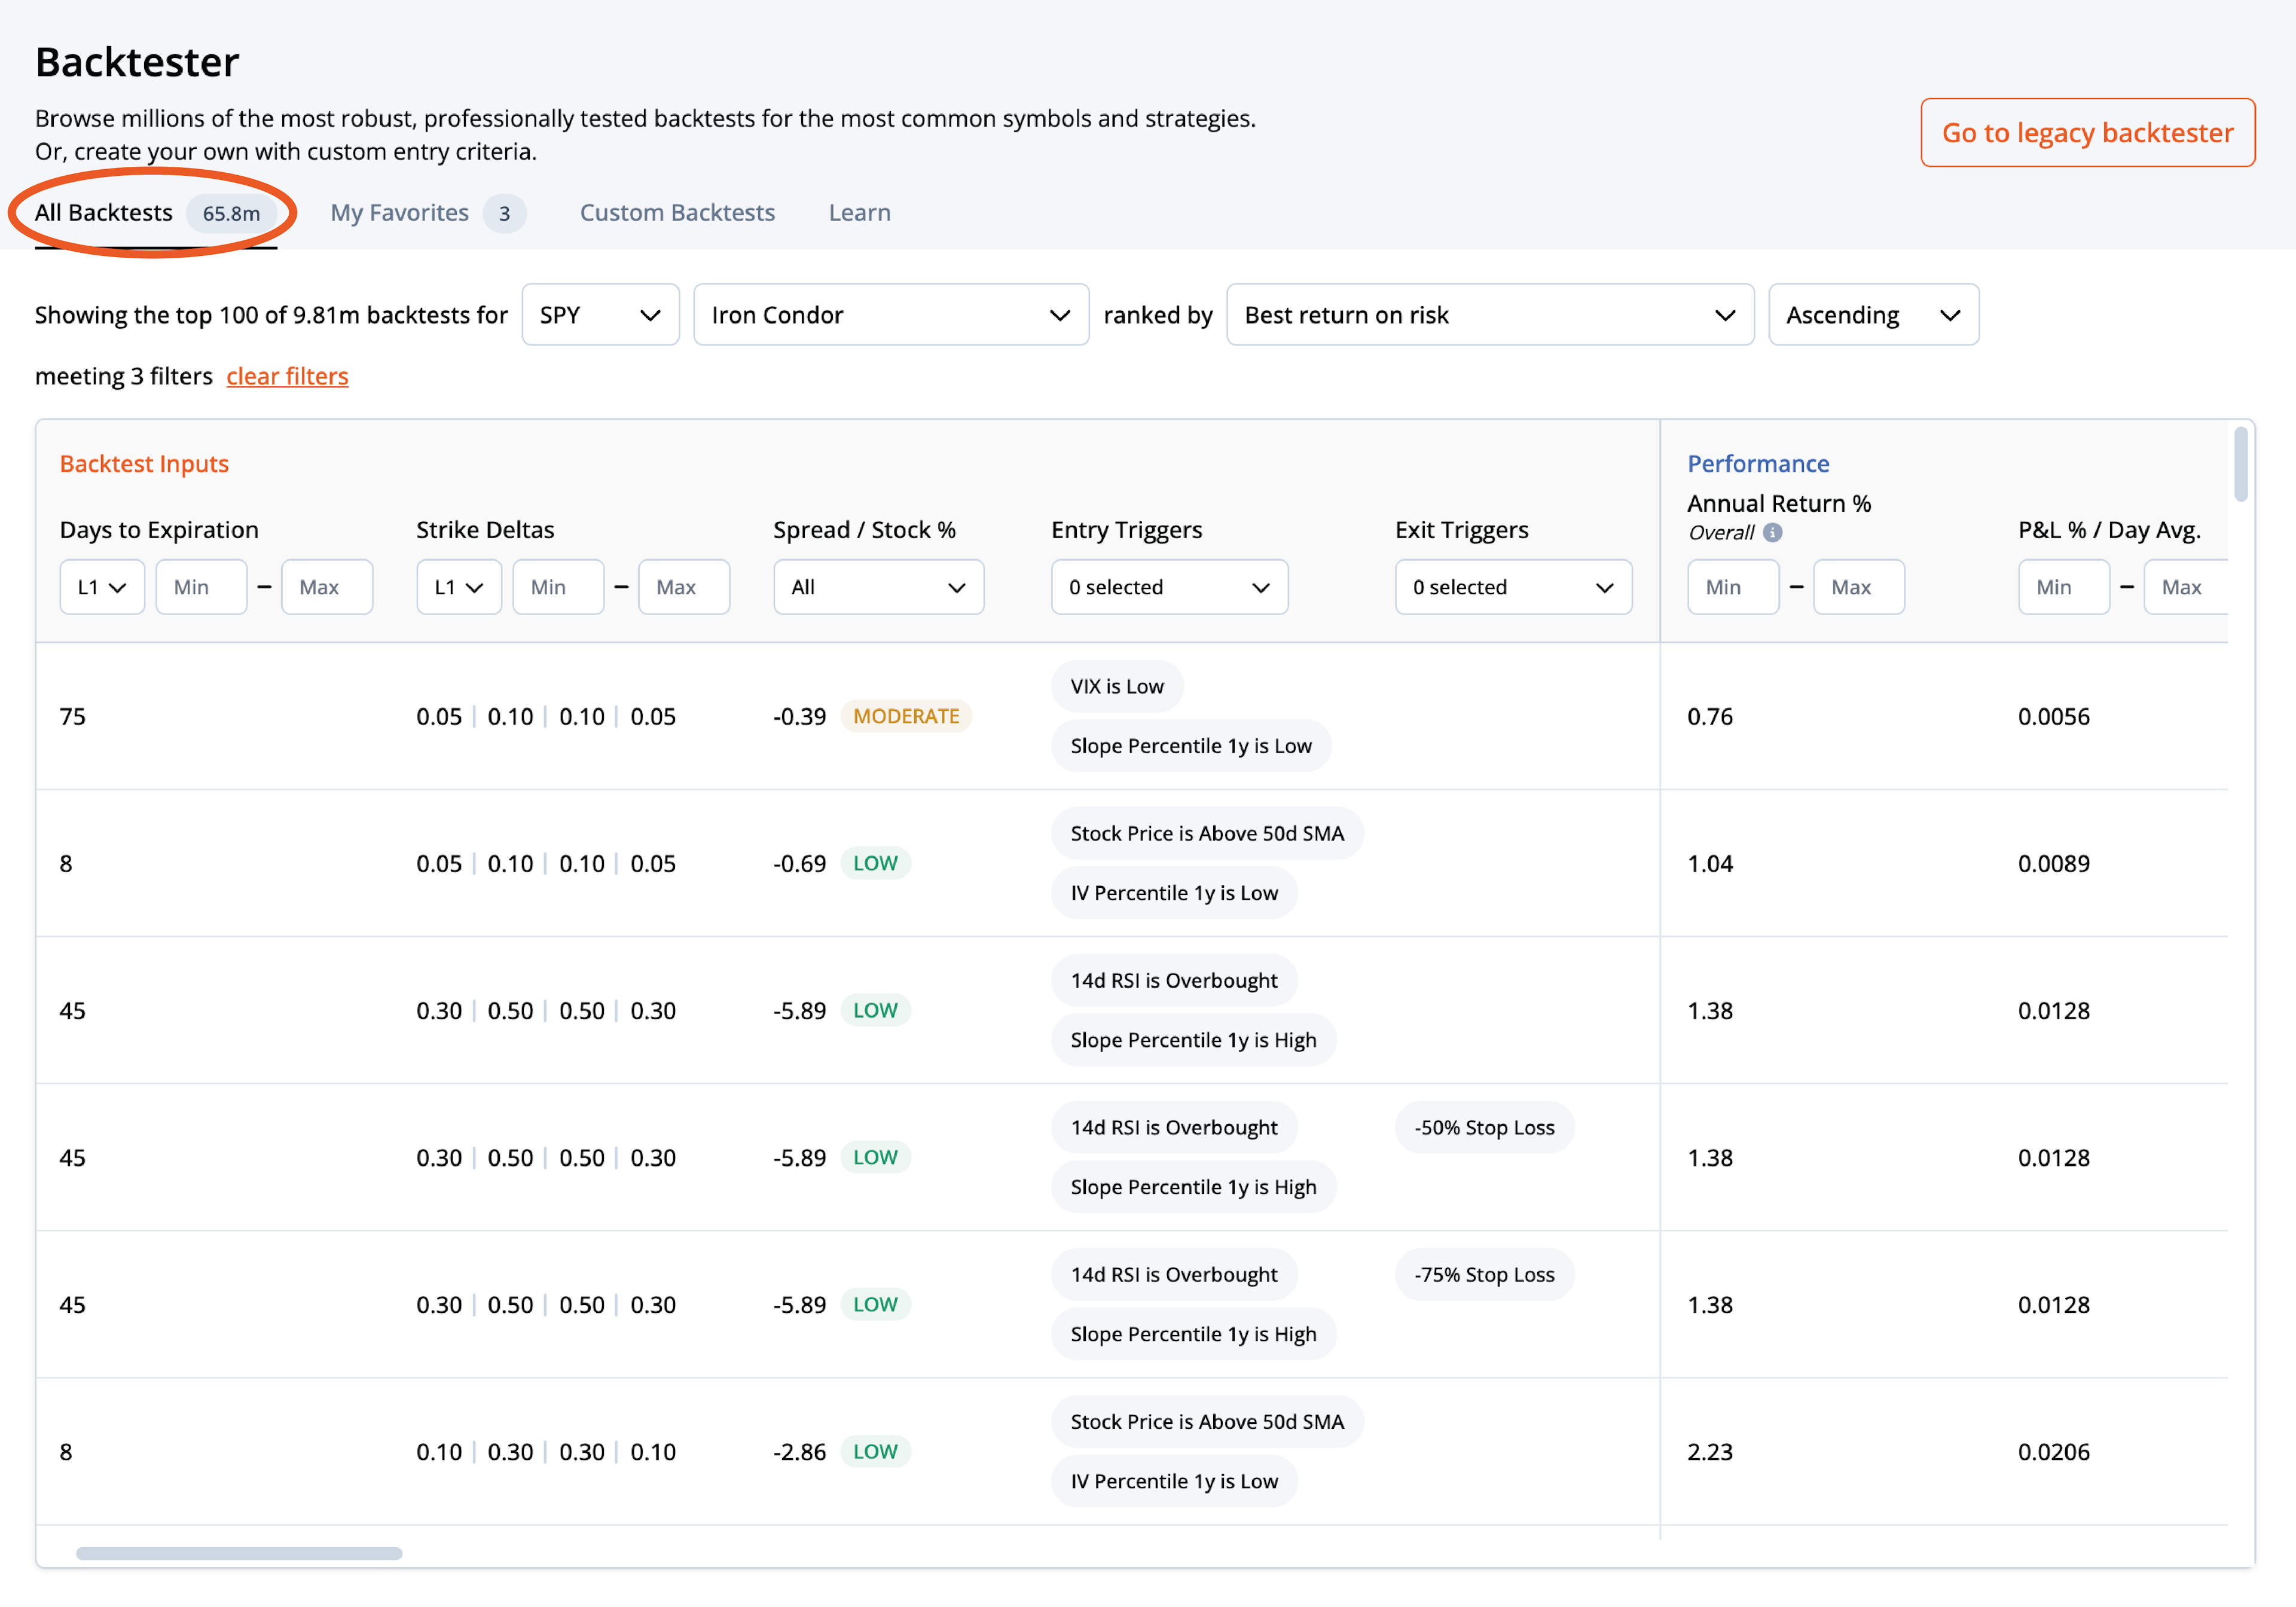
After crunching the numbers, we determined this would mean running millions - if not billions - of backtests, before you even touched the software. This presented a difficult challenge from an engineering standpoint, because we had to figure out how to efficiently store and access all of this data. After a few months, we were ready to launch with a few million backtests for SPY. Now as we’re closing out the year, we have over 50 symbols and over 65 million backtests.
Choosing the right entry and exit criteria
To run millions upon millions of combinations, we needed to choose only the most important entry criteria - days to expiration, strike deltas, and spread / stock % (spread yield), along with five different technical indicators. For exit criteria, this mean testing four different stop losses and seven different profit targets.
Days to Expiration: Days to Expiration (DTE) indicates the remaining time until an option contract expires. Our backtesting tool analyzes strategy performance over a diverse range of DTEs, from as little as 2 days to over 300 days. By evaluating the strategy's performance across different time horizons, traders can gain insights into the ideal periods for executing specific strategies. In the backtester, you can filter down the table of results by specifying DTE min/max for each leg.
Strike Deltas: The strike delta is a measurement of how much an option's price is likely to move with each $1 move in the underlying security. To provide you with a comprehensive view, our backtester tests strategies across a variety of absolute deltas, including in-the-money and out-of-the-money strikes. In addition to single leg strategies, we also test a variety of multi-leg strategies with more complex strike deltas such as vertical spreads and iron condors. Like DTE, you can use the filters in the backtest table to narrow down backtests by the strike delta min/max for each leg of the strategy.

Spread Yield: Spread Yield is a measure of the price paid for the options spread relative to the price of the underlying stock. It's calculated by dividing the price paid for the spread by the stock price. Our backtester categorizes the spread yield target for each backtest as low, moderate, or high, relative to other backtests with comparable DTE and strike deltas. This additional context allows for more informed analysis.
It’s interesting to explore the relationships between different backtest entry criteria and their performance. For example, if you filter down SPY Short Put Spreads by a low VIX entry trigger, and rank them by best overall performance, you’ll see that the spread / stock is almost always low. This shows that in a low volatility environment, this strategy performed better as you targeted a lower spread yield.
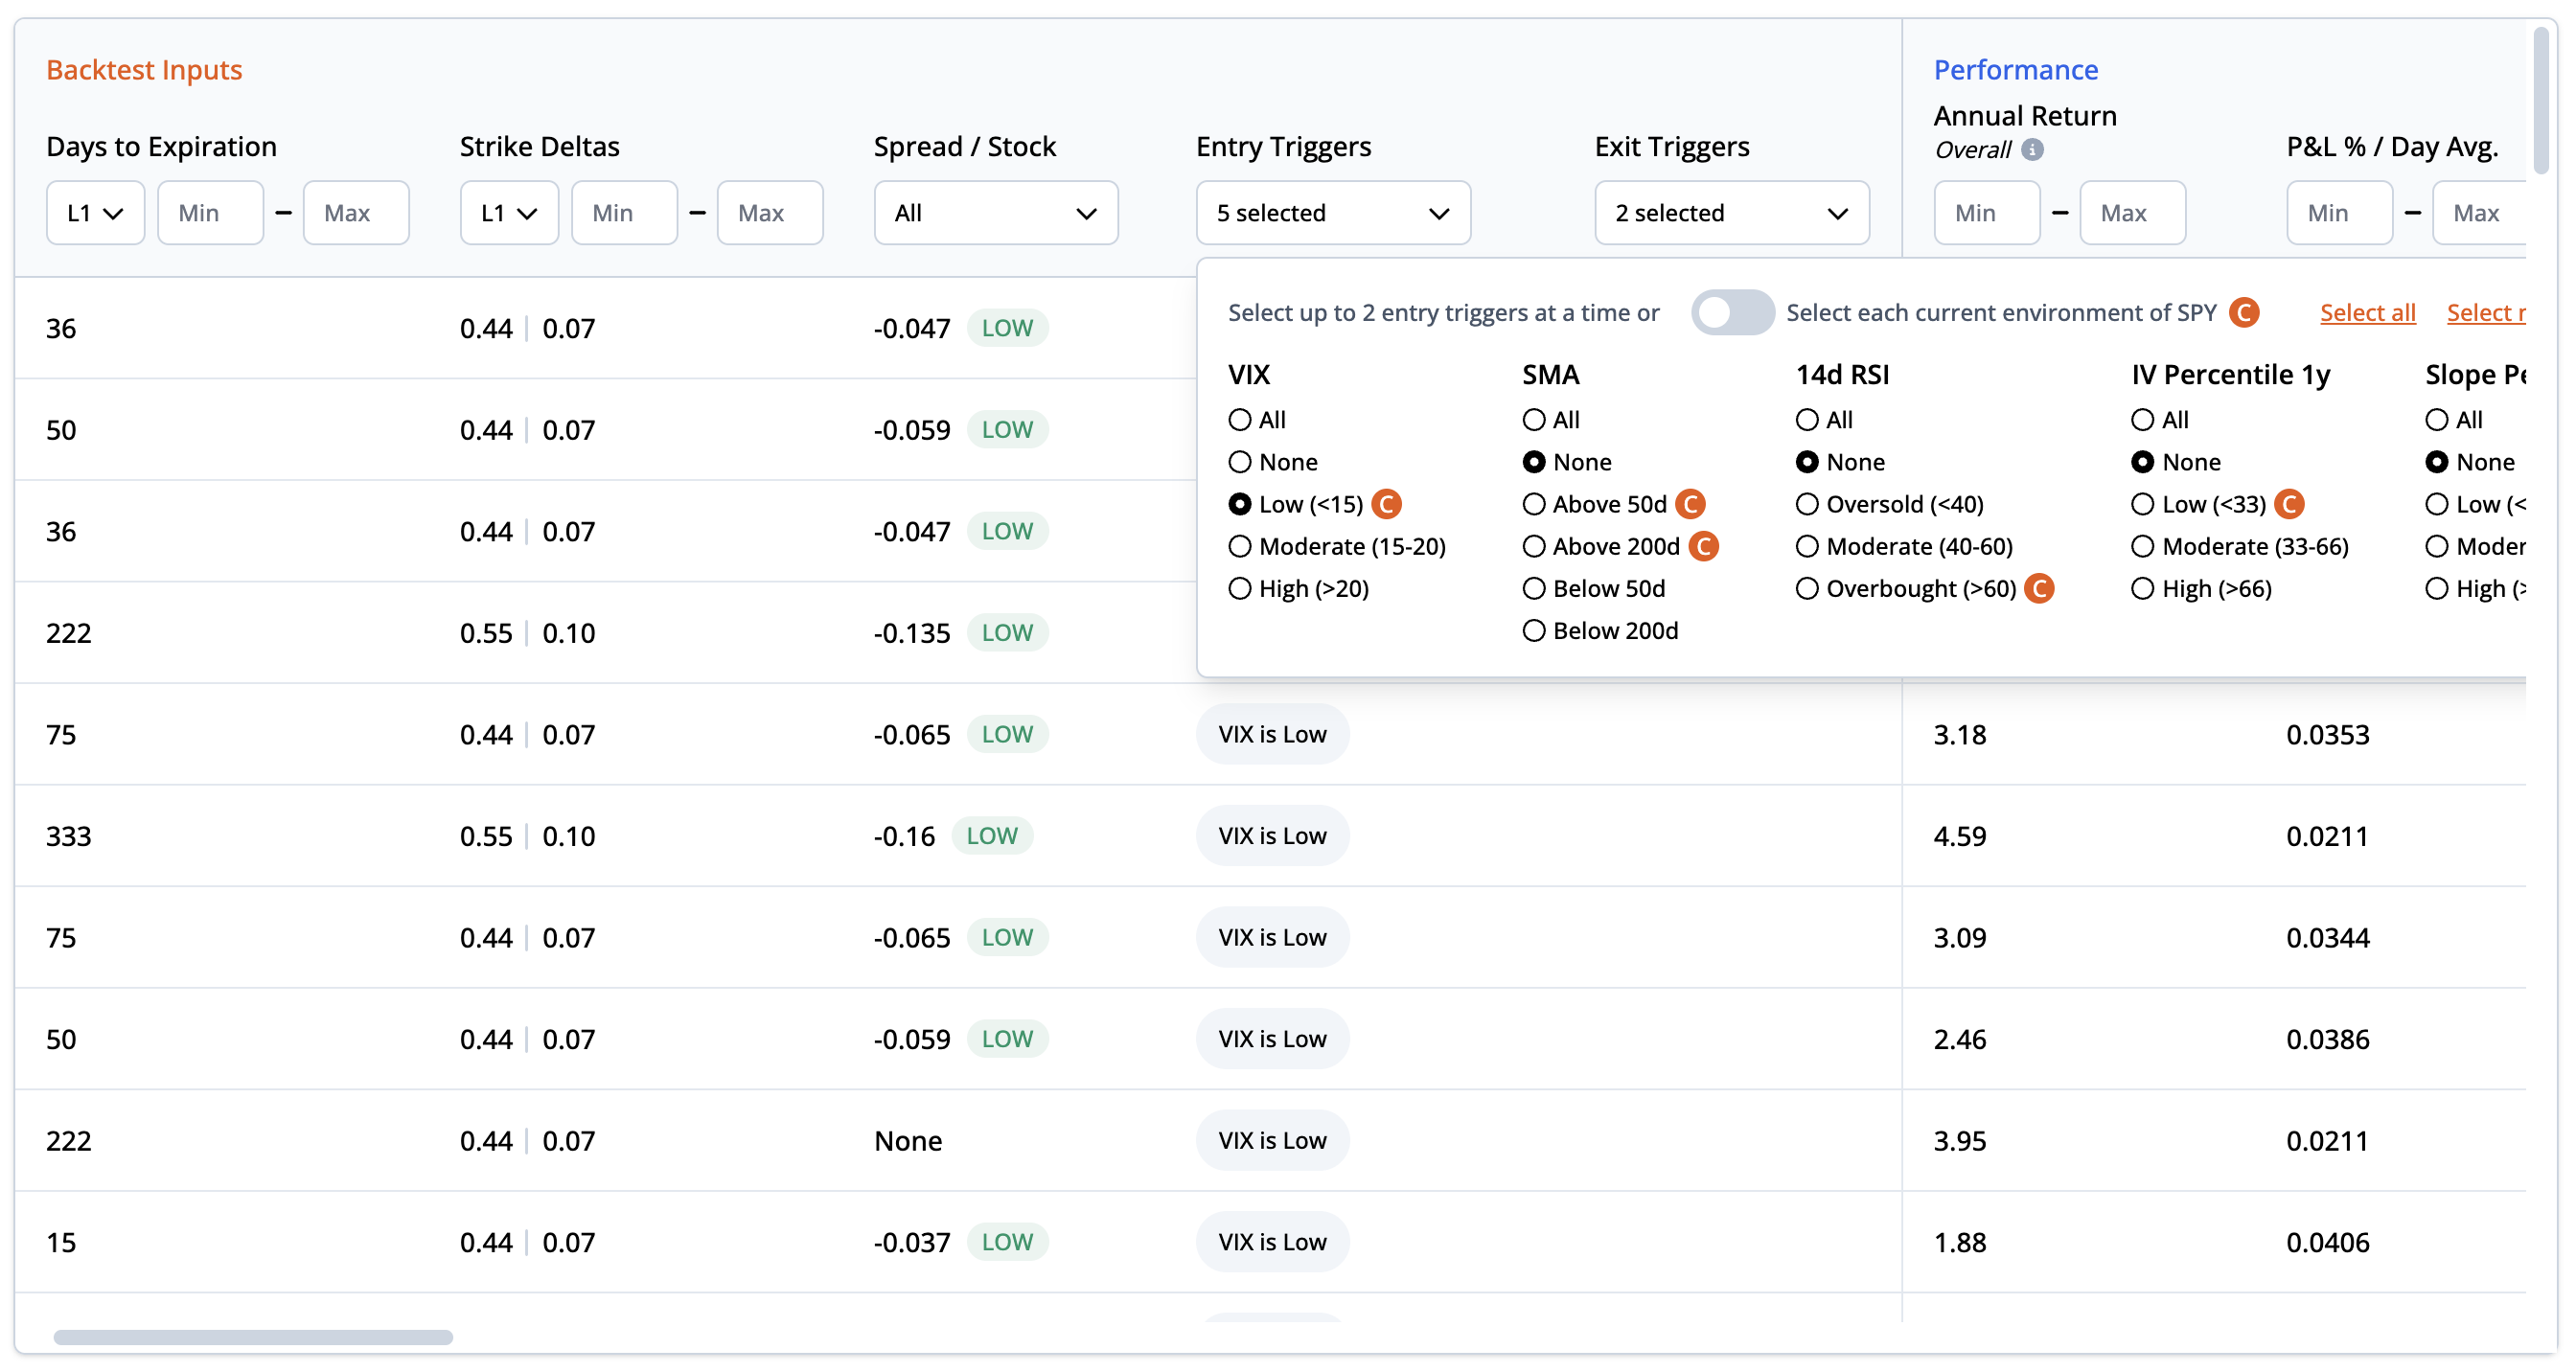
Technical Indicators: Technical indicators can provide guidance on when to enter a trade. We’ve added five different technical indicators to be used as entry triggers in the backtester:
- VIX Price: The VIX, or volatility index, reflects the market's expectation of 30-day forward-looking volatility. Low VIX levels (<15) suggest a calm market, moderate levels (15-20) indicate normal volatility, while high levels (>20) imply increased uncertainty.
- Simple Moving Average (SMA): SMA is a commonly used technical indicator that smoothes out price data to capture trends over specific periods. Our backtester tests if the price is above or below the 50 or 200-day SMA.
- 14d RSI: The 14-day Relative Strength Index (RSI) is a momentum oscillator that measures the speed and change of price movements. A reading of less than 40 indicates oversold conditions, 40-60 suggests moderate momentum, and above 60 signals overbought conditions.
- IV Percentile 1 Year: The IV percentile shows where the current implied volatility of the underlying stands relative to its 1-year range. It's categorized as low (<33), moderate (33-66), or high (>66).
- Slope Percentile 1 Year: This trigger shows where the current slope of the implied volatility skew stands relative to its 1-year range, categorized as low (<33), moderate (33-66), or high (>66).
For each of these entry triggers, one of the levels is always the “current environment”. This is denoted by the orange “C” next to the corresponding level. For example, if the 14d RSI is currently overbought, an orange “C” will appear next to the overbought trigger. This information is very helpful when trying to find a trade to put on immediately, because you can filter down the backtests that performed well in the current environment. You can also toggle on “Select each current environment of [ticker]” and the table will only show backtests that have been tested with any combination of the current environment entry triggers.
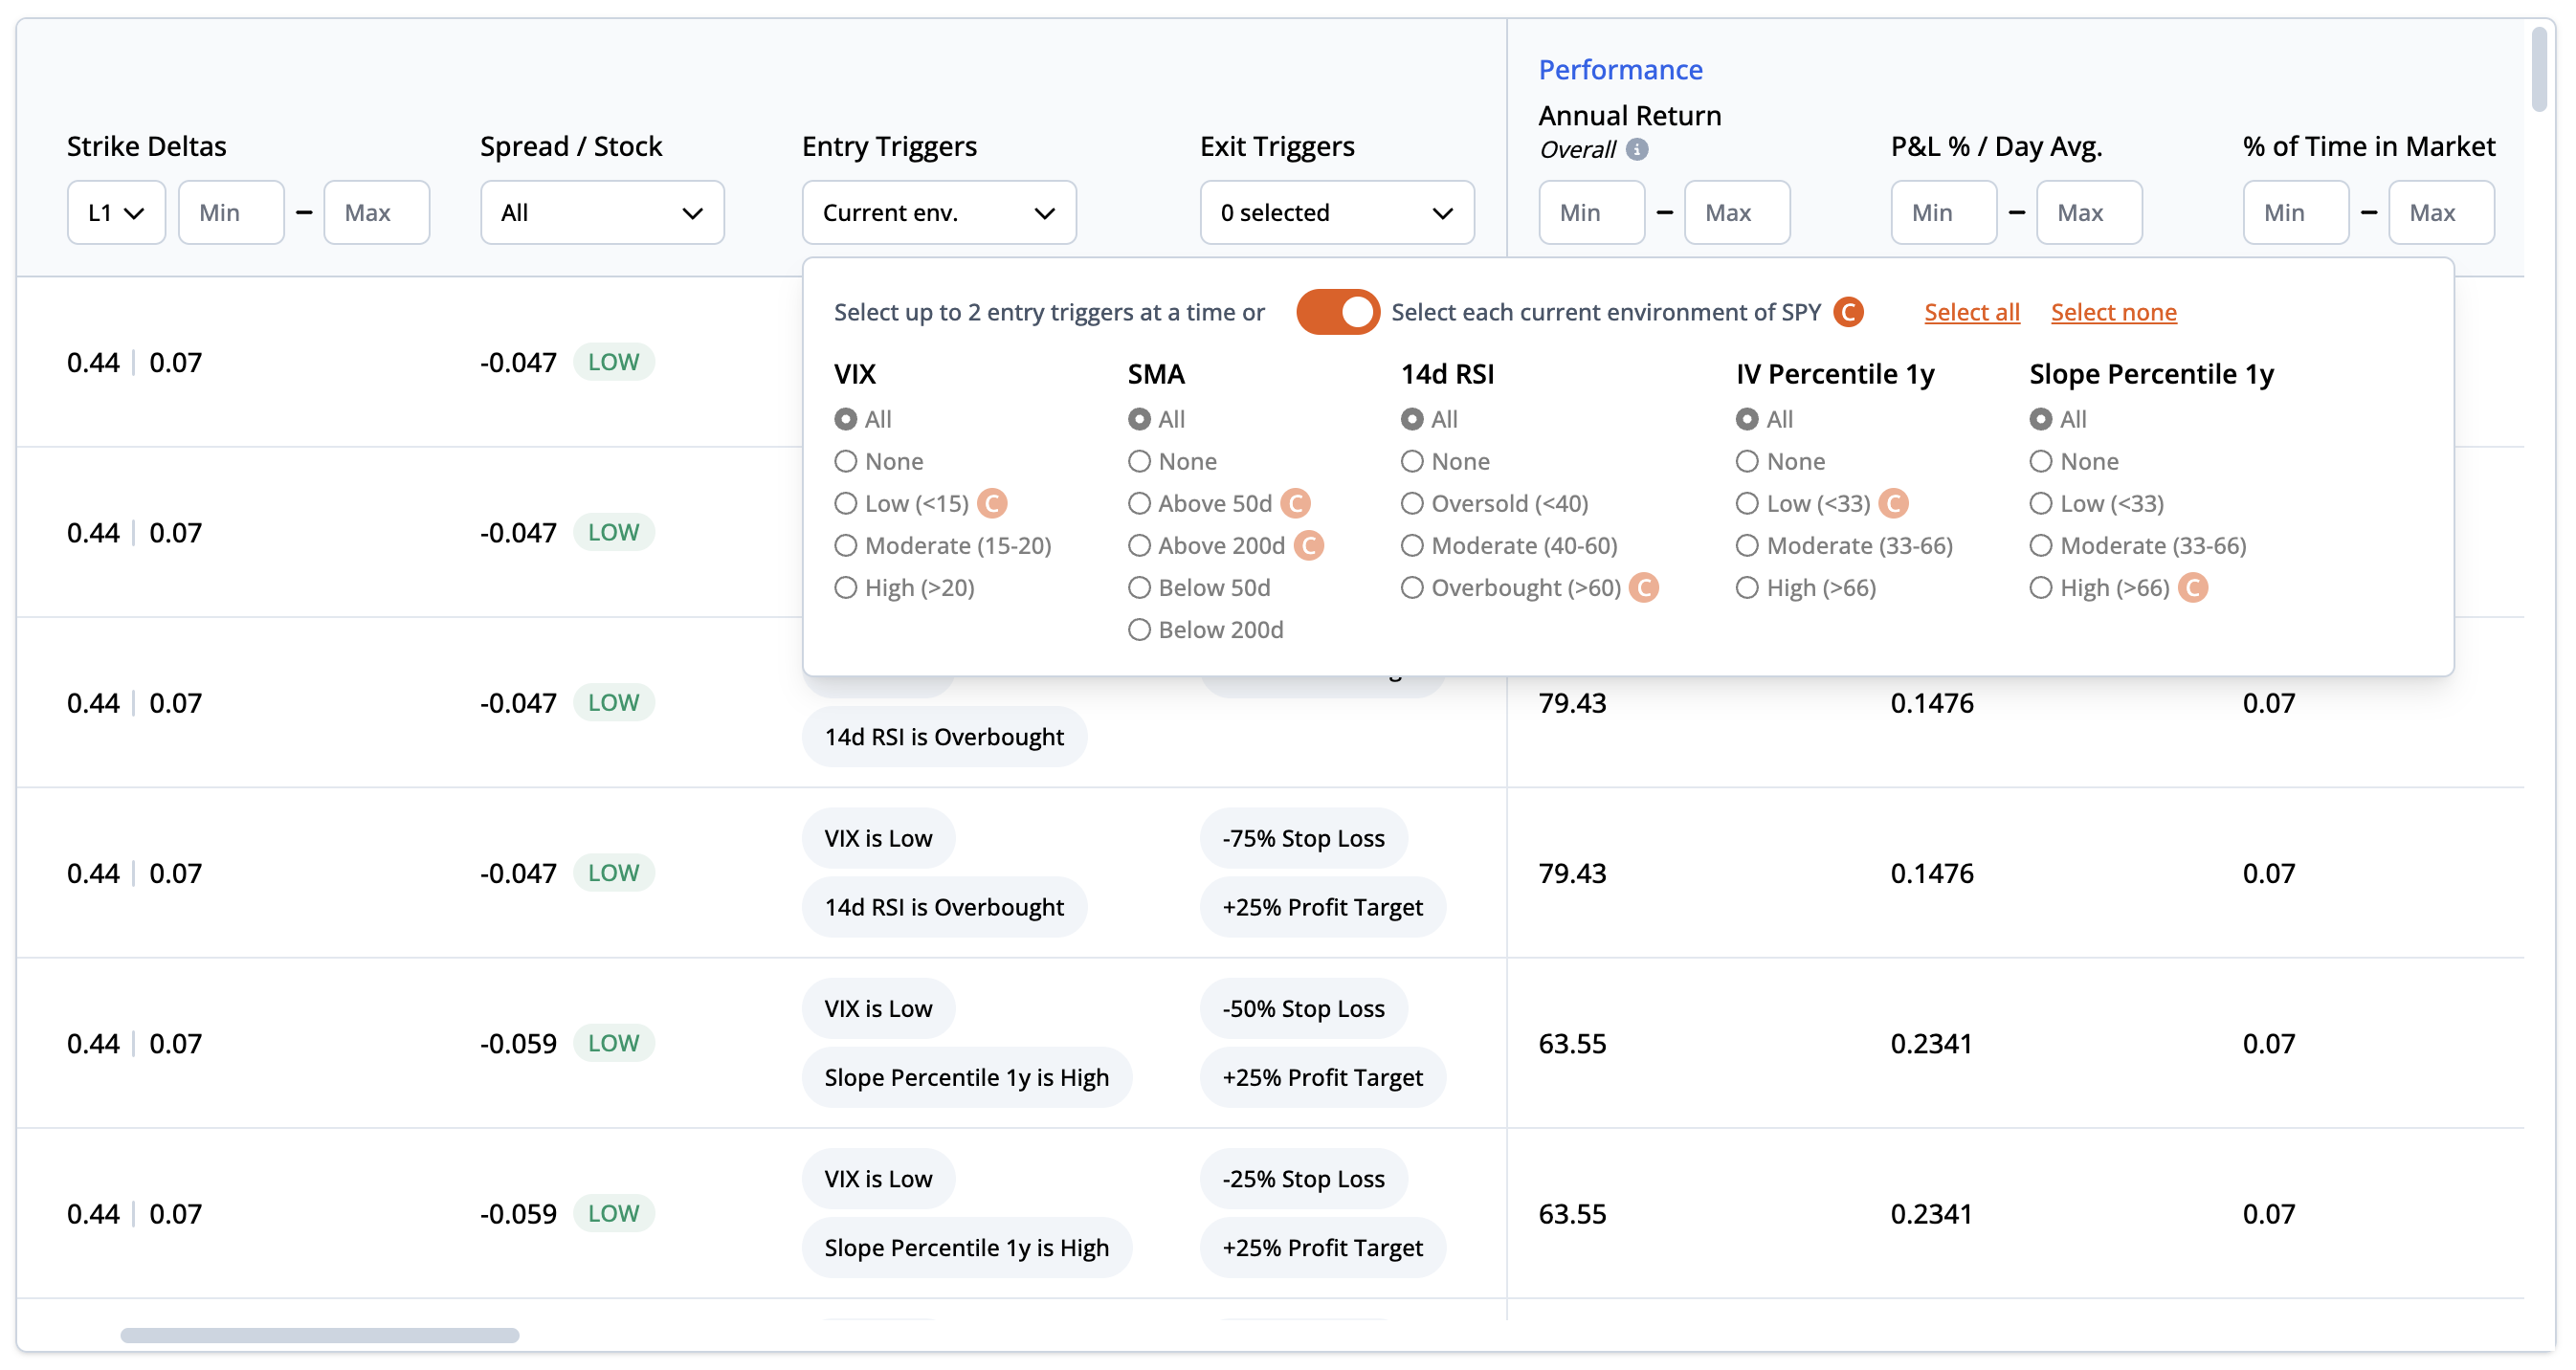
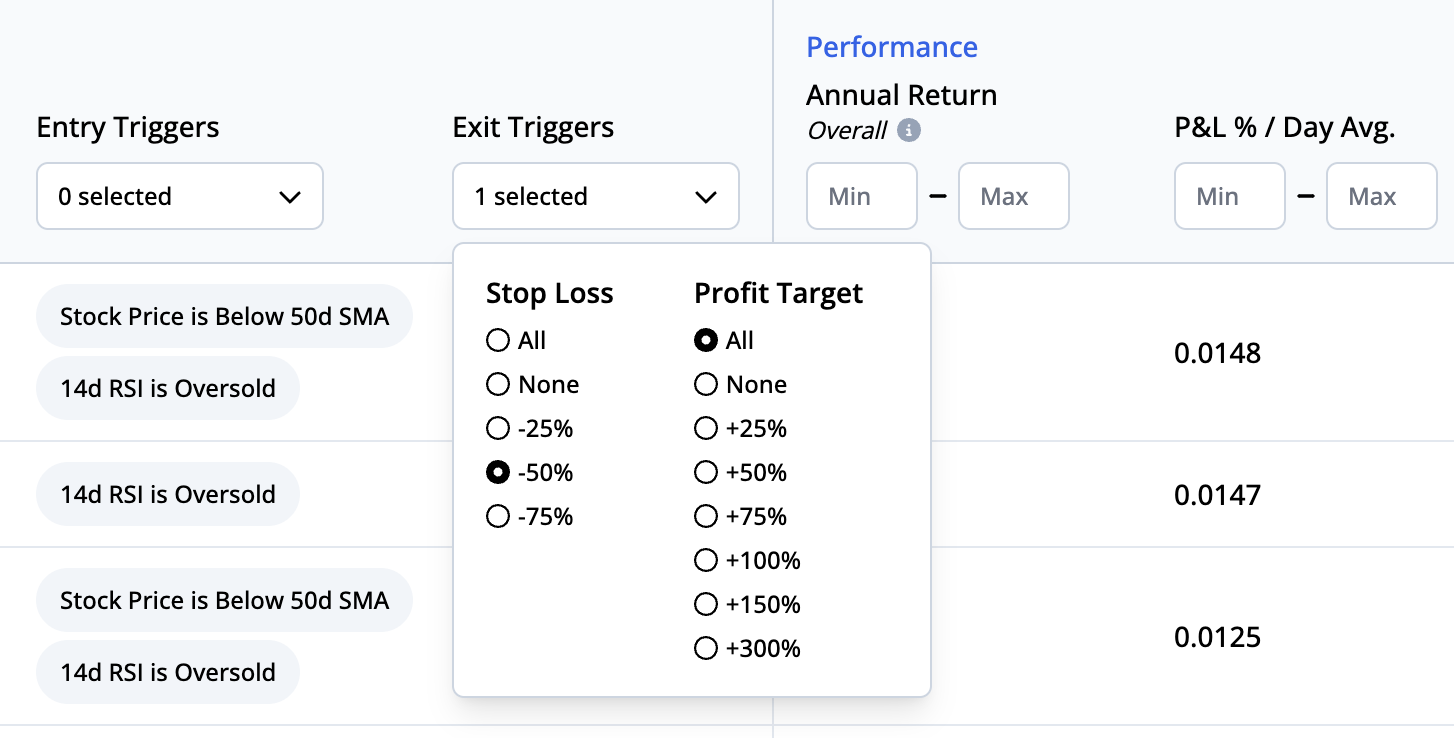
Exit Criteria: Exit triggers play a crucial role in risk management and profit protection. We test stop loss levels of -25%, -50%, and -75% to protect from excessive losses. For locking in profits, we test profit targets of +25%, +50%, +75%, +100% (if debit strategy), +150% (if debit strategy), and +300% (if debit strategy). Like all other entry criteria and triggers, you can filter the table down to backtests that only test a specific stop loss or profit target.
Measuring performance
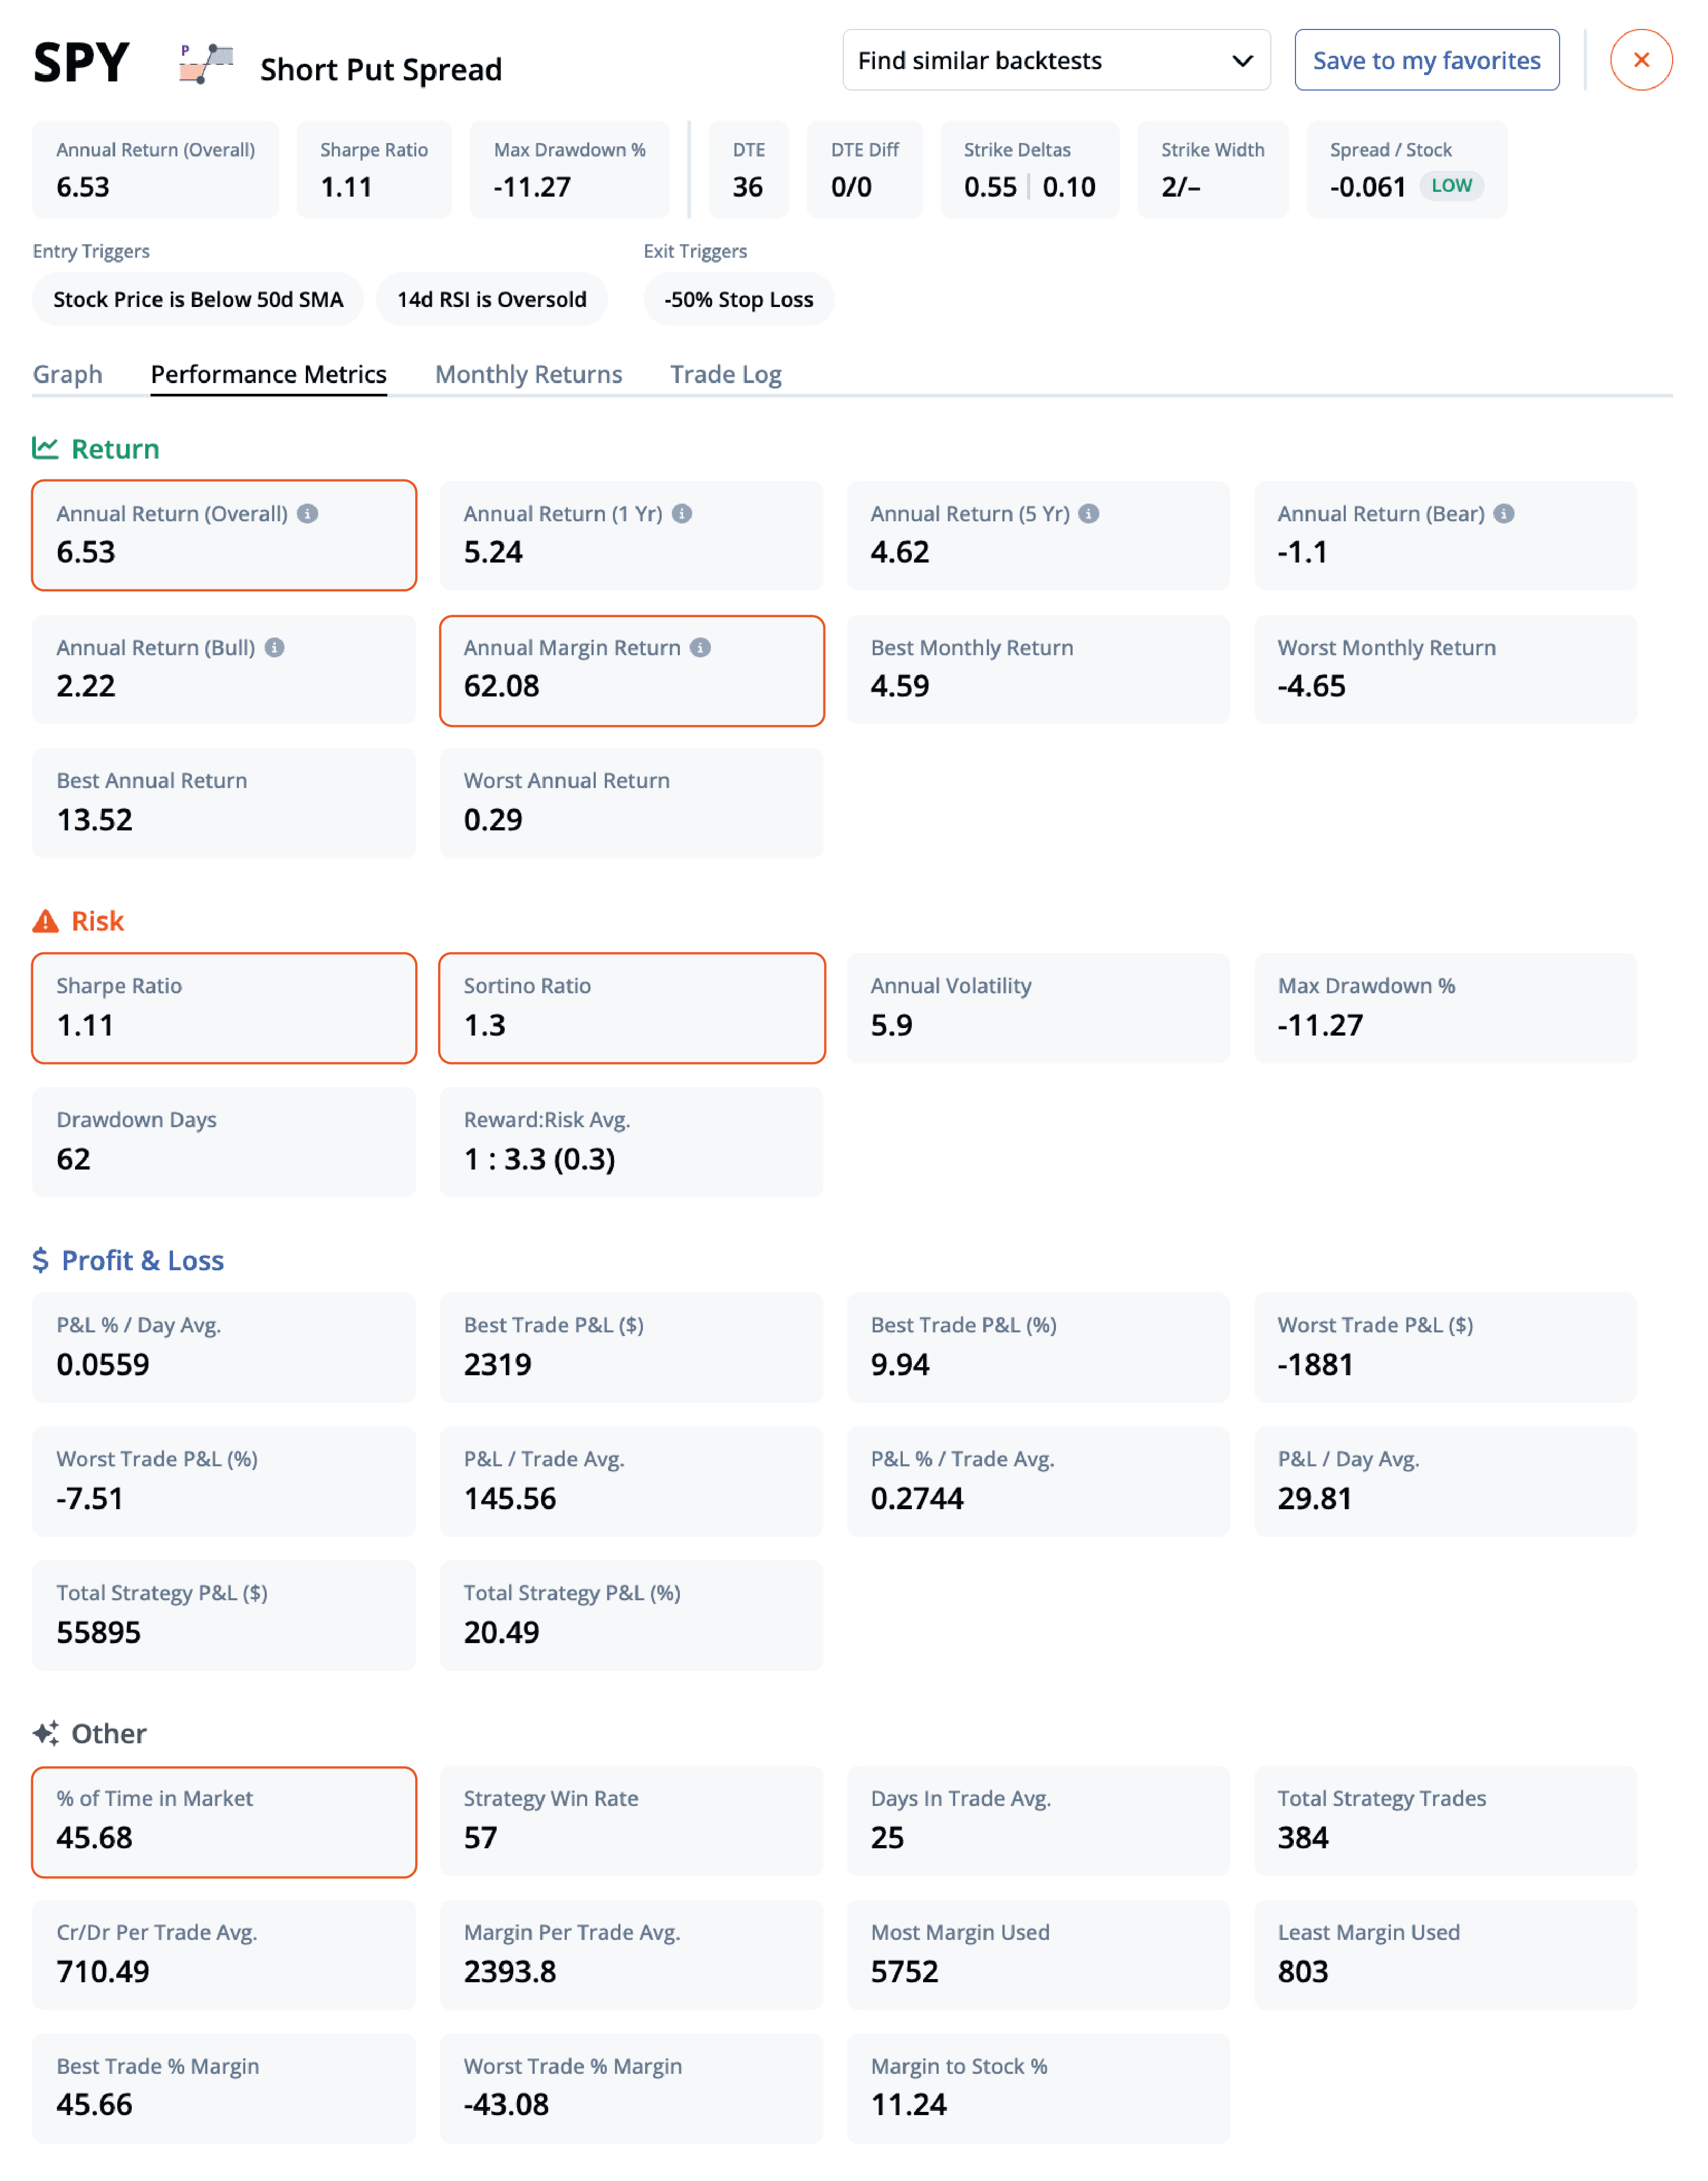
It’s important to measure the right performance metrics when backtesting, otherwise you’ll end up with a lot of data and no idea what to do with it. Before diving into the specifics, let's outline the four categories of performance metrics you'll find in our backtester: Return, Risk, Profit & Loss, and Others.
Return: Metrics such as annual returns (overall, 1 year, 5 years, bearish and bullish markets), annual margin return, and best/worst monthly and annual returns.
Risk: Quantitative measurements such as Sharpe Ratio, Sortino Ratio, Annual Volatility, Max Drawdown %, Drawdown Days, and Reward to Risk Average.
Profit & Loss: Comprehensive data like average P&L % per day, best and worst trade P&L (both in dollar and percentage), average P&L per trade and per day, and total strategy P&L.
Others: Metrics including % of time in the market, strategy win rate, average days in trade, total strategy trades, credit/debit per trade average, margin per trade average, and margin to stock %.
Let's dive deeper into some critical metrics.

Notional vs. margin return
As mentioned earlier, it’s important to look at both notional and margin return because they are useful for different purposes. Notional return helps standardize performance when comparing across different symbols and strategies, while margin return helps you identify how efficiently your capital was used. Both are available in the performance metrics.
Sharpe vs. Sortino ratio
Our backtester also shows both Sharpe and Sortino ratios for each strategy. While they might seem similar at first, each ratio offers a distinct perspective on risk and should be understood separately.
The Sharpe ratio gauges how much excess return a strategy provides relative to the risk taken, using standard deviation as a proxy for risk. It's excellent for understanding a strategy's overall risk-adjusted return, but it falls short in one critical area – it doesn't distinguish between upside and downside volatility.
That's where the Sortino ratio comes in. The Sortino ratio, like the Sharpe ratio, evaluates risk-adjusted return, but it only considers downside volatility. In doing so, it addresses an important asymmetry in trading – traders generally welcome upside volatility while fearing its downside counterpart. A high Sortino ratio signals that a strategy minimizes damaging losses while potentially capitalizing on desirable volatility. By providing both these ratios, our backtester allows traders to examine a strategy's return through multiple risk perspectives.
Filtering percent of time in market
Filtering by the percent of time in market is an important feature of our backtester, mainly to reduce overfitting. By setting a minimum filter, you can focus on backtests with a statistically sound number of market days.
Imagine two strategies: Strategy A has been in the market for 300 days, and Strategy B for only 30 days. While Strategy B might show an impressive return for its short time, its performance metrics might be unreliable due to the small sample size. Our tool allows you to filter out such strategies, preventing overfitting and enabling a more robust evaluation of the strategies' true performance. Like percent of time in market, you can apply filters to other metrics such as drawdown days, total strategy trades, and margin to stock % to fine-tune your risk tolerance and trading preferences.
Profit and loss metrics
We calculate various measures of profit and loss to provide a comprehensive view of a strategy's performance. The best and worst trade p&l metrics make it easy to quantify your upside potential versus the downside risk of the strategy. Sometimes it’s good to filter the table based on p&l percent per day, as that can be a good baseline for an effective strategy.
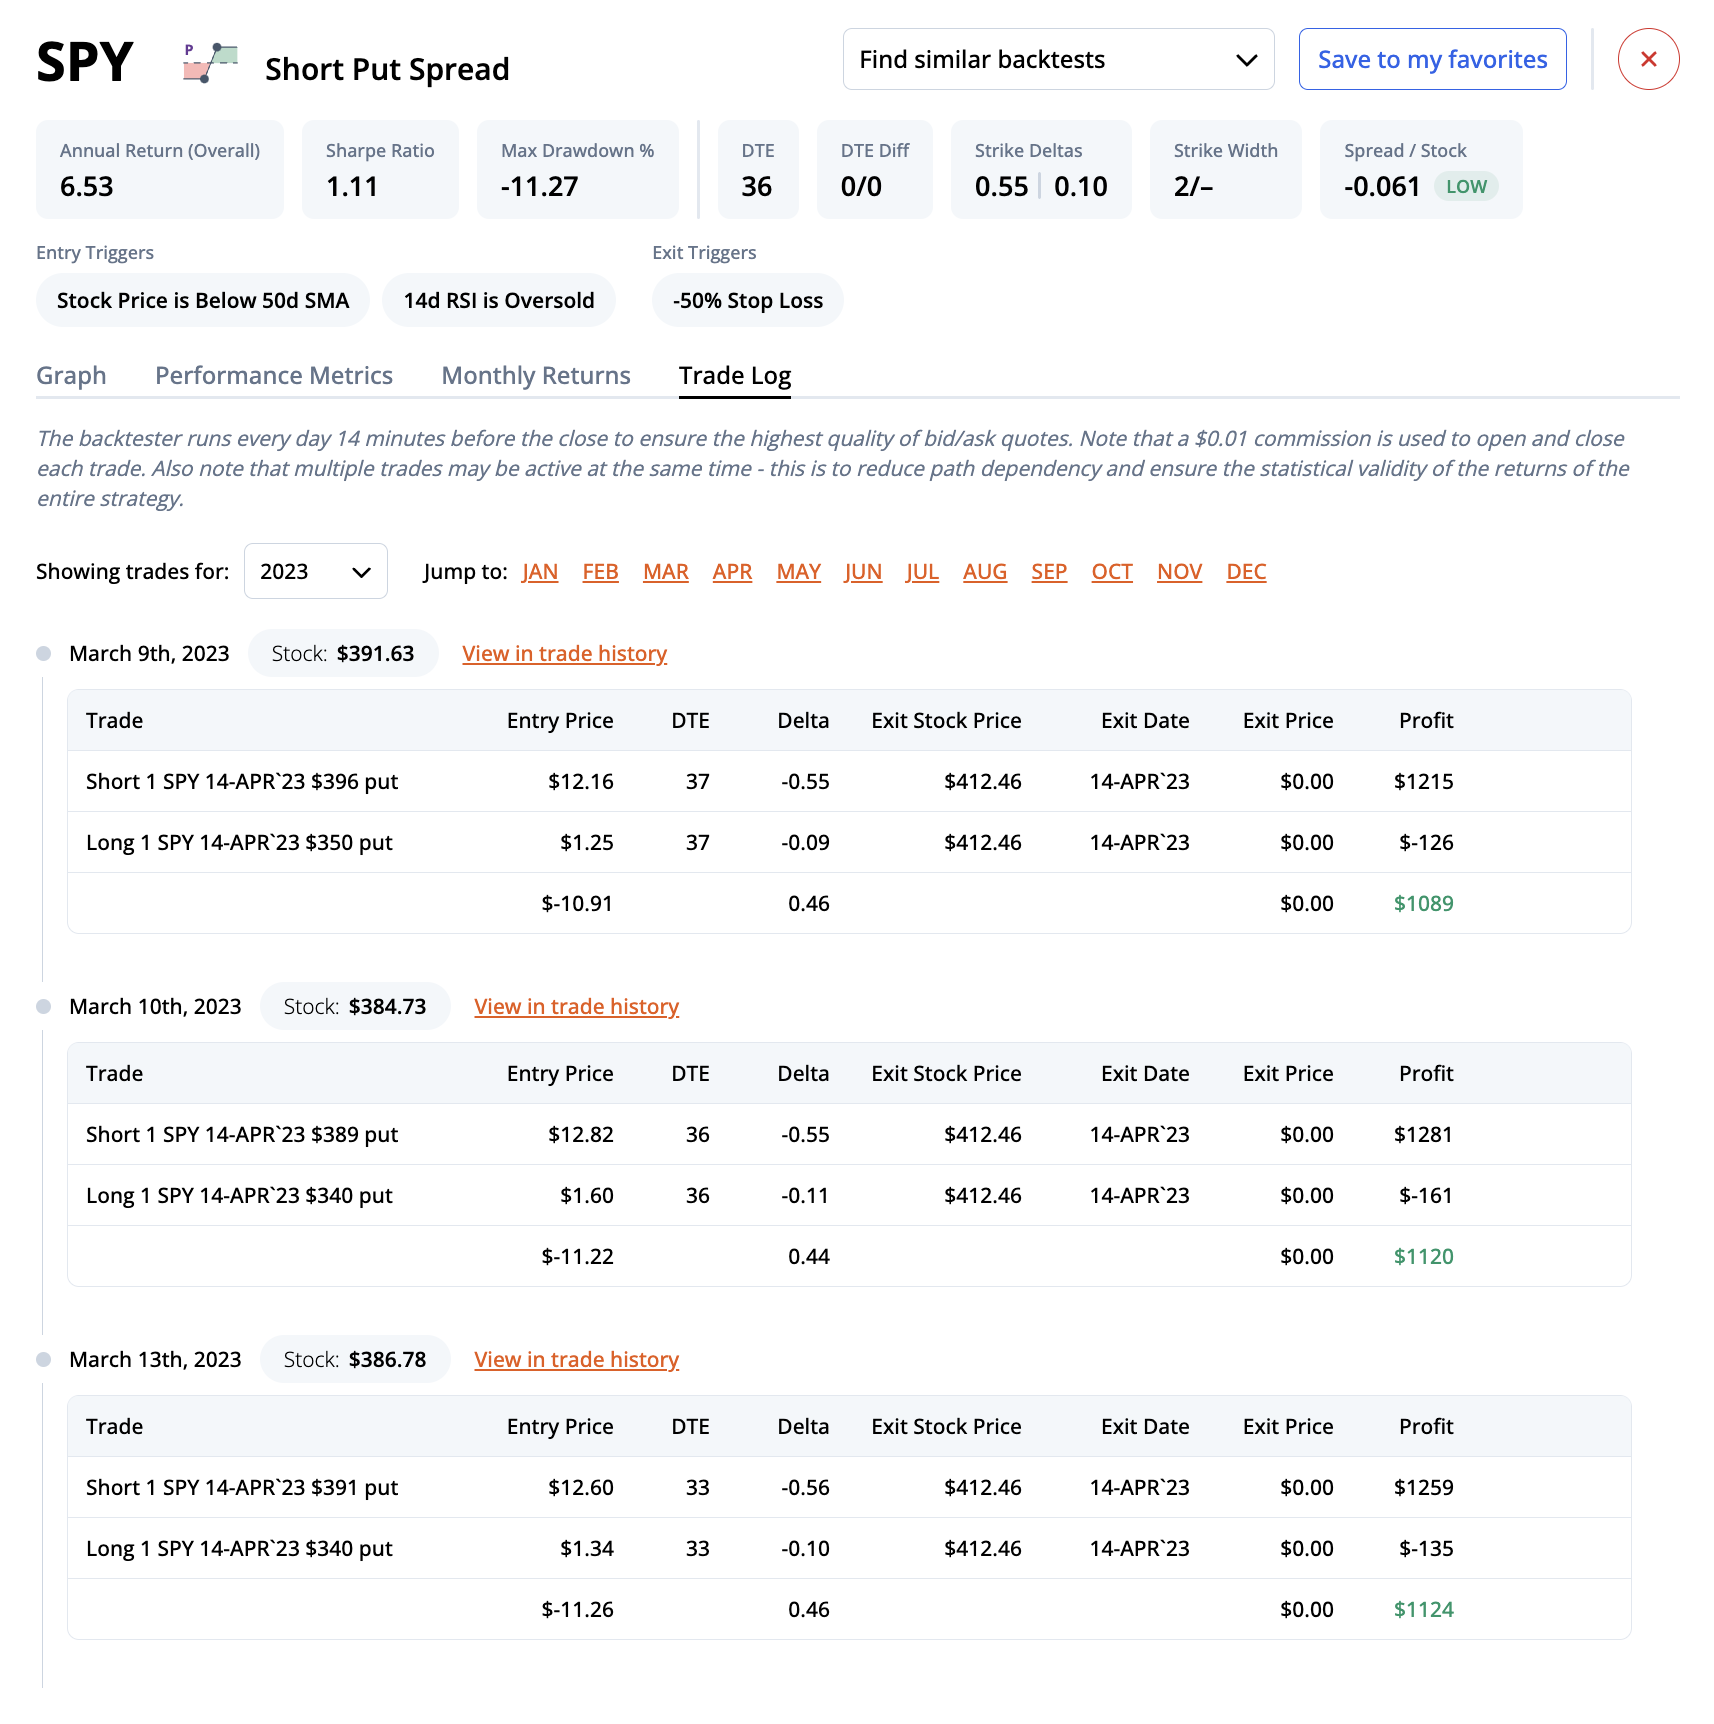
Below you can see the trade log for a short put strategy on SPY. The trades are ordered chronologically depending on when they were entered. The total profit is shown on the right, with a breakdown of the entry price and exit price included. You can see how the total dollar profit for each trade is calculated, assuming $0.01 slippage on both the entry and exit. This value is used in many of the calculations related to profit and loss.
How to use the backtester
At this point, we’ve covered most of the concepts, tools, and techniques in the new backtester. To recap, we first examined some of the common pitfalls traders face when doing their own backtest, which inspired us to create the new backtest finder. With over 50 million backtests and counting, filtering these backtests to meet your investment criteria is critical, which is why we paid close attention to the entry and exit criteria along with the 37 different performance metrics.
Finally, let’s look at the three unique ranking algorithms that bring it all together—Best overall performance, Best conservative winner, and Best return on risk or individual sorts on P&L average daily profit, Sharp, Sortino and the like. Whether you're searching for a consistent winner, a risk-adjusted return champion, or an all-rounder, our ranking algorithms can cater to your unique preferences, offering a targeted understanding of each strategy's potential effectiveness. Here’s a breakdown of each of the custom ranking algorithms:
Best overall performance: This ranking looks at the following metrics and applies the following weights: Annual Return (Overall) (33.3%), P&L % Per Day Avg. (16.6%), Sharpe Ratio (33.3%), and Sortino Ratio (16.6%).
Best conservative winner: This ranking looks at the following metrics and applies the following weights: Annual Return (Overall) (18.2%), Max Drawdown % (9%), Strategy Win Rate (9%), P&L % Per Day Avg. (18.2%), Worst Annual Return (9%), Worst Monthly Return (9%), Sharpe Ratio (9%), and Annual Sortino (18.2%).
Best return on risk: This ranking calculates the following metric: P&L % Per Day Avg. / (-1 * Average (Worst Monthly Return, Worst Annual Return, Max Drawdown %))
To find the strategy that meets your investment objectives, sort the table of backtests by any performance column instead of a ranking algorithm and filter the results based on your needs.
The future of backtesting
We believe in the power of backtesting and the weight it carries on executing an effective systematic trading strategy. Rule-based strategies grounded in historical data are a pillar of successful trading, which is why we’ve developed our new backtesting toolkit to help you quickly find your favorite strategies.
Moving forward, we’ll continue to add more symbols to our database so that you can find backtests for every ticker you trade. We’ll also continue to add more niche strategies, such as the recently added Wheel - a popular premium-generating strategy.
Our mission is to go from backtest to implementation in one click. We want finding your favorite strategy to be intuitive and simple, and then for you to systematically trade it with one click of a button. We’re partnering with various brokers to help bring this vision to life, with Tradier being our first broker to enter beta testing. If you’d like to test out the latest features, please email us at support@orats.com.
We’re also bringing you more tutorials and webinars to teach you the nuts and bolts of our trading toolkit. For our latest videos, please visit https://www.youtube.com/@orats.
Disclaimer:
The opinions and ideas presented herein are for informational and educational purposes only and should not be construed to represent trading or investment advice tailored to your investment objectives. You should not rely solely on any content herein and we strongly encourage you to discuss any trades or investments with your broker or investment adviser, prior to execution. None of the information contained herein constitutes a recommendation that any particular security, portfolio, transaction, or investment strategy is suitable for any specific person. Option trading and investing involves risk and is not suitable for all investors.
All opinions are based upon information and systems considered reliable, but we do not warrant the completeness or accuracy, and such information should not be relied upon as such. We are under no obligation to update or correct any information herein. All statements and opinions are subject to change without notice.
Past performance is not indicative of future results. We do not, will not and cannot guarantee any specific outcome or profit. All traders and investors must be aware of the real risk of loss in following any strategy or investment discussed herein.
Owners, employees, directors, shareholders, officers, agents or representatives of ORATS may have interests or positions in securities of any company profiled herein. Specifically, such individuals or entities may buy or sell positions, and may or may not follow the information provided herein. Some or all of the positions may have been acquired prior to the publication of such information, and such positions may increase or decrease at any time. Any opinions expressed and/or information are statements of judgment as of the date of publication only.
Day trading, short term trading, options trading, and futures trading are extremely risky undertakings. They generally are not appropriate for someone with limited capital, little or no trading experience, and/ or a low tolerance for risk. Never execute a trade unless you can afford to and are prepared to lose your entire investment. In addition, certain trades may result in a loss greater than your entire investment. Always perform your own due diligence and, as appropriate, make informed decisions with the help of a licensed financial professional.
Commissions, fees and other costs associated with investing or trading may vary from broker to broker. All investors and traders are advised to speak with their stock broker or investment adviser about these costs. Be aware that certain trades that may be profitable for some may not be profitable for others, after taking into account these costs. In certain markets, investors and traders may not always be able to buy or sell a position at the price discussed, and consequently not be able to take advantage of certain trades discussed herein.
Be sure to read the OCCs Characteristics and Risks of Standardized Options to learn more about options trading.
Related Posts