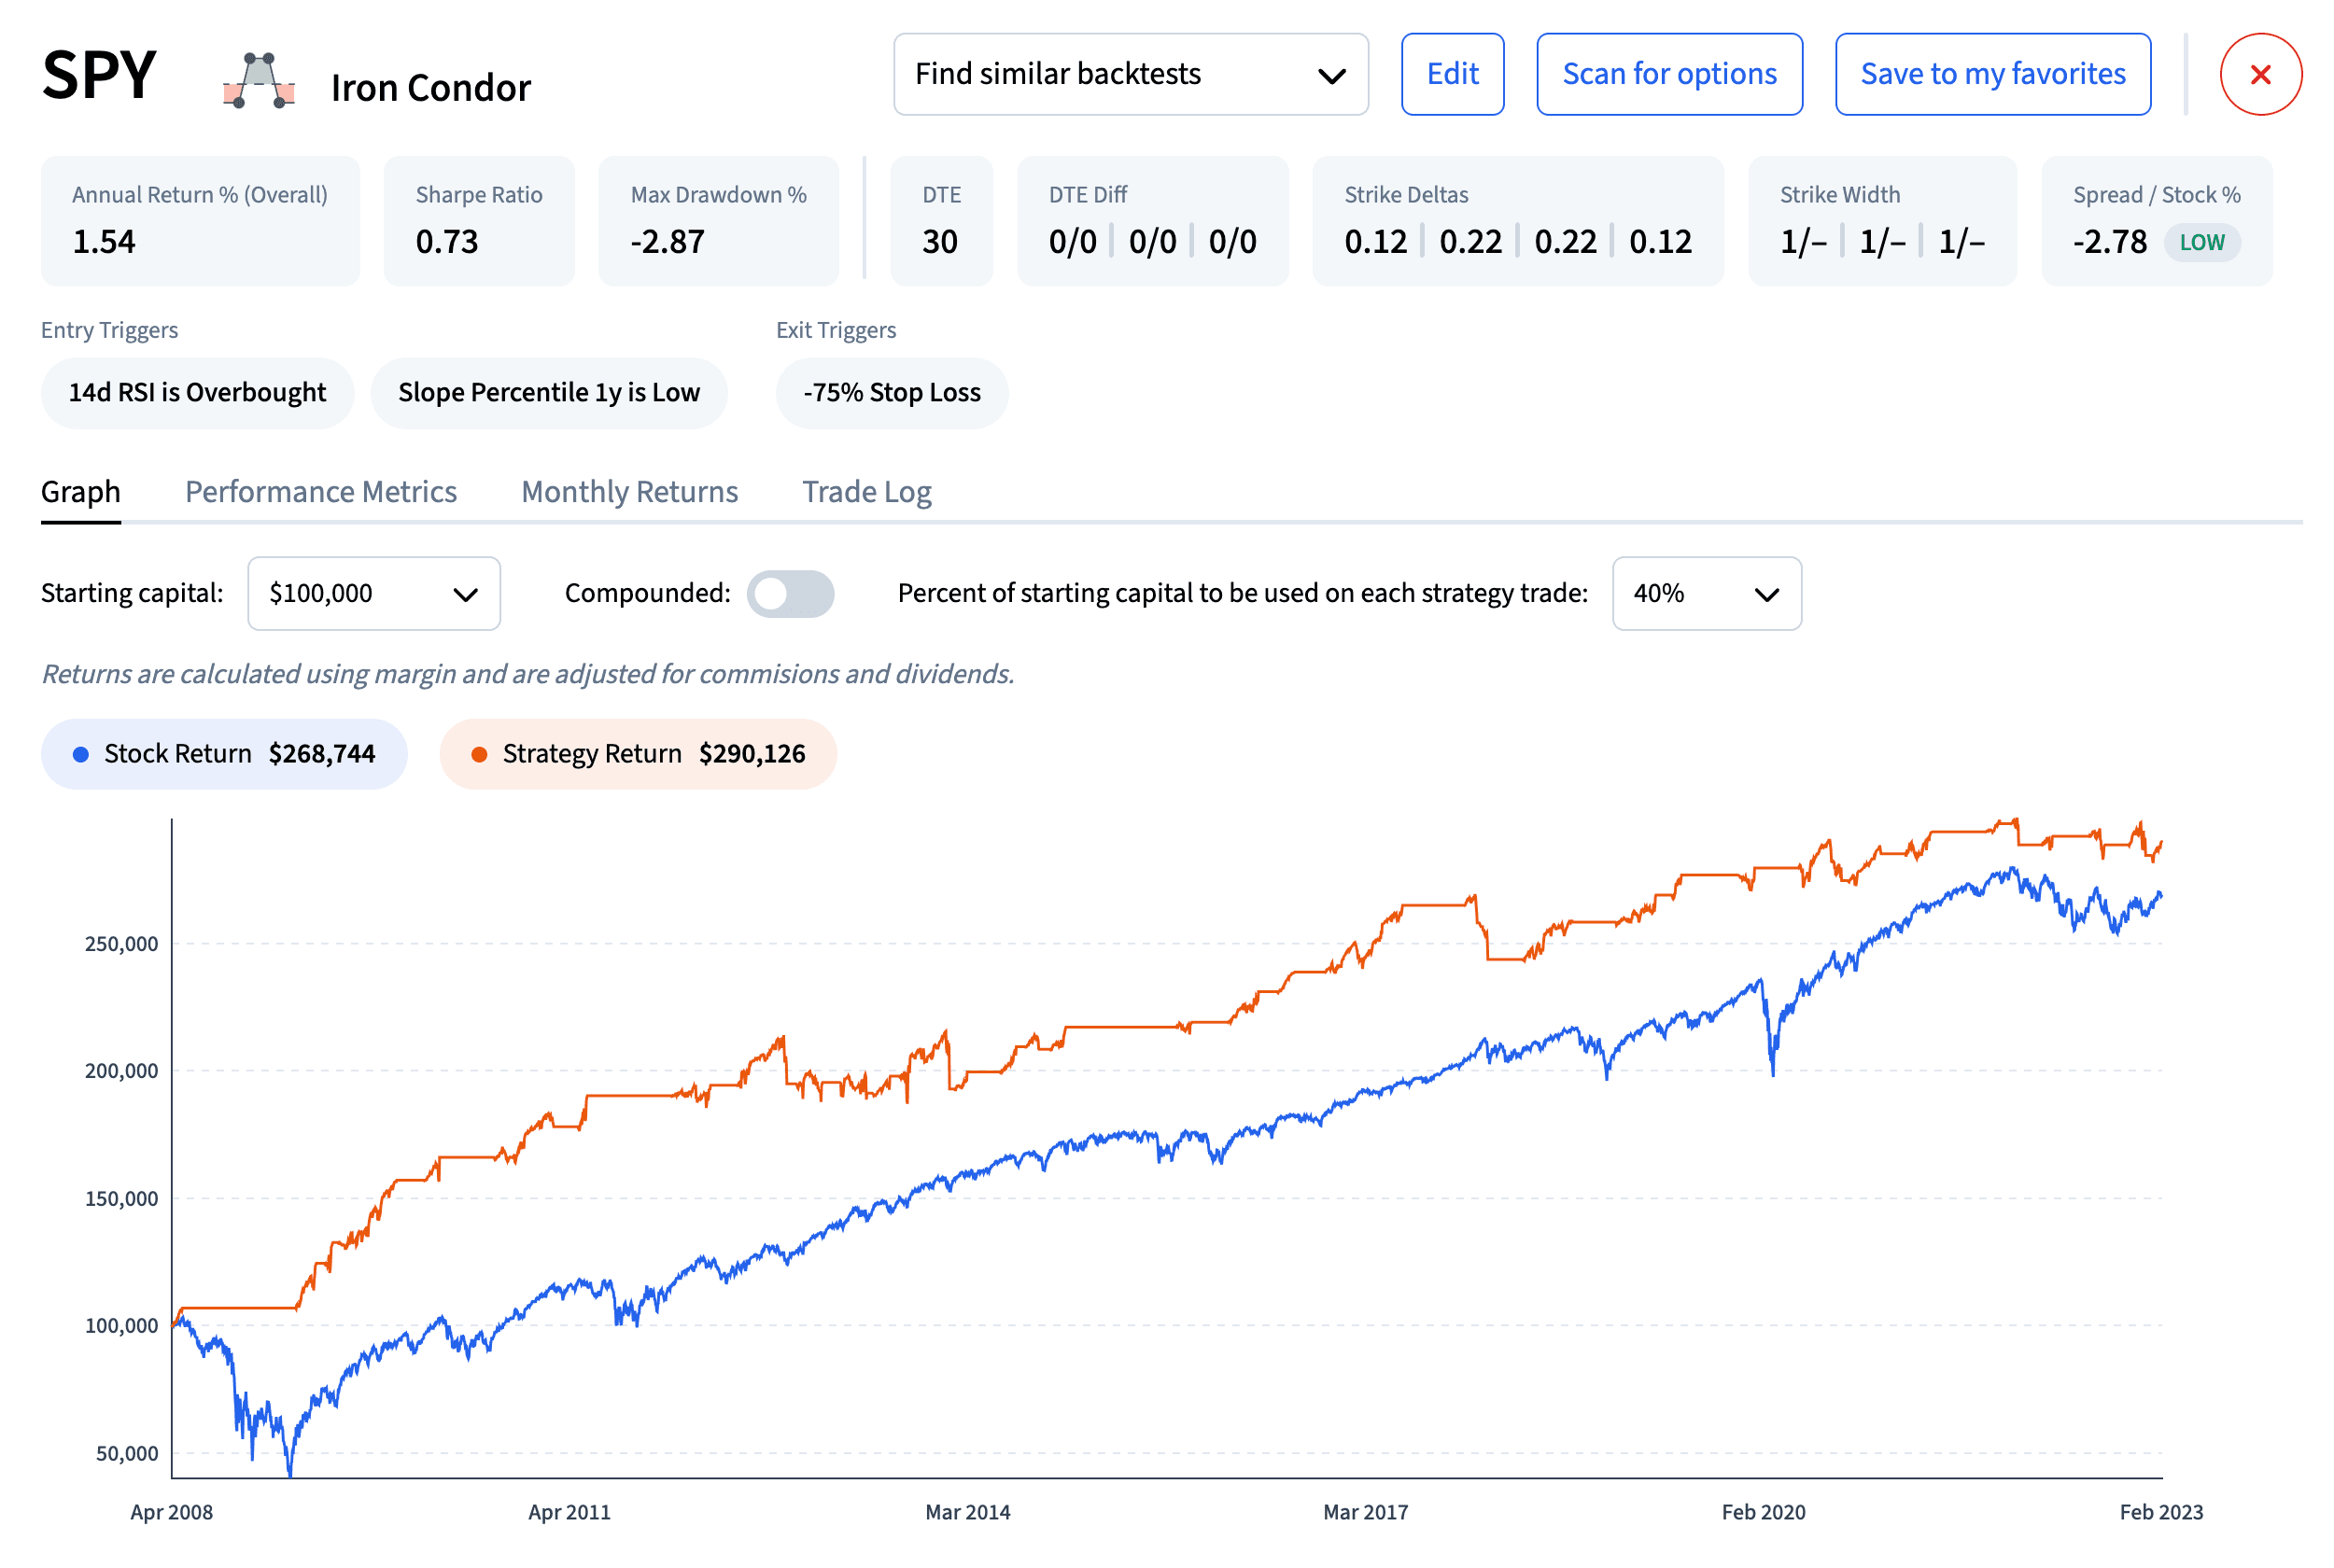
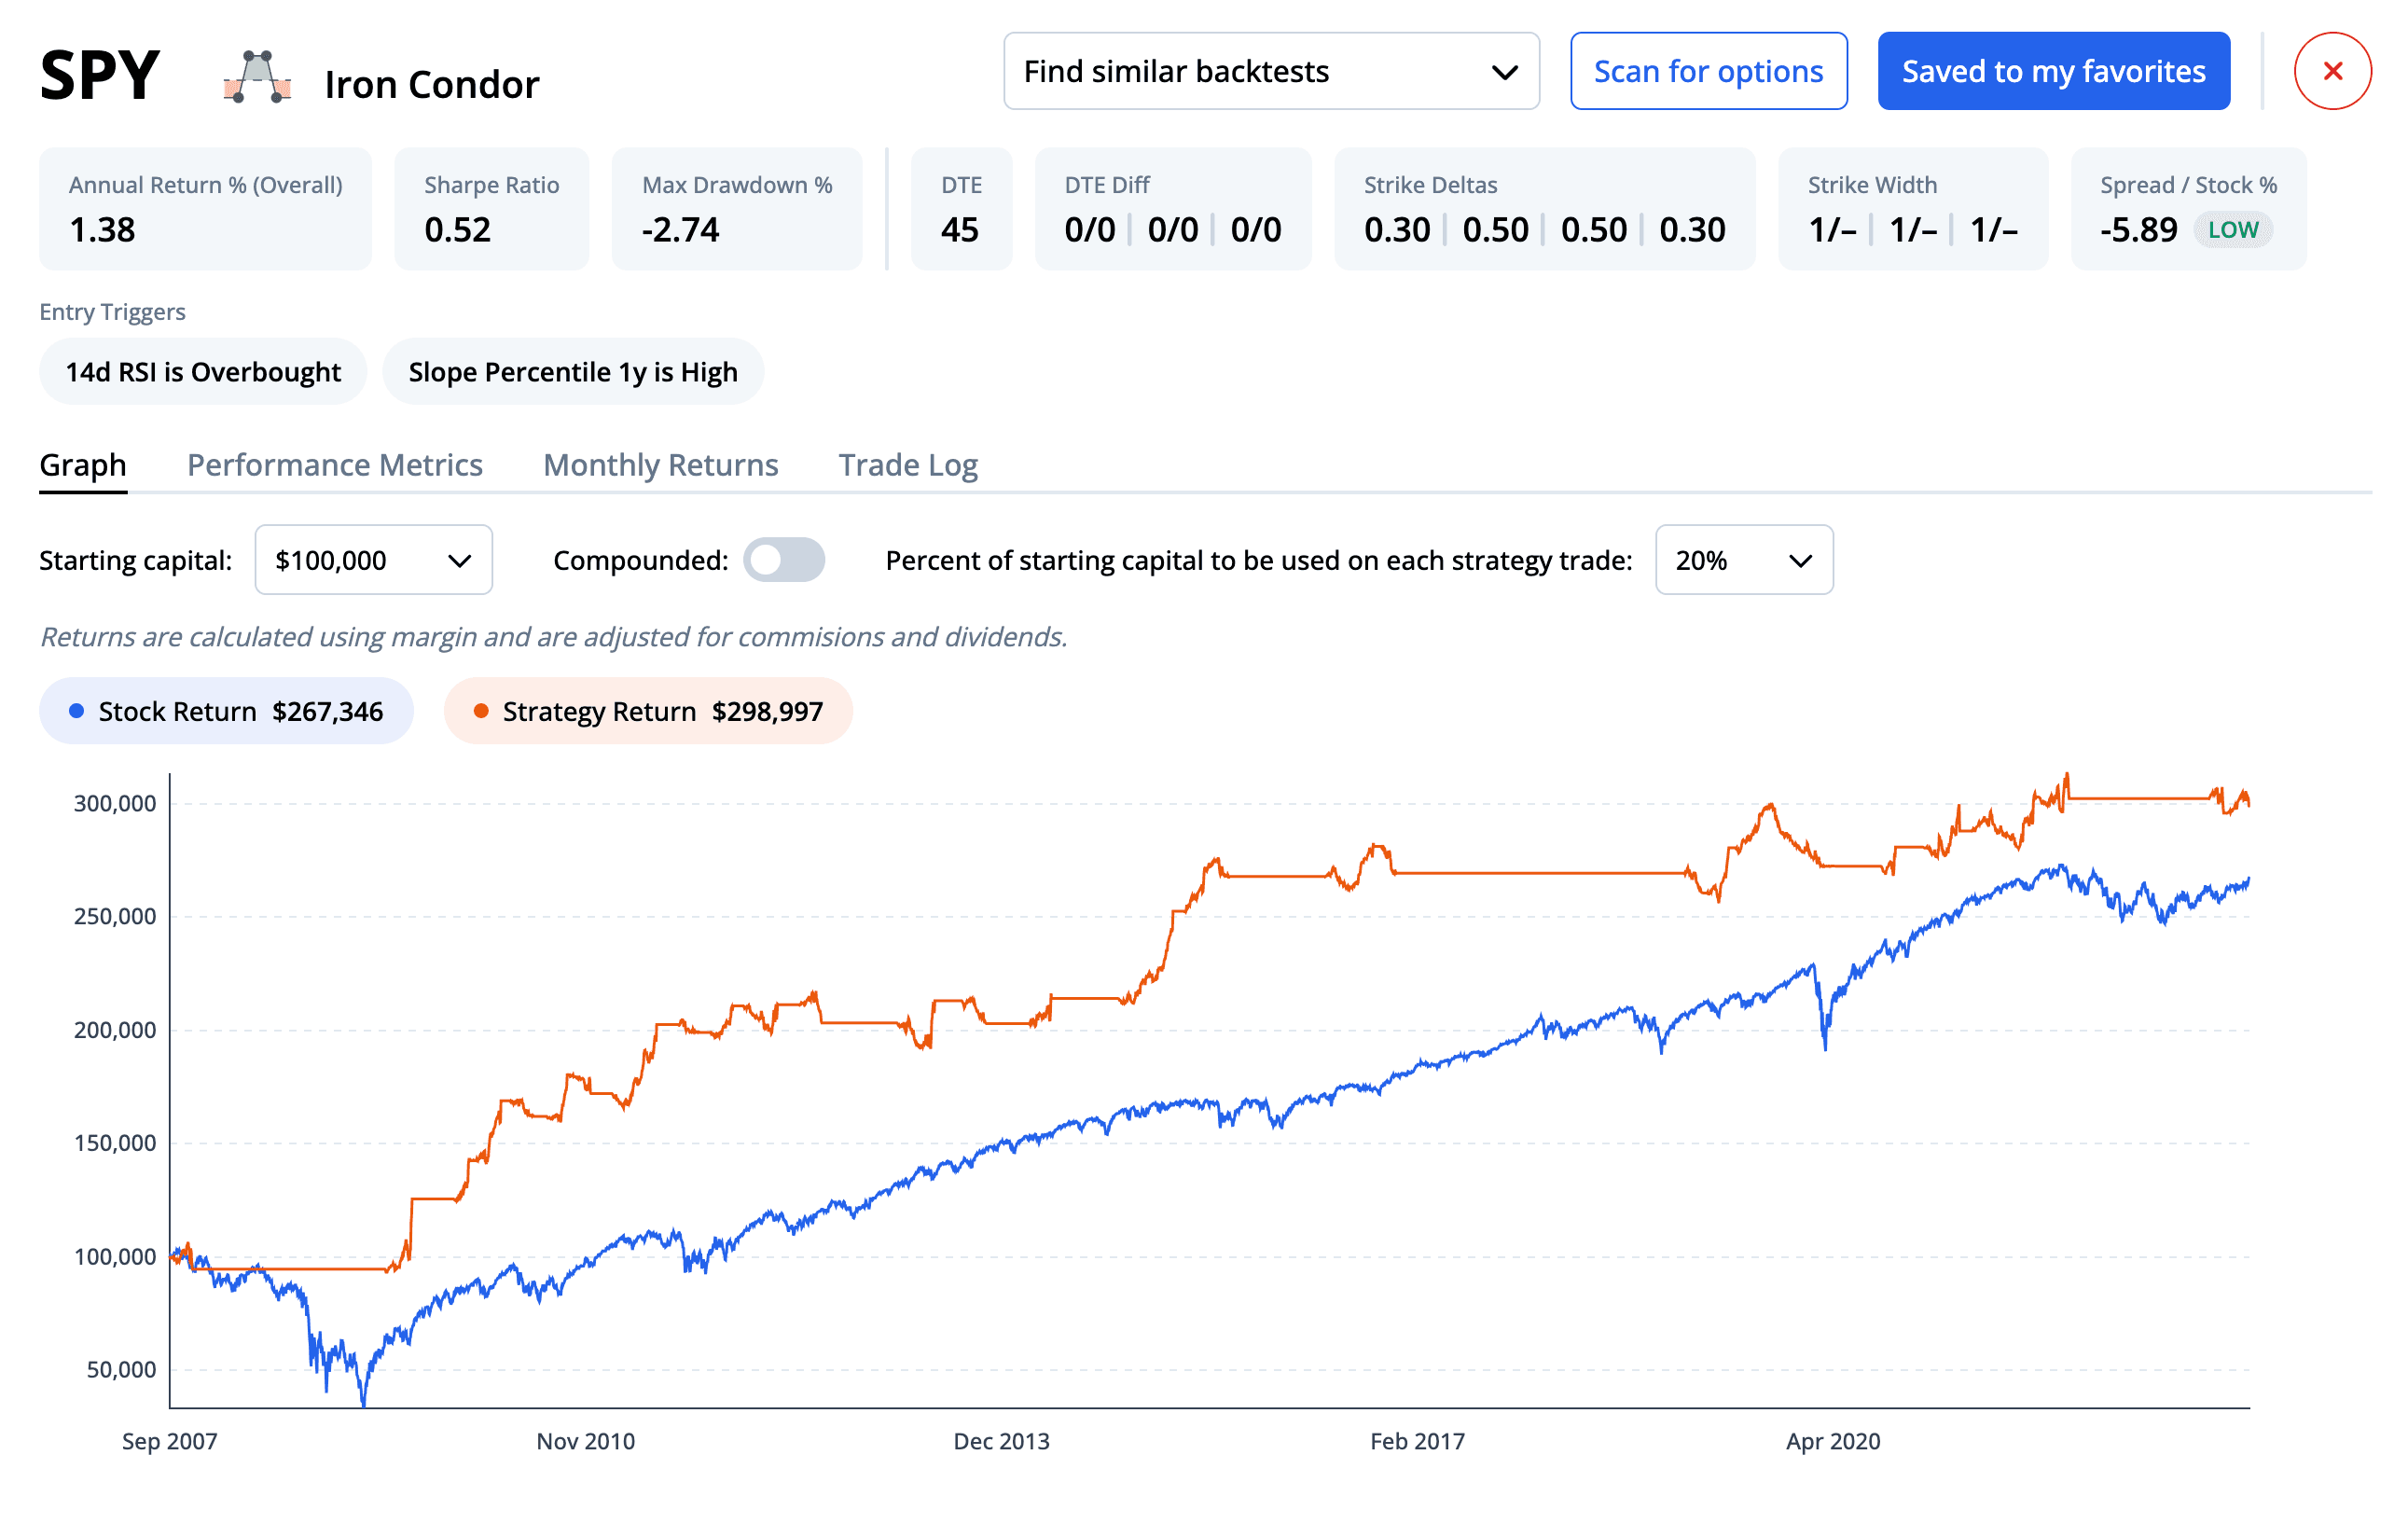
Backtesting
Thursday, July 27th 2023
Optimizing Options Backtests Days to Expiry, Deltas, and Technical Indicators
Filter millions of backtests based on different parameters, technical indicators, and exit triggers for all types of options strategies.
Summary
The new ORATS Backtester allows traders to filter millions of options backtests based on different days to expiry, deltas, technical indicators, and more. Three main entry criteria are explored, including Days to Expiration, Strike Deltas, and Spread/Stock. Five key entry triggers are also examined, such as VIX Price and Simple Moving Average, as well as exit triggers like Stop Loss and Profit Target. Understanding and analyzing these parameters can help optimize trading performance and manage risk.
In the dynamic world of options trading, understanding how different strategies perform under varying market conditions is key to making informed decisions. Our new ORATS Backtester is a powerful tool that helps traders unravel the complexity of options strategies by testing different entry criteria, technical indicators, and exit triggers. In this blog post, we'll dive into the depths of these parameters, explaining what they mean and their role in your trading strategy.
Days to Expiration (DTE)
When trading options, the clock is always ticking. Days to Expiration (DTE) indicates the remaining time until an option contract expires. Our backtesting tool analyzes strategy performance over a diverse range of DTEs, from as little as 2 days to over 300 days. By evaluating the strategy's performance across different time horizons, traders can gain insights into the ideal periods for executing specific strategies. In the backtester, you can filter down the table of results by specifying DTE min/max for each leg.
Strike Deltas
The strike delta is a measurement of how much an option's price is likely to move with each $1 move in the underlying security. To provide you with a comprehensive view, our backtester tests strategies across a variety of absolute deltas, including in-the-money and out-of-the-money strikes. In addition to single leg strategies, we also test a variety of multi-leg strategies with more complex strike deltas such as vertical spreads and iron condors. Like DTE, you can use the filters in the backtest table to narrow down backtests by the strike delta min/max for each leg of the strategy.

Spread / Stock (Spread Yield)
Spread Yield is a measure of the price paid for the options spread relative to the price of the underlying stock. It's calculated by dividing the price paid for the spread by the stock price. Our backtester categorizes the spread yield target for each backtest as low, moderate, or high, relative to other backtests with comparable DTE and strike deltas. This additional context allows for more informed analysis.
It’s interesting to explore the relationships between different backtest entry criteria and their performance. For example, if you filter down SPY Short Put Spreads by a low VIX entry trigger, and rank them by best overall performance, you’ll see that the spread / stock is almost always low. This shows that in a low volatility environment, this strategy performed better as you targeted a lower spread yield.
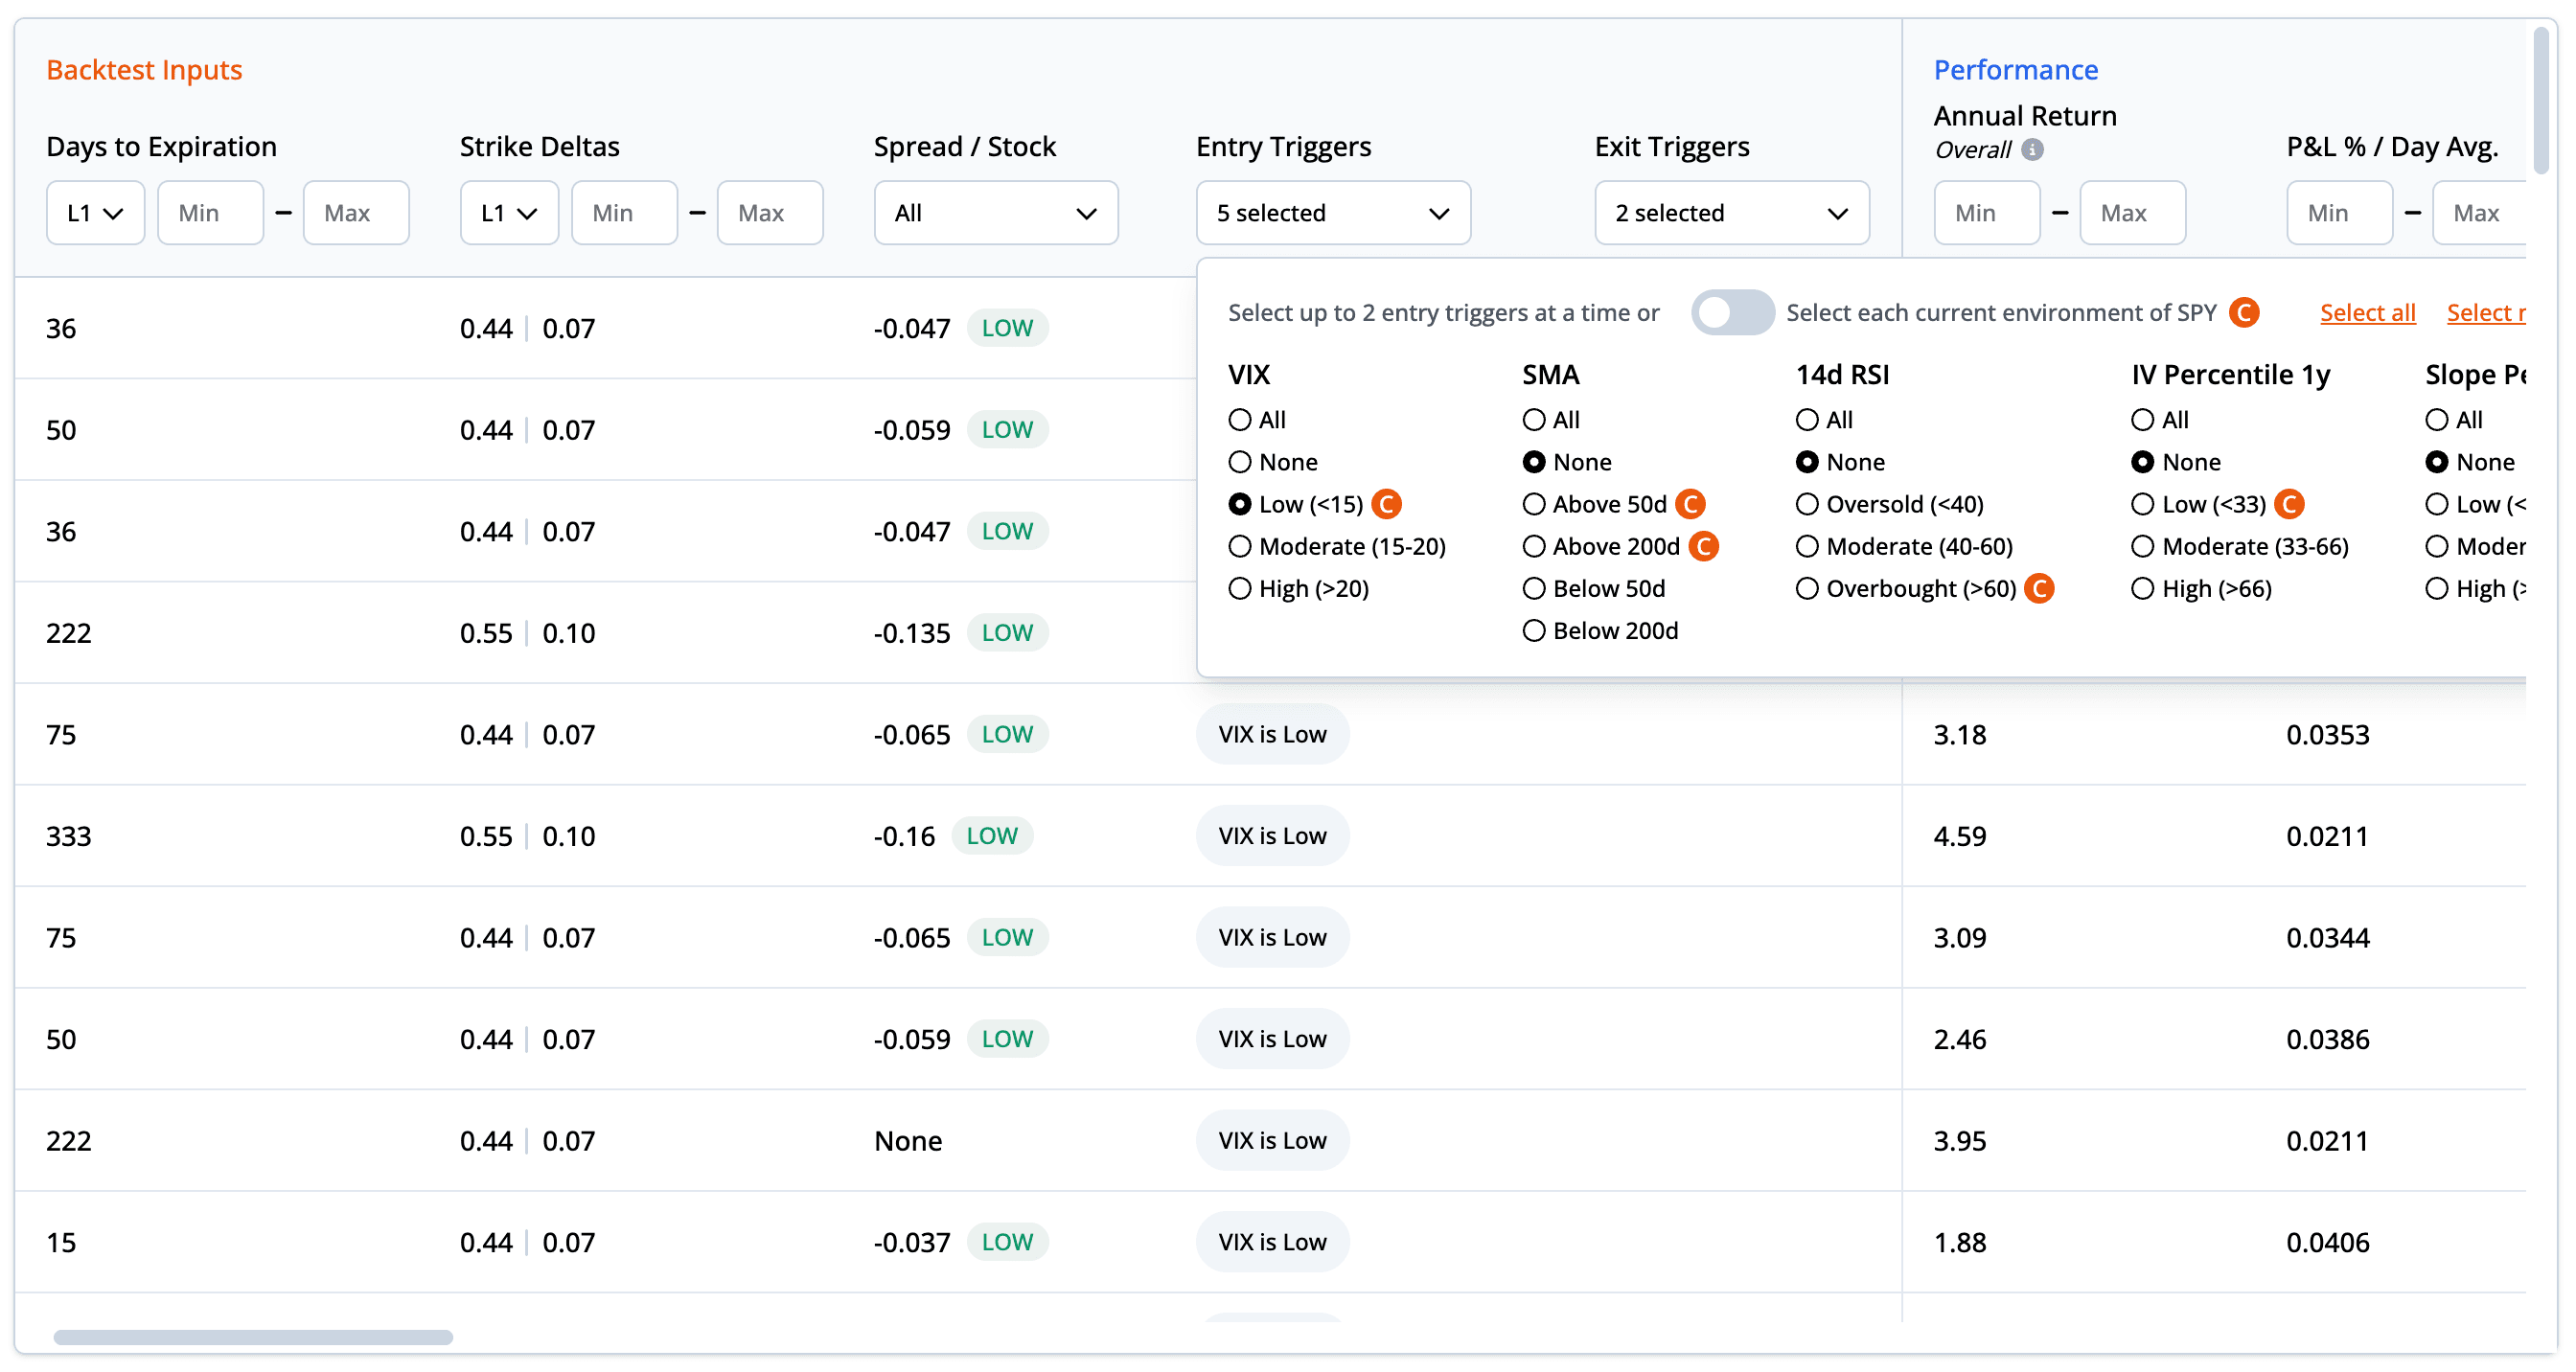
Technical indicators can provide guidance on when to enter a trade. We’ve added five different technical indicators to be used as entry triggers in the backtester:
- VIX Price: The VIX, or volatility index, reflects the market's expectation of 30-day forward-looking volatility. Low VIX levels (<15) suggest a calm market, moderate levels (15-20) indicate normal volatility, while high levels (>20) imply increased uncertainty.
- Simple Moving Average (SMA): SMA is a commonly used technical indicator that smoothes out price data to capture trends over specific periods. Our backtester tests if the price is above or below the 50 or 200-day SMA.
- 14d RSI: The 14-day Relative Strength Index (RSI) is a momentum oscillator that measures the speed and change of price movements. A reading of less than 40 indicates oversold conditions, 40-60 suggests moderate momentum, and above 60 signals overbought conditions.
- IV Percentile 1 Year: The IV percentile shows where the current implied volatility of the underlying stands relative to its 1-year range. It's categorized as low (<33), moderate (33-66), or high (>66).
- Slope Percentile 1 Year: This trigger shows where the current slope of the implied volatility skew stands relative to its 1-year range, categorized as low (<33), moderate (33-66), or high (>66).
For each of these entry triggers, one of the levels is always the “current environment”. This is denoted by the orange “C” next to the corresponding level. For example, if the 14d RSI is currently overbought, an orange “C” will appear next to the overbought trigger. This information is very helpful when trying to find a trade to put on immediately, because you can filter down the backtests that performed well in the current environment. You can also toggle on “Select each current environment of [ticker]” and the table will only show backtests that have been tested with any combination of the current environment entry triggers.
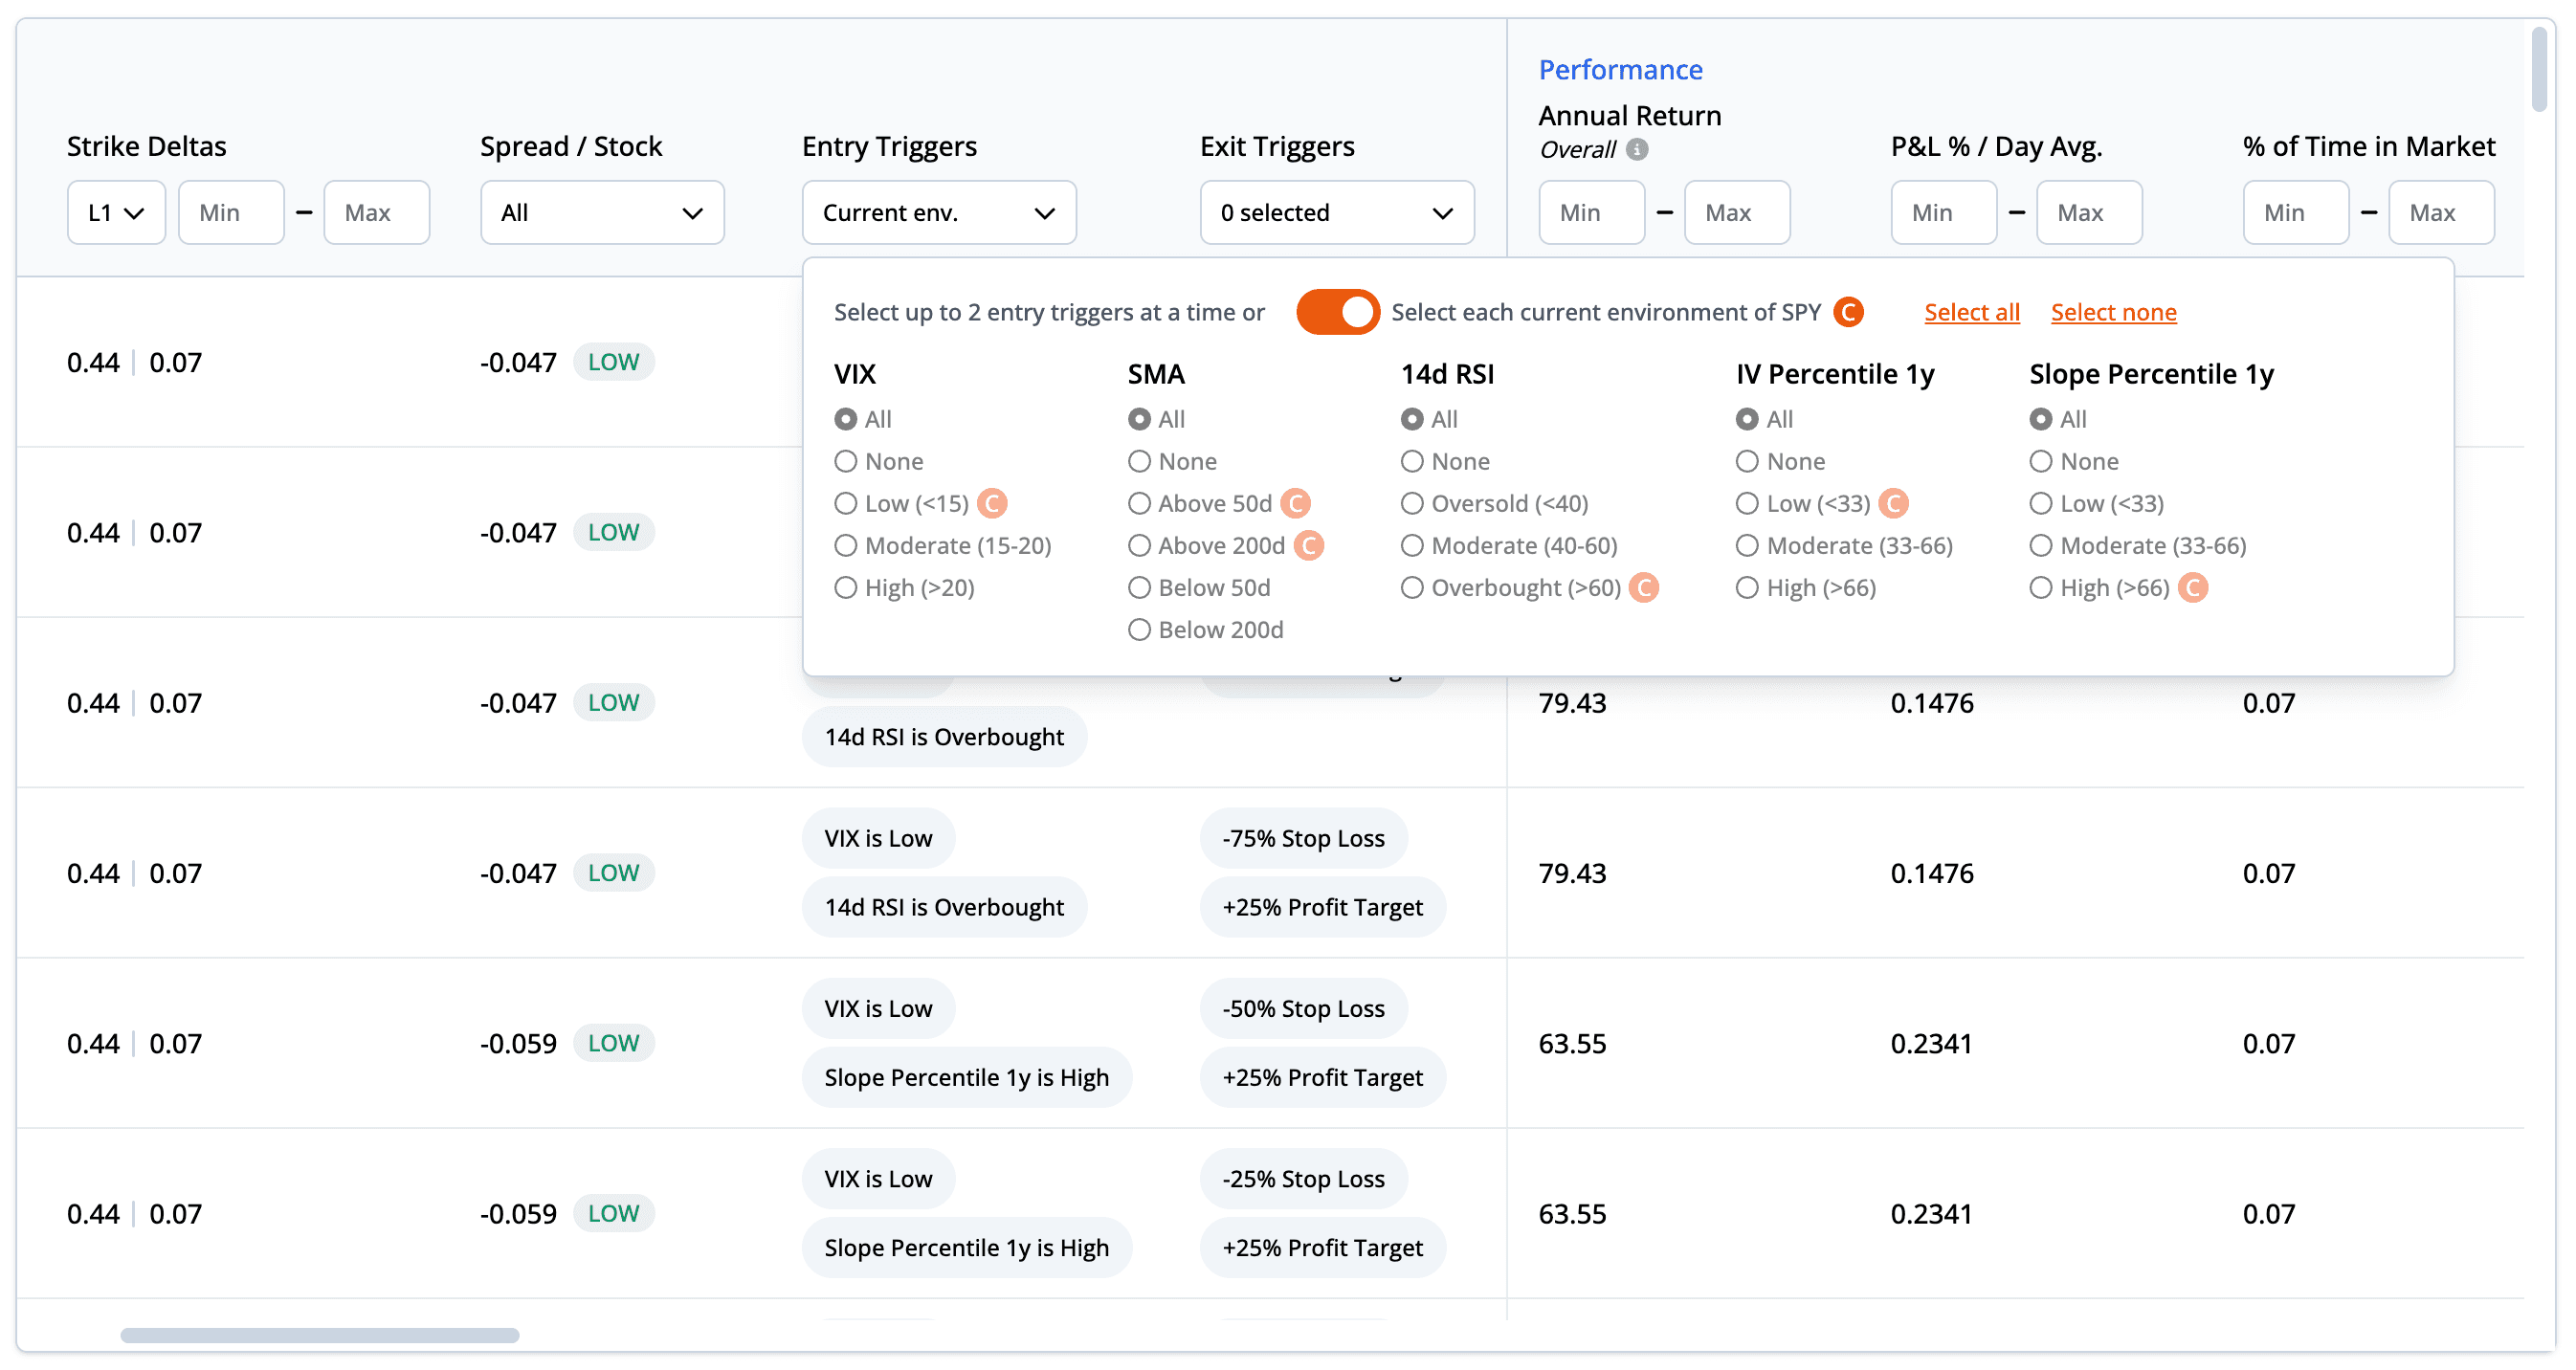
Exit triggers play a crucial role in risk management and profit protection. We test stop loss levels of -25%, -50%, and -75% to protect from excessive losses. For locking in profits, we test profit targets of +25%, +50%, +75%, +100% (if debit strategy), +150% (if debit strategy), and +300% (if debit strategy). Like all other entry criteria and triggers, you can filter the table down to backtests that only test a specific stop loss or profit target.
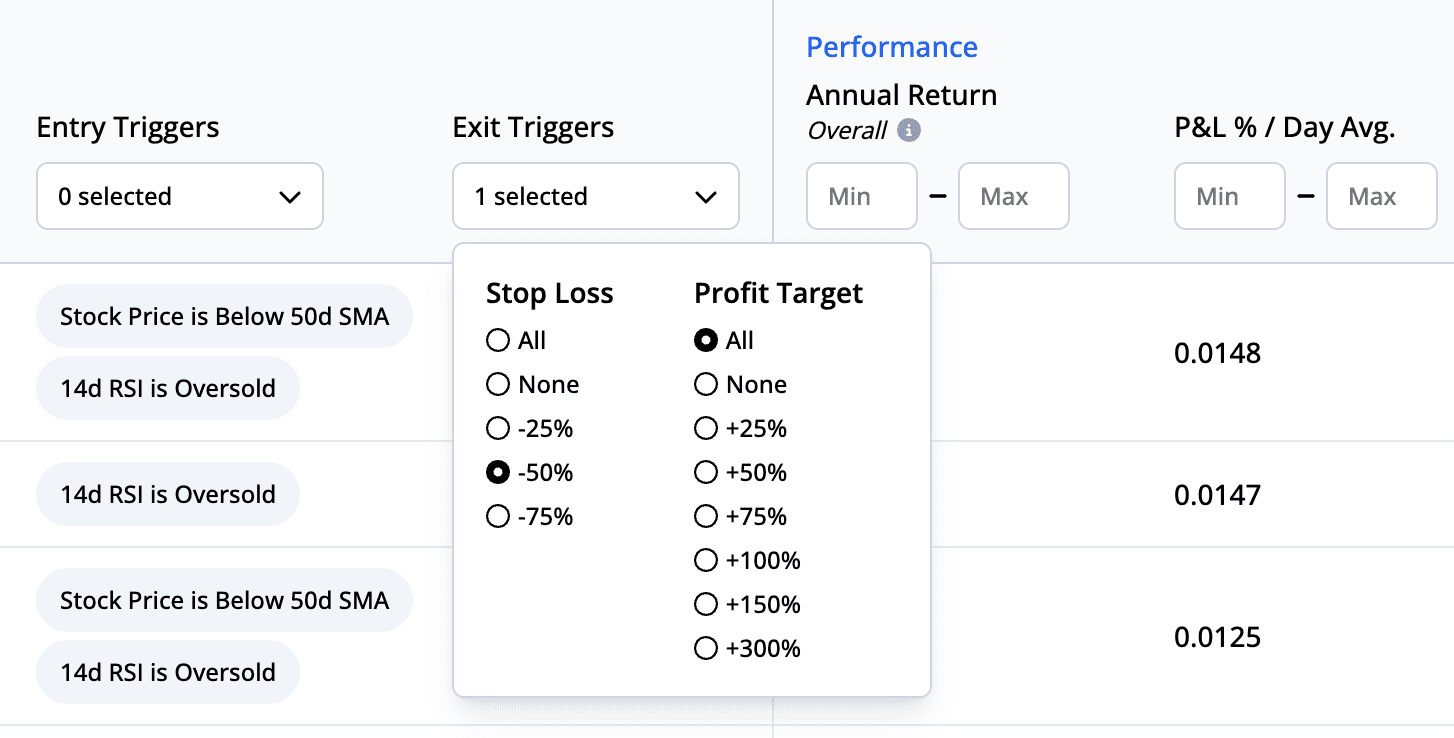
With the ORATS Backtester, you have the power to browse millions of various options strategies under different market conditions, providing invaluable insights for your trading decisions. Understanding and analyzing these entry and exit criteria can help optimize your performance and manage risk. Stay tuned to our blog series as we continue to explore and unravel the potential of our new backtesting tool.
Disclaimer:
The opinions and ideas presented herein are for informational and educational purposes only and should not be construed to represent trading or investment advice tailored to your investment objectives. You should not rely solely on any content herein and we strongly encourage you to discuss any trades or investments with your broker or investment adviser, prior to execution. None of the information contained herein constitutes a recommendation that any particular security, portfolio, transaction, or investment strategy is suitable for any specific person. Option trading and investing involves risk and is not suitable for all investors.
All opinions are based upon information and systems considered reliable, but we do not warrant the completeness or accuracy, and such information should not be relied upon as such. We are under no obligation to update or correct any information herein. All statements and opinions are subject to change without notice.
Past performance is not indicative of future results. We do not, will not and cannot guarantee any specific outcome or profit. All traders and investors must be aware of the real risk of loss in following any strategy or investment discussed herein.
Owners, employees, directors, shareholders, officers, agents or representatives of ORATS may have interests or positions in securities of any company profiled herein. Specifically, such individuals or entities may buy or sell positions, and may or may not follow the information provided herein. Some or all of the positions may have been acquired prior to the publication of such information, and such positions may increase or decrease at any time. Any opinions expressed and/or information are statements of judgment as of the date of publication only.
Day trading, short term trading, options trading, and futures trading are extremely risky undertakings. They generally are not appropriate for someone with limited capital, little or no trading experience, and/ or a low tolerance for risk. Never execute a trade unless you can afford to and are prepared to lose your entire investment. In addition, certain trades may result in a loss greater than your entire investment. Always perform your own due diligence and, as appropriate, make informed decisions with the help of a licensed financial professional.
Commissions, fees and other costs associated with investing or trading may vary from broker to broker. All investors and traders are advised to speak with their stock broker or investment adviser about these costs. Be aware that certain trades that may be profitable for some may not be profitable for others, after taking into account these costs. In certain markets, investors and traders may not always be able to buy or sell a position at the price discussed, and consequently not be able to take advantage of certain trades discussed herein.
Be sure to read the OCCs Characteristics and Risks of Standardized Options to learn more about options trading.
Related Posts

