Trading
Tuesday, July 7th 2026
Biotech: The Options Are Braced for a Move Either Way
XBI options are pricing elevated volatility with almost no skew, a sign the market expects a large move but sees biotech risk as unusually two-sided rather than crash-driven.
Summary
Biotech ETFs like XBI are experiencing very high implied volatility (around the 94th percentile) with almost no skew, indicating the market expects a large, two‑sided move rather than a crash‑biased one; the rally from $128 to $161 has pushed 30‑day implied vol up to the mid‑30s, matching realized volatility, while both calls and puts hold strong open interest, reflecting balanced upside and downside risk in the sector.
July 7, 2026
By Tyler Cheves
Biotech ripped about 26% off its early-June low to its highest close since February 2021, and its options grew more expensive, not cheaper. XBI's 30-day implied vol sits at the 94th percentile of the past year. What's unusual is the shape: it carries almost no skew. The 25-delta put/call spread is 0.9 vol points, against 3.6 on the S&P 500 and far steeper on the big tech and chip ETFs. Biotech is pricing a big move with no crash bias.
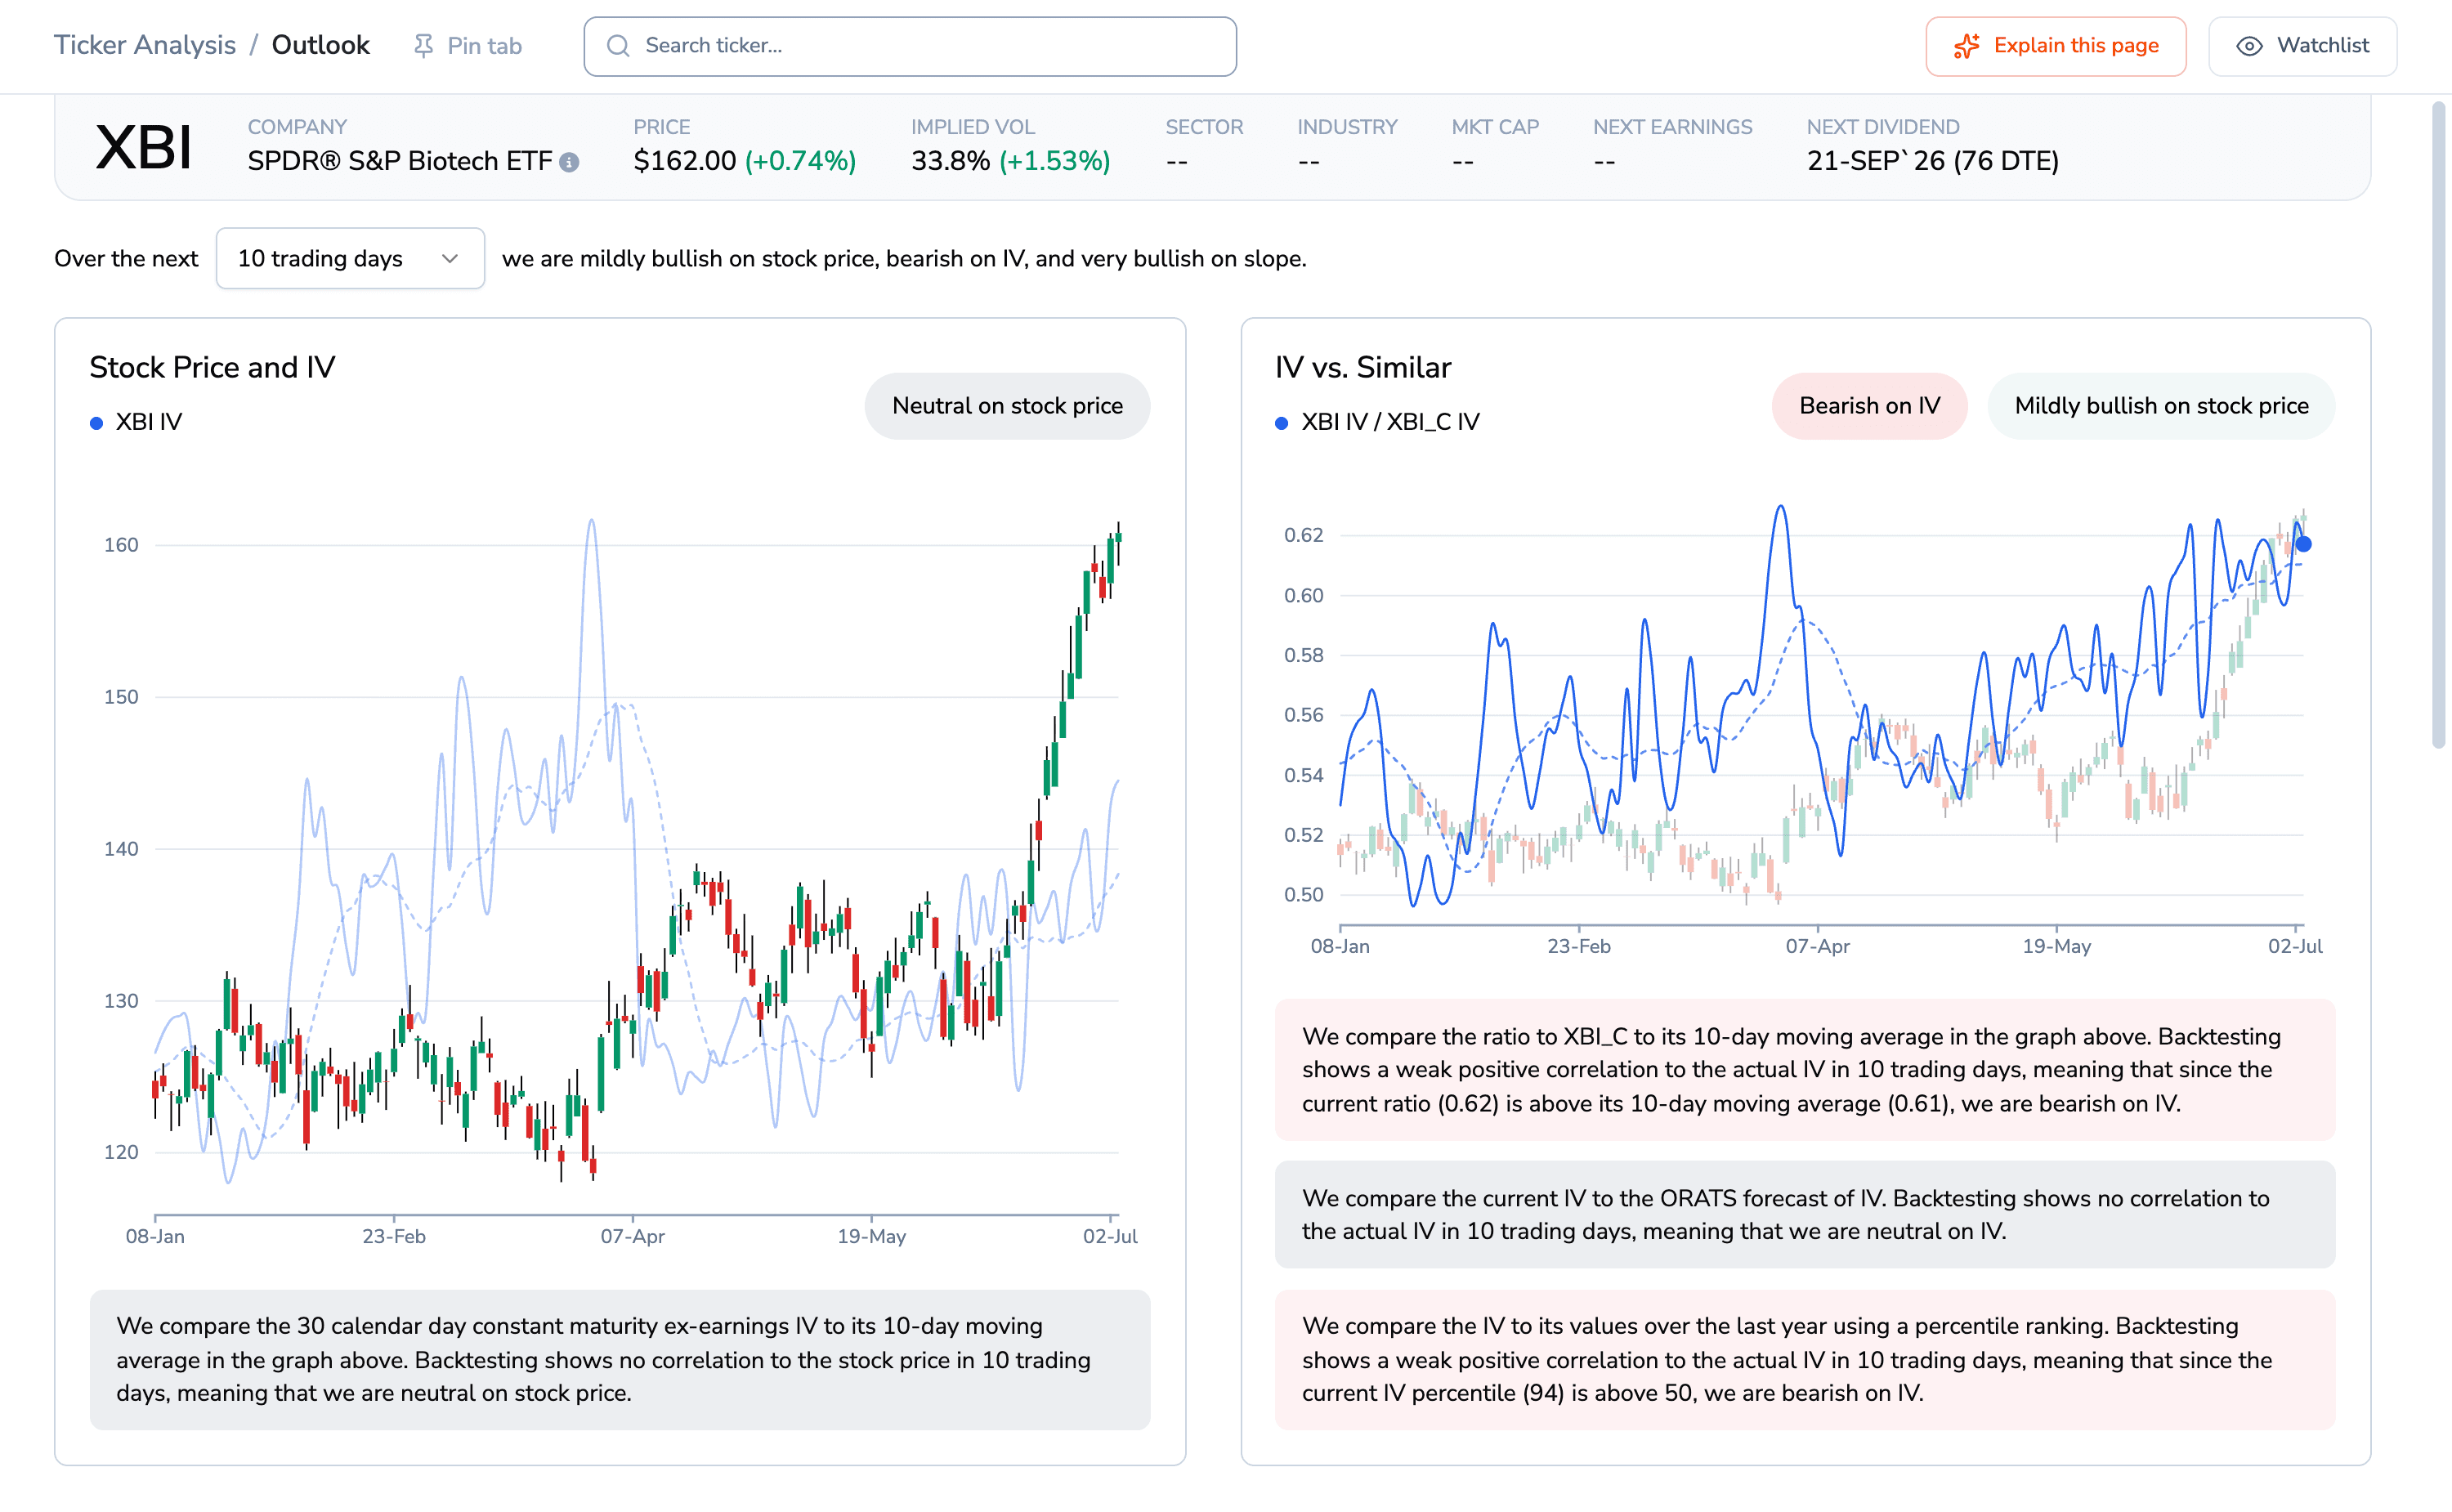
ORATS Outlook screen for XBI showing a candlestick price chart climbing steeply to about 160 at the right edge with an implied-vol line overlaid, next to an IV panel whose text states the current IV percentile is 94.
XBI rallied to its highest close since early 2021 while its 30-day implied vol sits at the 94th percentile of the year. The rally did not calm the options. Header values are live at Tuesday's open; the chart runs through the July 6 close.
Skew is what the market pays for one side of a move over the other. A steep positive skew, normal for an index that gaps down when it breaks, means puts cost far more than calls. A flat skew means a move is expected with no directional lean.
XBI climbed from about $128 on June 2 to $161 by July 6, yet its 30-day implied vol rose from 30.2 to 33.6 as the rally matured. The premium is ordinary, though: implied (33.6) sits just under its 20-day forecast (35), above close-to-close realized (30) and level with the range-based measure (33). A modest 1.1x, not the crash-loaded premium the indexes carry.
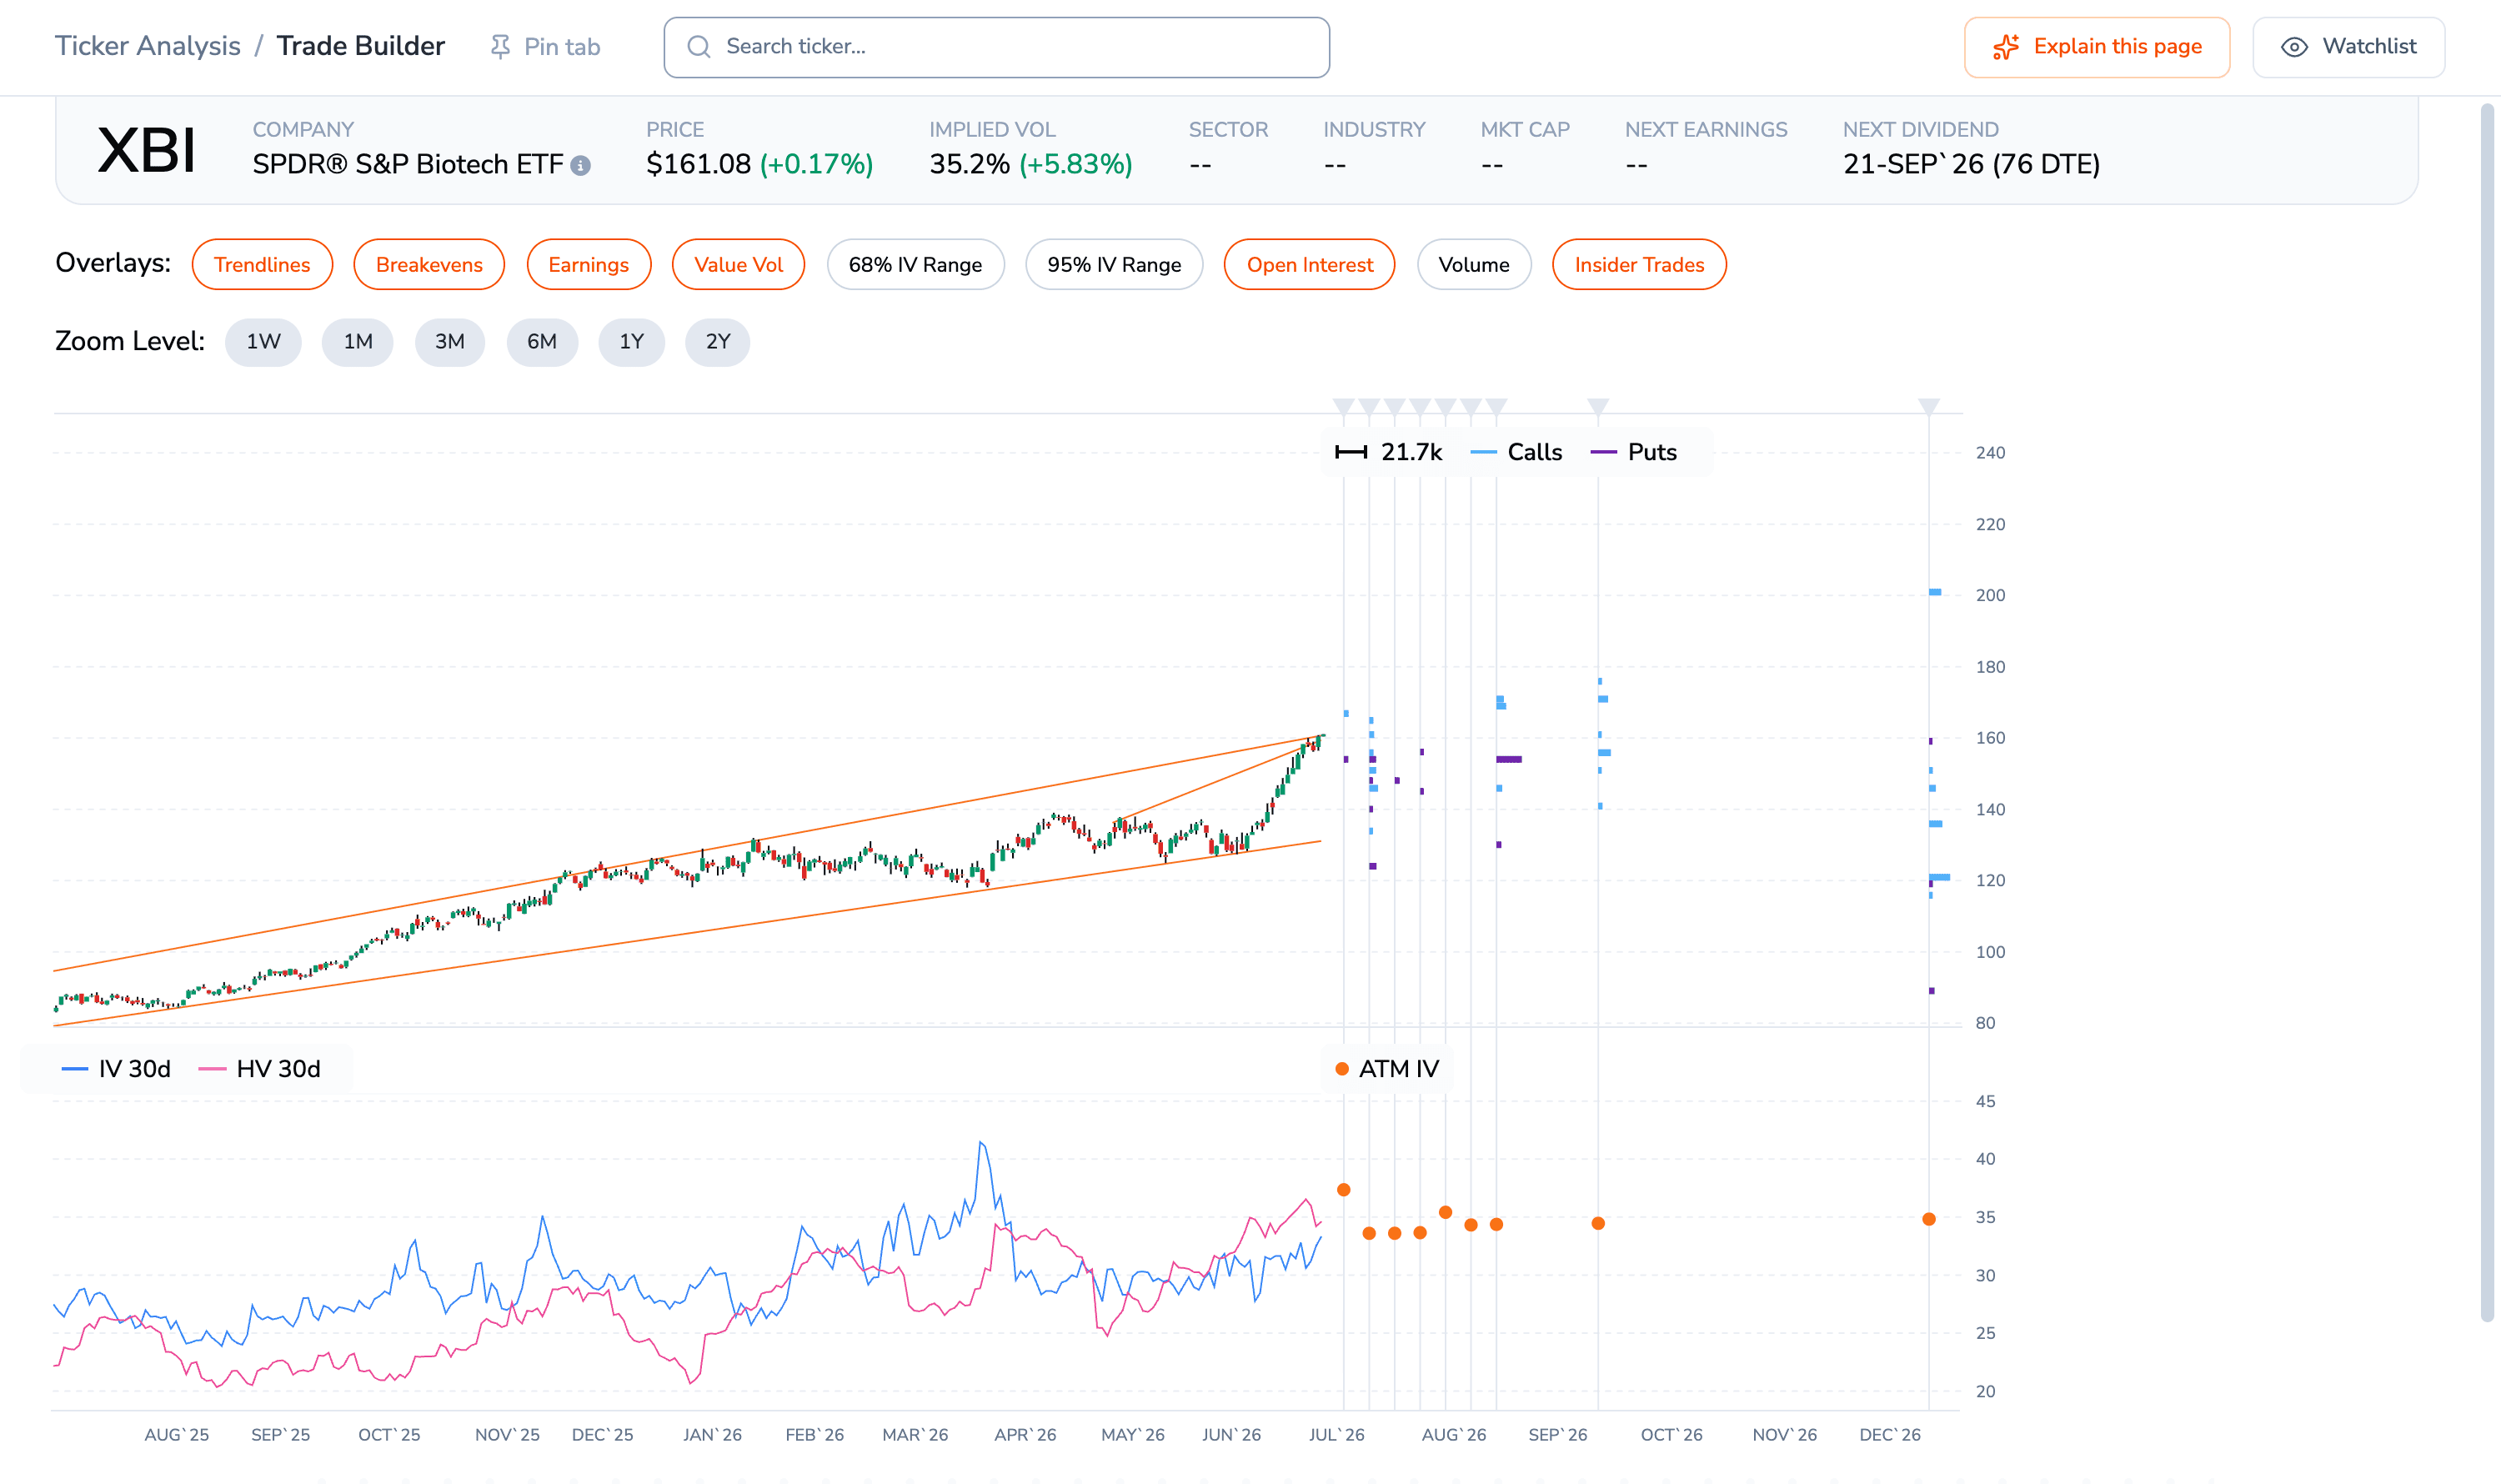
ORATS Trade Builder chart for XBI: a rising candlestick chart with call and put open-interest markers across strikes, and a lower panel plotting a 30-day implied-vol line against a 30-day realized-vol line that track near 33 to 34.
Implied vol (blue) tracks the dashboard's realized-vol line (pink) near 33 to 34, so the high implied is roughly matched by high delivered vol, an ordinary premium. Open interest sits on both calls (cyan) and puts (purple).
And the high vol isn't a near-term event bet: XBI's 30-day and one-year implied vol are nearly identical, both near 34.
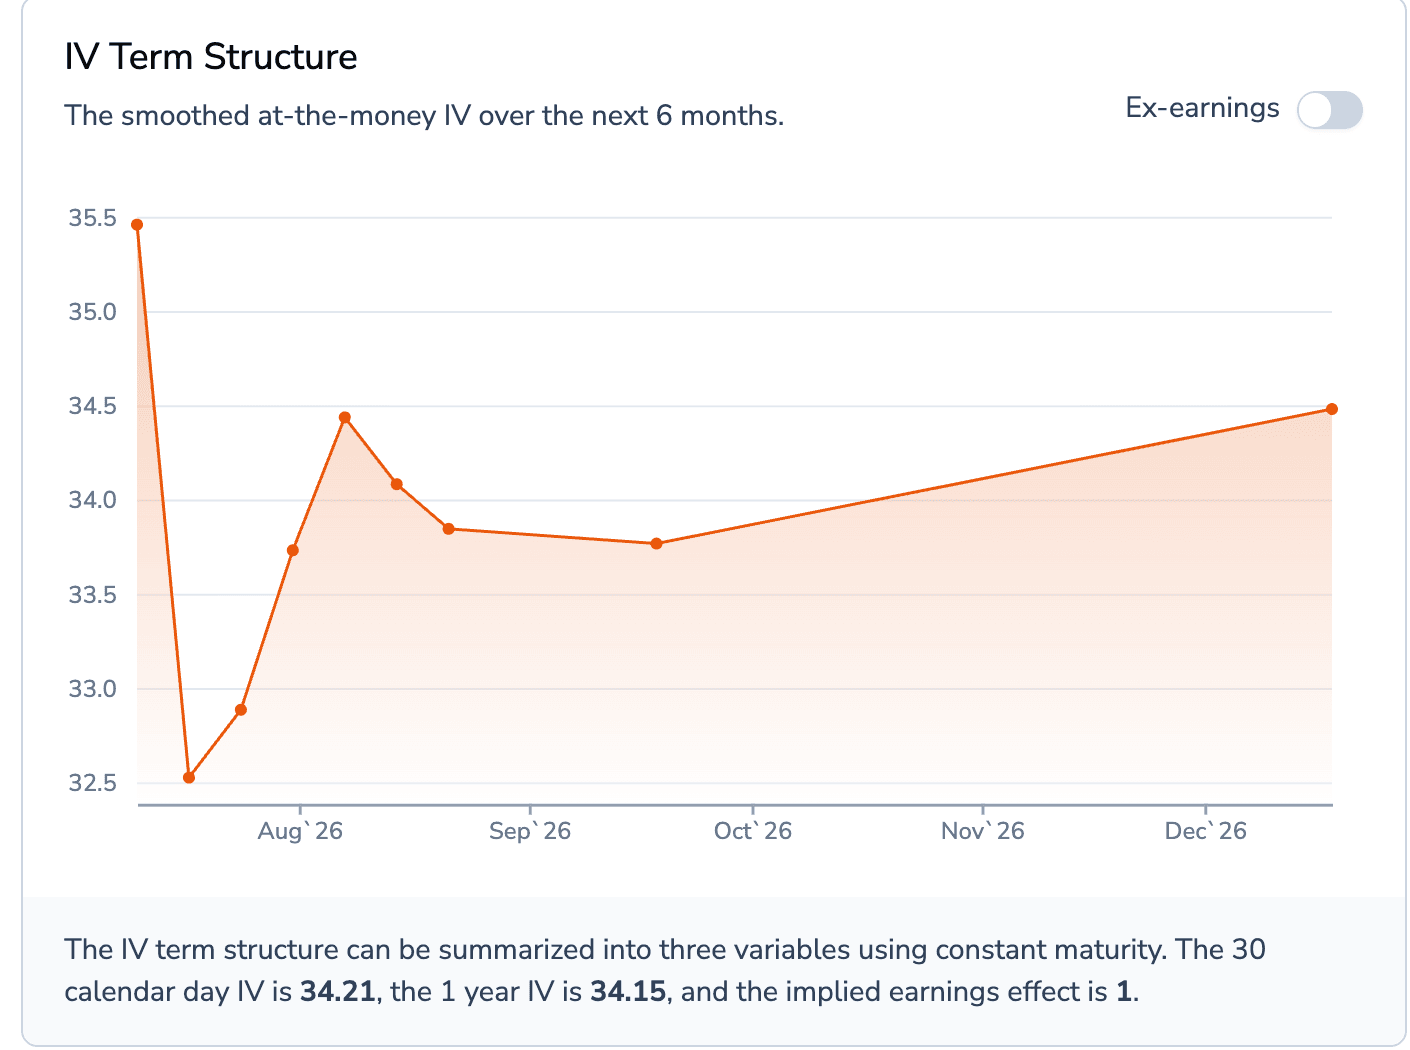
ORATS IV Term Structure chart for XBI, a line of at-the-money implied vol across expirations from now to December that dips near the front then sits roughly flat around 34, ending near 34.5.
After a dip in the first weeks, the at-the-money IV holds near 34 out to December, the 30-day and one-year readings almost identical (34.21 and 34.15). The high vol is a persistent regime priced across a year, not a near-term event hump.
XBI's skew is flatter than an index's by nature, and now it sits in the bottom decile of its own year, the upside catalysts bidding the call side up.
You might object that high vol mechanically flattens skew. I don't buy it: XLK carries higher implied vol than XBI and about eight times the skew, SMH far higher vol and seven times. Biotech is flatter than names with more vol, so its flatness is a real residual, not the vol level. Healthcare (XLV) runs flat too, at half the vol. In skew terms biotech sits with the commodities, not the stock indexes.
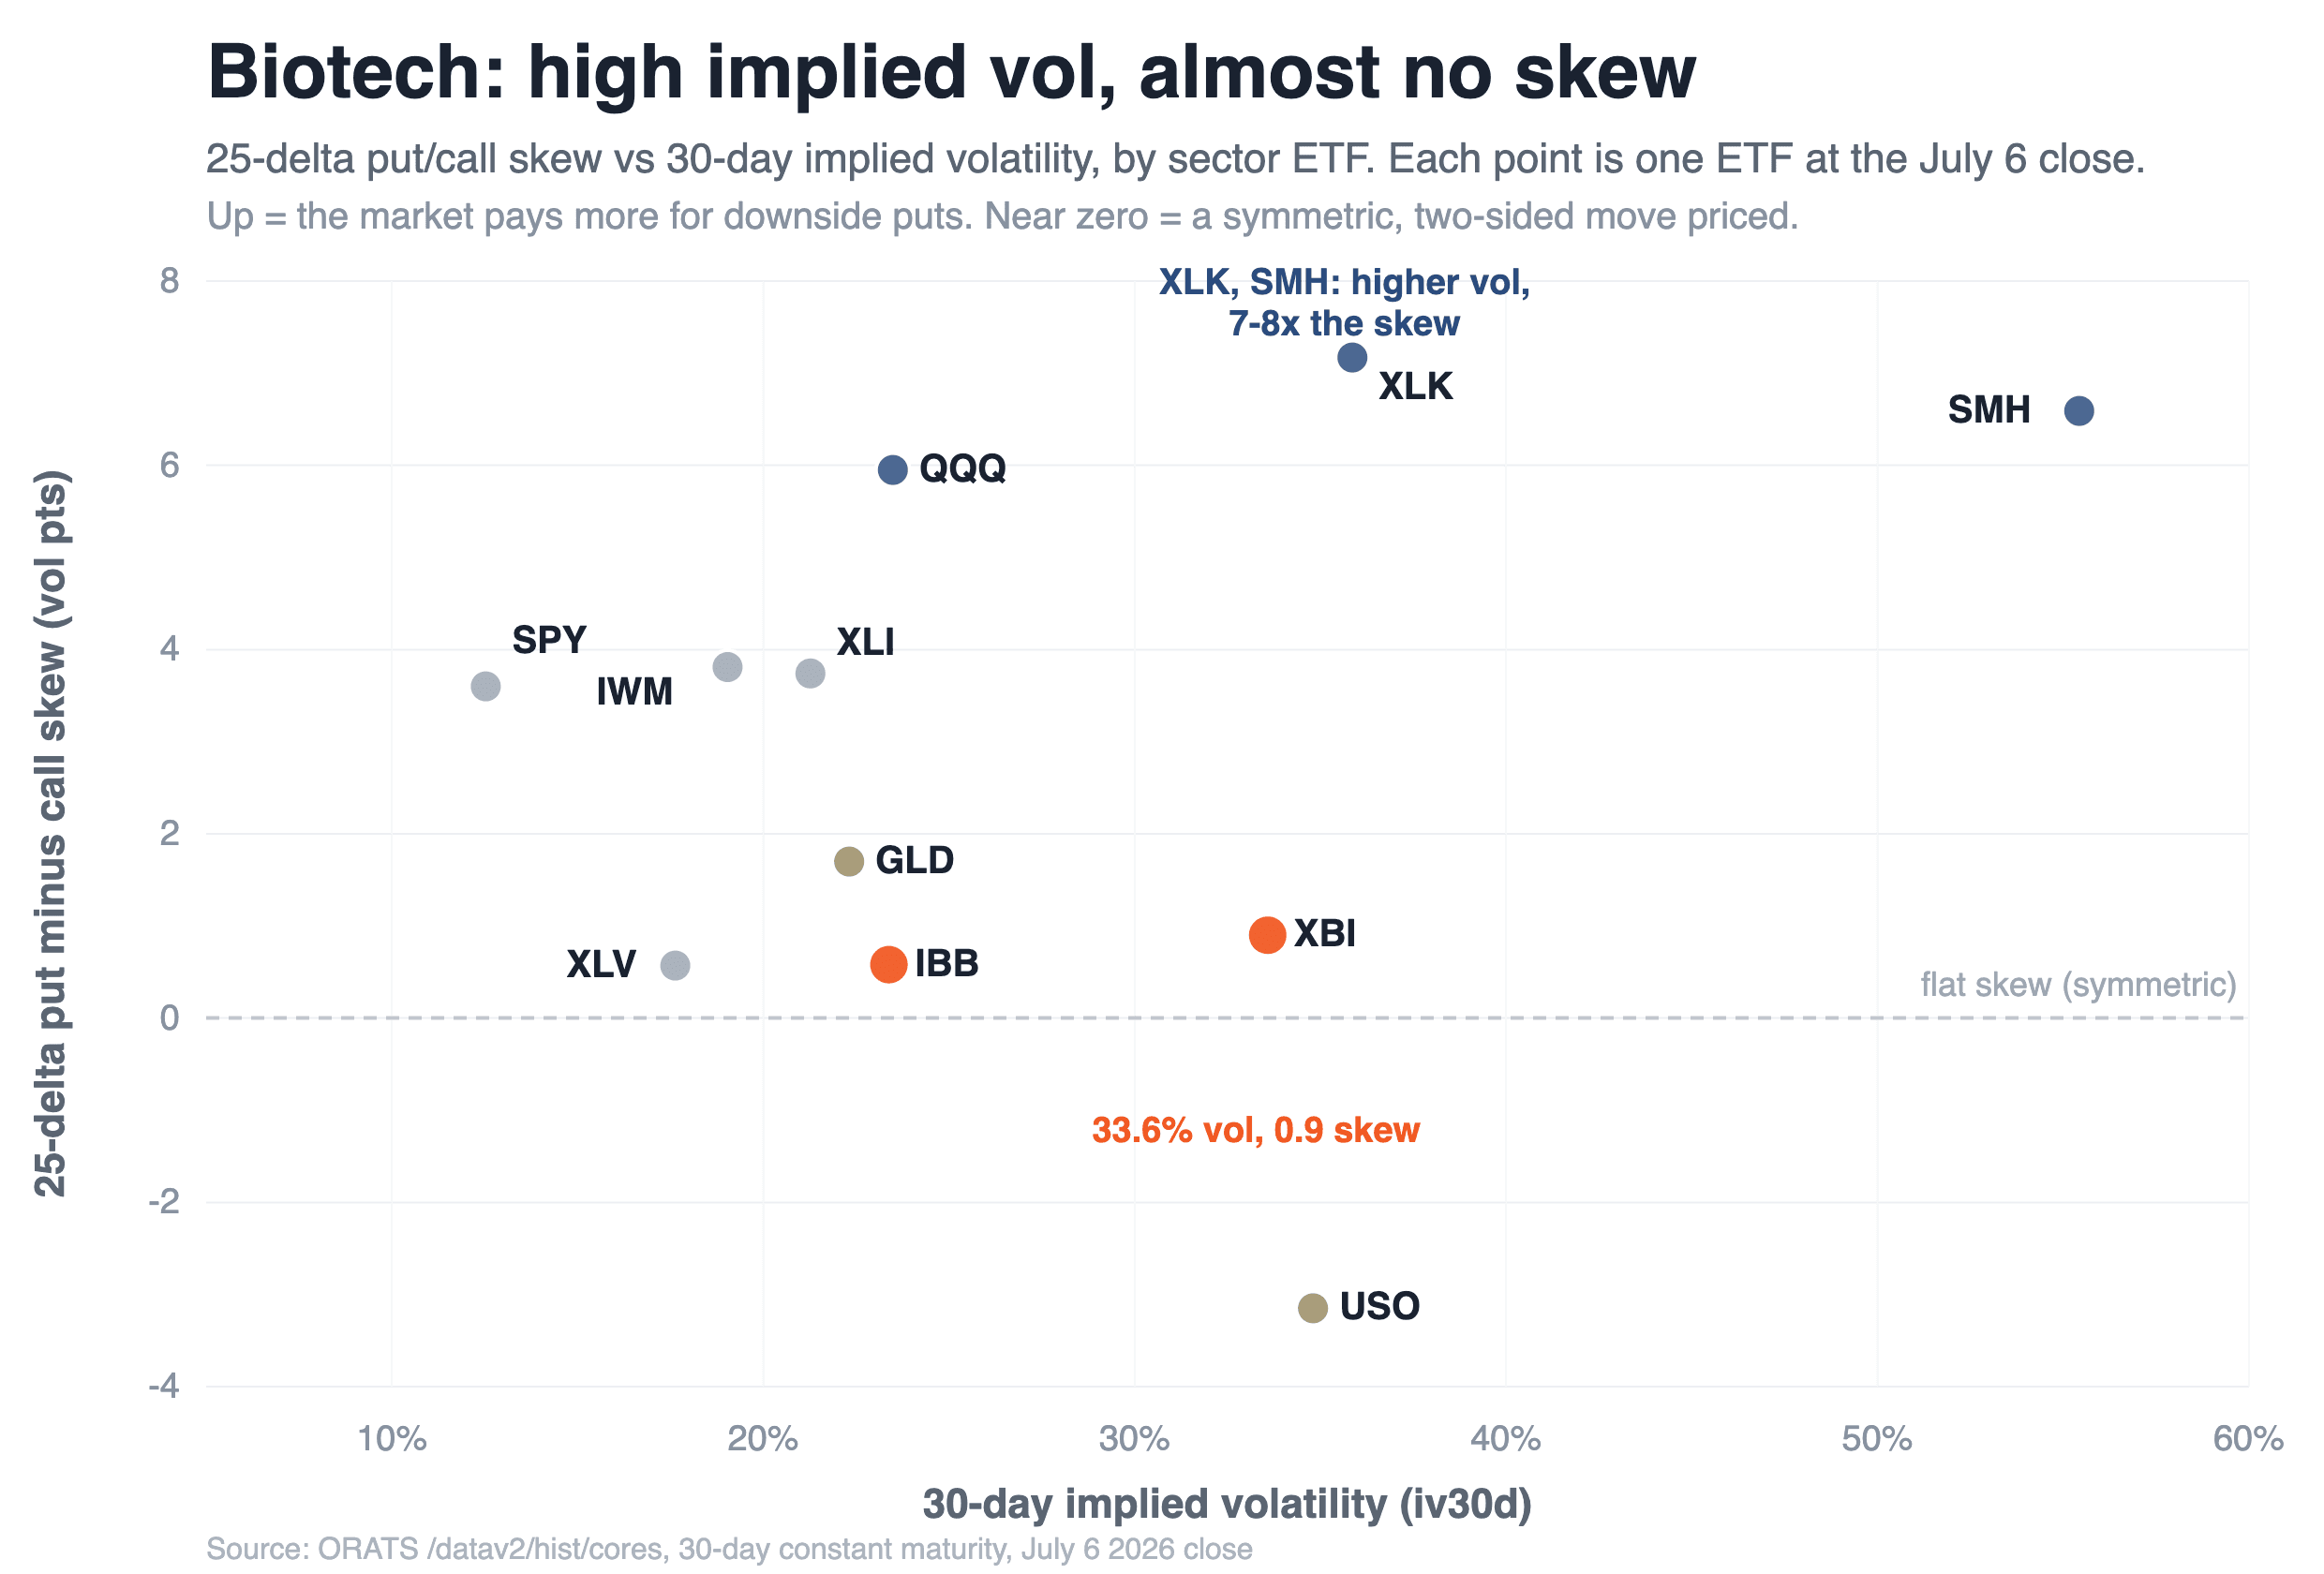
Scatter plot of 25-delta put minus call skew in vol points (vertical) against 30-day implied vol (horizontal) for eleven sector ETFs. XBI and IBB sit low near the dashed flat-skew line, XBI at high implied vol, while XLK, SMH, and QQQ sit high, SPY sits upper-left, and USO sits below zero.
Biotech (orange) carries high vol but near-zero skew, sitting with the commodities rather than the equity indexes. XLK and SMH carry higher vol yet 7 to 8 times the skew.
The reason is that biotech's risk is two-sided, and at the index level it lacks the correlated-crash risk that drives put skew: its names gap on their own catalysts, not together. The upside is live: M&A is running at its fastest pace since before Covid, the IPO window cracked open with more than a dozen biotechs public this year. The downside is the classic failed trial or rejected drug. Options price both, and open interest sits on calls and puts alike.
If you hold biotech, your downside puts are priced far closer to your calls than an S&P holder's are, because the basket is not braced for a one-way crash. That can cut the other way too, underpricing a correlated shock, a drug-pricing headline or a rate move that hits the whole group. This is a read on shape, not a trade: biotech is one of few high-vol corners pricing its risk as a coin flip.
Reproduce it: pull up XBI in the ORATS Outlook, read the Skew and Slope panels, then screen 25-delta skew against implied vol across sectors (from /datav2/hist/cores) and watch biotech land near the commodities.
$XBI $IBB $XLK $SMH $SPY $XLV
#Biotech #OptionsSkew #ImpliedVolatility #Volatility
Disclaimer:
The opinions and ideas presented herein are for informational and educational purposes only and should not be construed to represent trading or investment advice tailored to your investment objectives. You should not rely solely on any content herein and we strongly encourage you to discuss any trades or investments with your broker or investment adviser, prior to execution. None of the information contained herein constitutes a recommendation that any particular security, portfolio, transaction, or investment strategy is suitable for any specific person. Option trading and investing involves risk and is not suitable for all investors.
All opinions are based upon information and systems considered reliable, but we do not warrant the completeness or accuracy, and such information should not be relied upon as such. We are under no obligation to update or correct any information herein. All statements and opinions are subject to change without notice.
Past performance is not indicative of future results. We do not, will not and cannot guarantee any specific outcome or profit. All traders and investors must be aware of the real risk of loss in following any strategy or investment discussed herein.
Owners, employees, directors, shareholders, officers, agents or representatives of ORATS may have interests or positions in securities of any company profiled herein. Specifically, such individuals or entities may buy or sell positions, and may or may not follow the information provided herein. Some or all of the positions may have been acquired prior to the publication of such information, and such positions may increase or decrease at any time. Any opinions expressed and/or information are statements of judgment as of the date of publication only.
Day trading, short term trading, options trading, and futures trading are extremely risky undertakings. They generally are not appropriate for someone with limited capital, little or no trading experience, and/ or a low tolerance for risk. Never execute a trade unless you can afford to and are prepared to lose your entire investment. In addition, certain trades may result in a loss greater than your entire investment. Always perform your own due diligence and, as appropriate, make informed decisions with the help of a licensed financial professional.
Commissions, fees and other costs associated with investing or trading may vary from broker to broker. All investors and traders are advised to speak with their stock broker or investment adviser about these costs. Be aware that certain trades that may be profitable for some may not be profitable for others, after taking into account these costs. In certain markets, investors and traders may not always be able to buy or sell a position at the price discussed, and consequently not be able to take advantage of certain trades discussed herein.
Be sure to read the OCCs Characteristics and Risks of Standardized Options to learn more about options trading.
Related Posts