Trading
Tuesday, July 21st 2026
Momentum Investing: The Options Repriced It Faster Than Tech
MTUM options now price more volatility than the technology sector, with ORATS data showing a broad momentum-factor repricing driven by concentrated semiconductor exposure and a fast-moving selloff.
Summary
Momentum ETF MTUM now shows higher implied volatility than the tech sector, with a 30‑day IV of 37.99% versus XLK’s 34.58% and SPY’s 14.54%, reflecting a rapid repricing driven by heavy semiconductor exposure. The fund’s volatility has risen sharply over the year, outpacing other momentum and tech indexes, while its options pricing and slope metrics indicate elevated but fading risk. The analysis highlights the fast‑moving sell‑off, the concentration of high‑vol semiconductor holdings, and suggests cautious sizing for momentum‑factor strategies.
July 21, 2026
By Tyler Cheves
Momentum's options now price more volatility than the technology sector's. MTUM, iShares' momentum factor ETF, closed Monday at a 30-day implied vol of 37.99% against 34.58 for XLK, the Technology Select Sector SPDR, and 14.54 for SPY. That is the 98th percentile of MTUM's own year against a 21.11 median. MTUM had not closed above XLK in the prior year until May 19, then did on 31 of the 42 sessions since, by a median 2.06 points on those days (+0.79 across all 42), Monday's 3.41 the second-widest.
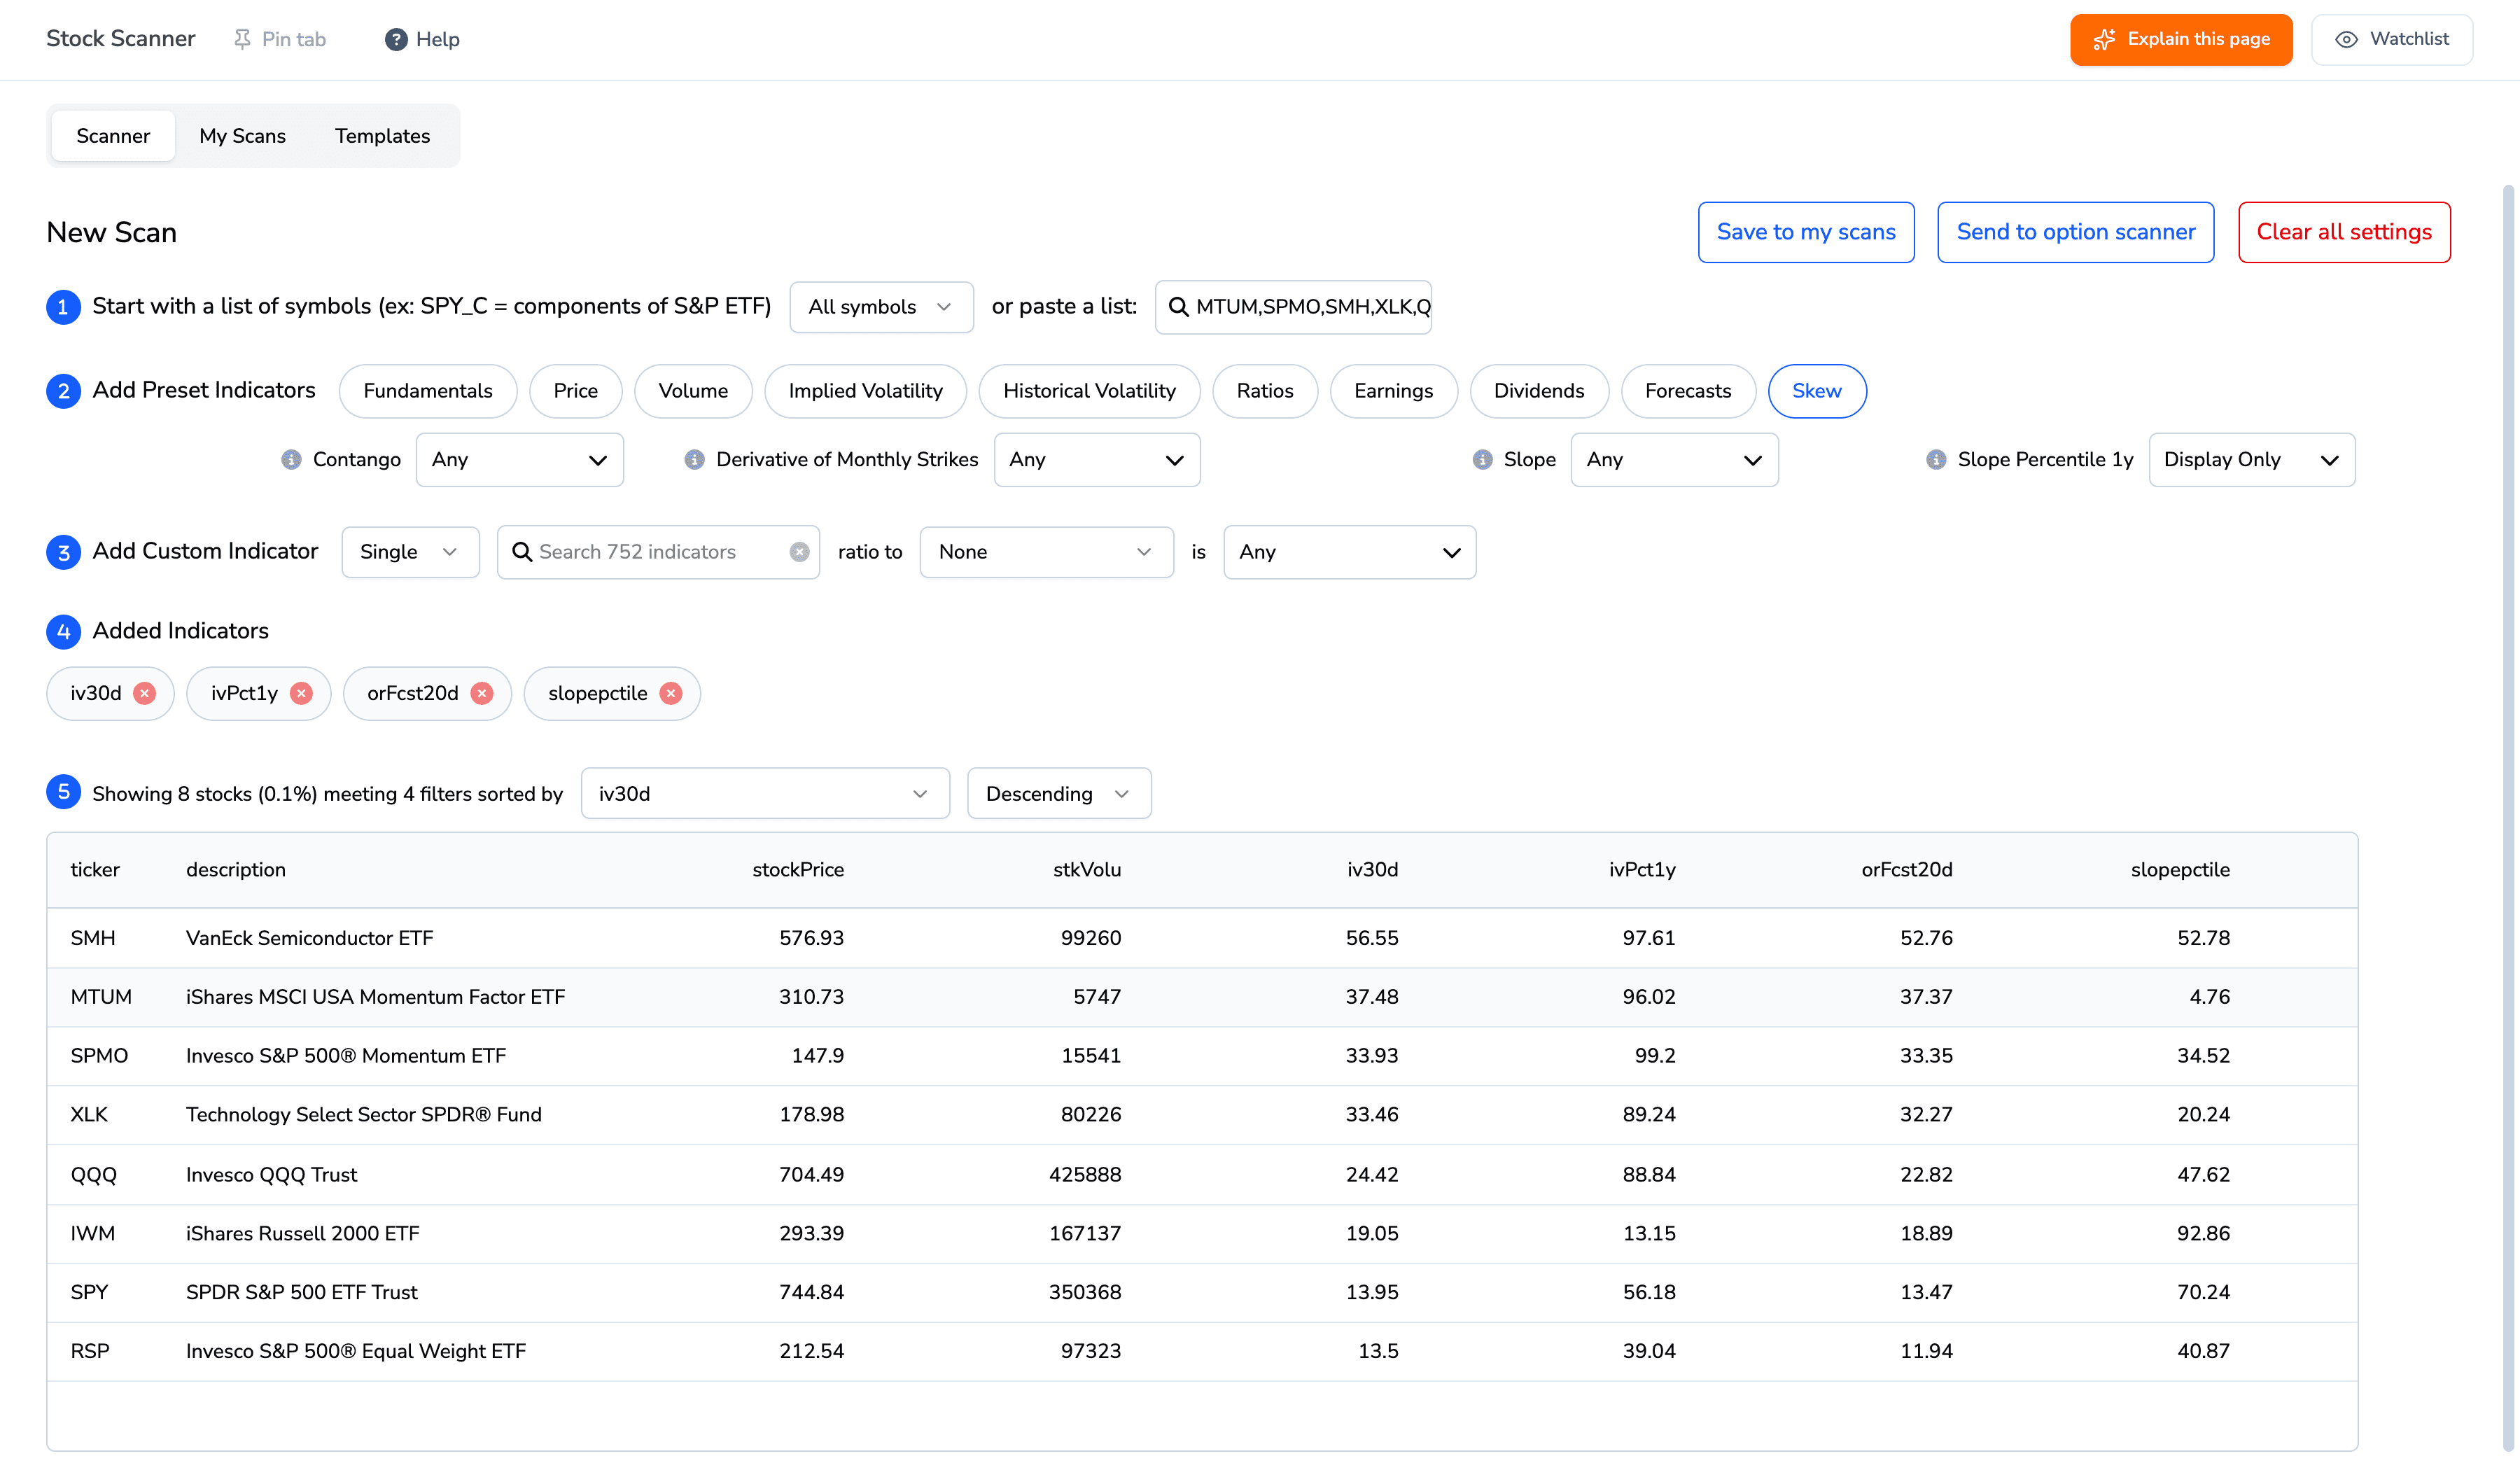
ORATS Stock Scanner results table listing eight ETFs sorted by 30-day implied volatility descending: SMH 56.55, MTUM 37.48, SPMO 33.93, XLK 33.46, QQQ 24.42, IWM 19.05, SPY 13.95, RSP 13.50, with columns for stock price, stock volume, IV percentile, 20-day stock volatility forecast and slope percentile.
Of the eight funds screened, only the semiconductor ETF prices more implied vol than momentum. Captured July 21 10:15 ET; the text quotes Monday's close and the slope percentile column is the live intraday read. Source: ORATS Stock Scanner, /datav2/cores.
The whole momentum factor re-rated, not just this fund
On monthly-mean iv30d the fund went 16.30 to 35.79 over the year (2.20x) while SPMO, a different momentum index, re-rated 2.24x, against XLK's 1.84x and SMH's 1.96x. Momentum re-rated about 1.2 times as fast as the tech sector.
Nothing here is mispriced. MTUM's implied vol over its 20-day realized-vol forecast (orFcst20d 37.32) is 1.02, mid-band on ORATS's 0.85 to 1.15 scale, and realized runs at or above it on both estimators, 42.01 close-to-close and 38.16 on the intraday Parkinson measure. The fund closed Monday 12.3% below its June 22 high.
Six of MTUM's ten largest holdings are semiconductors, carrying implied vols of 52 to 104, and they are 26.87% of a 130-stock fund (top ten 40.85%; weights via stockanalysis.com, July 16). Weight those ten by their own implied vols and you get 74.93, a perfect-correlation ceiling over the top-ten sleeve (70.76 stripping earnings). The fund trades at half of it.
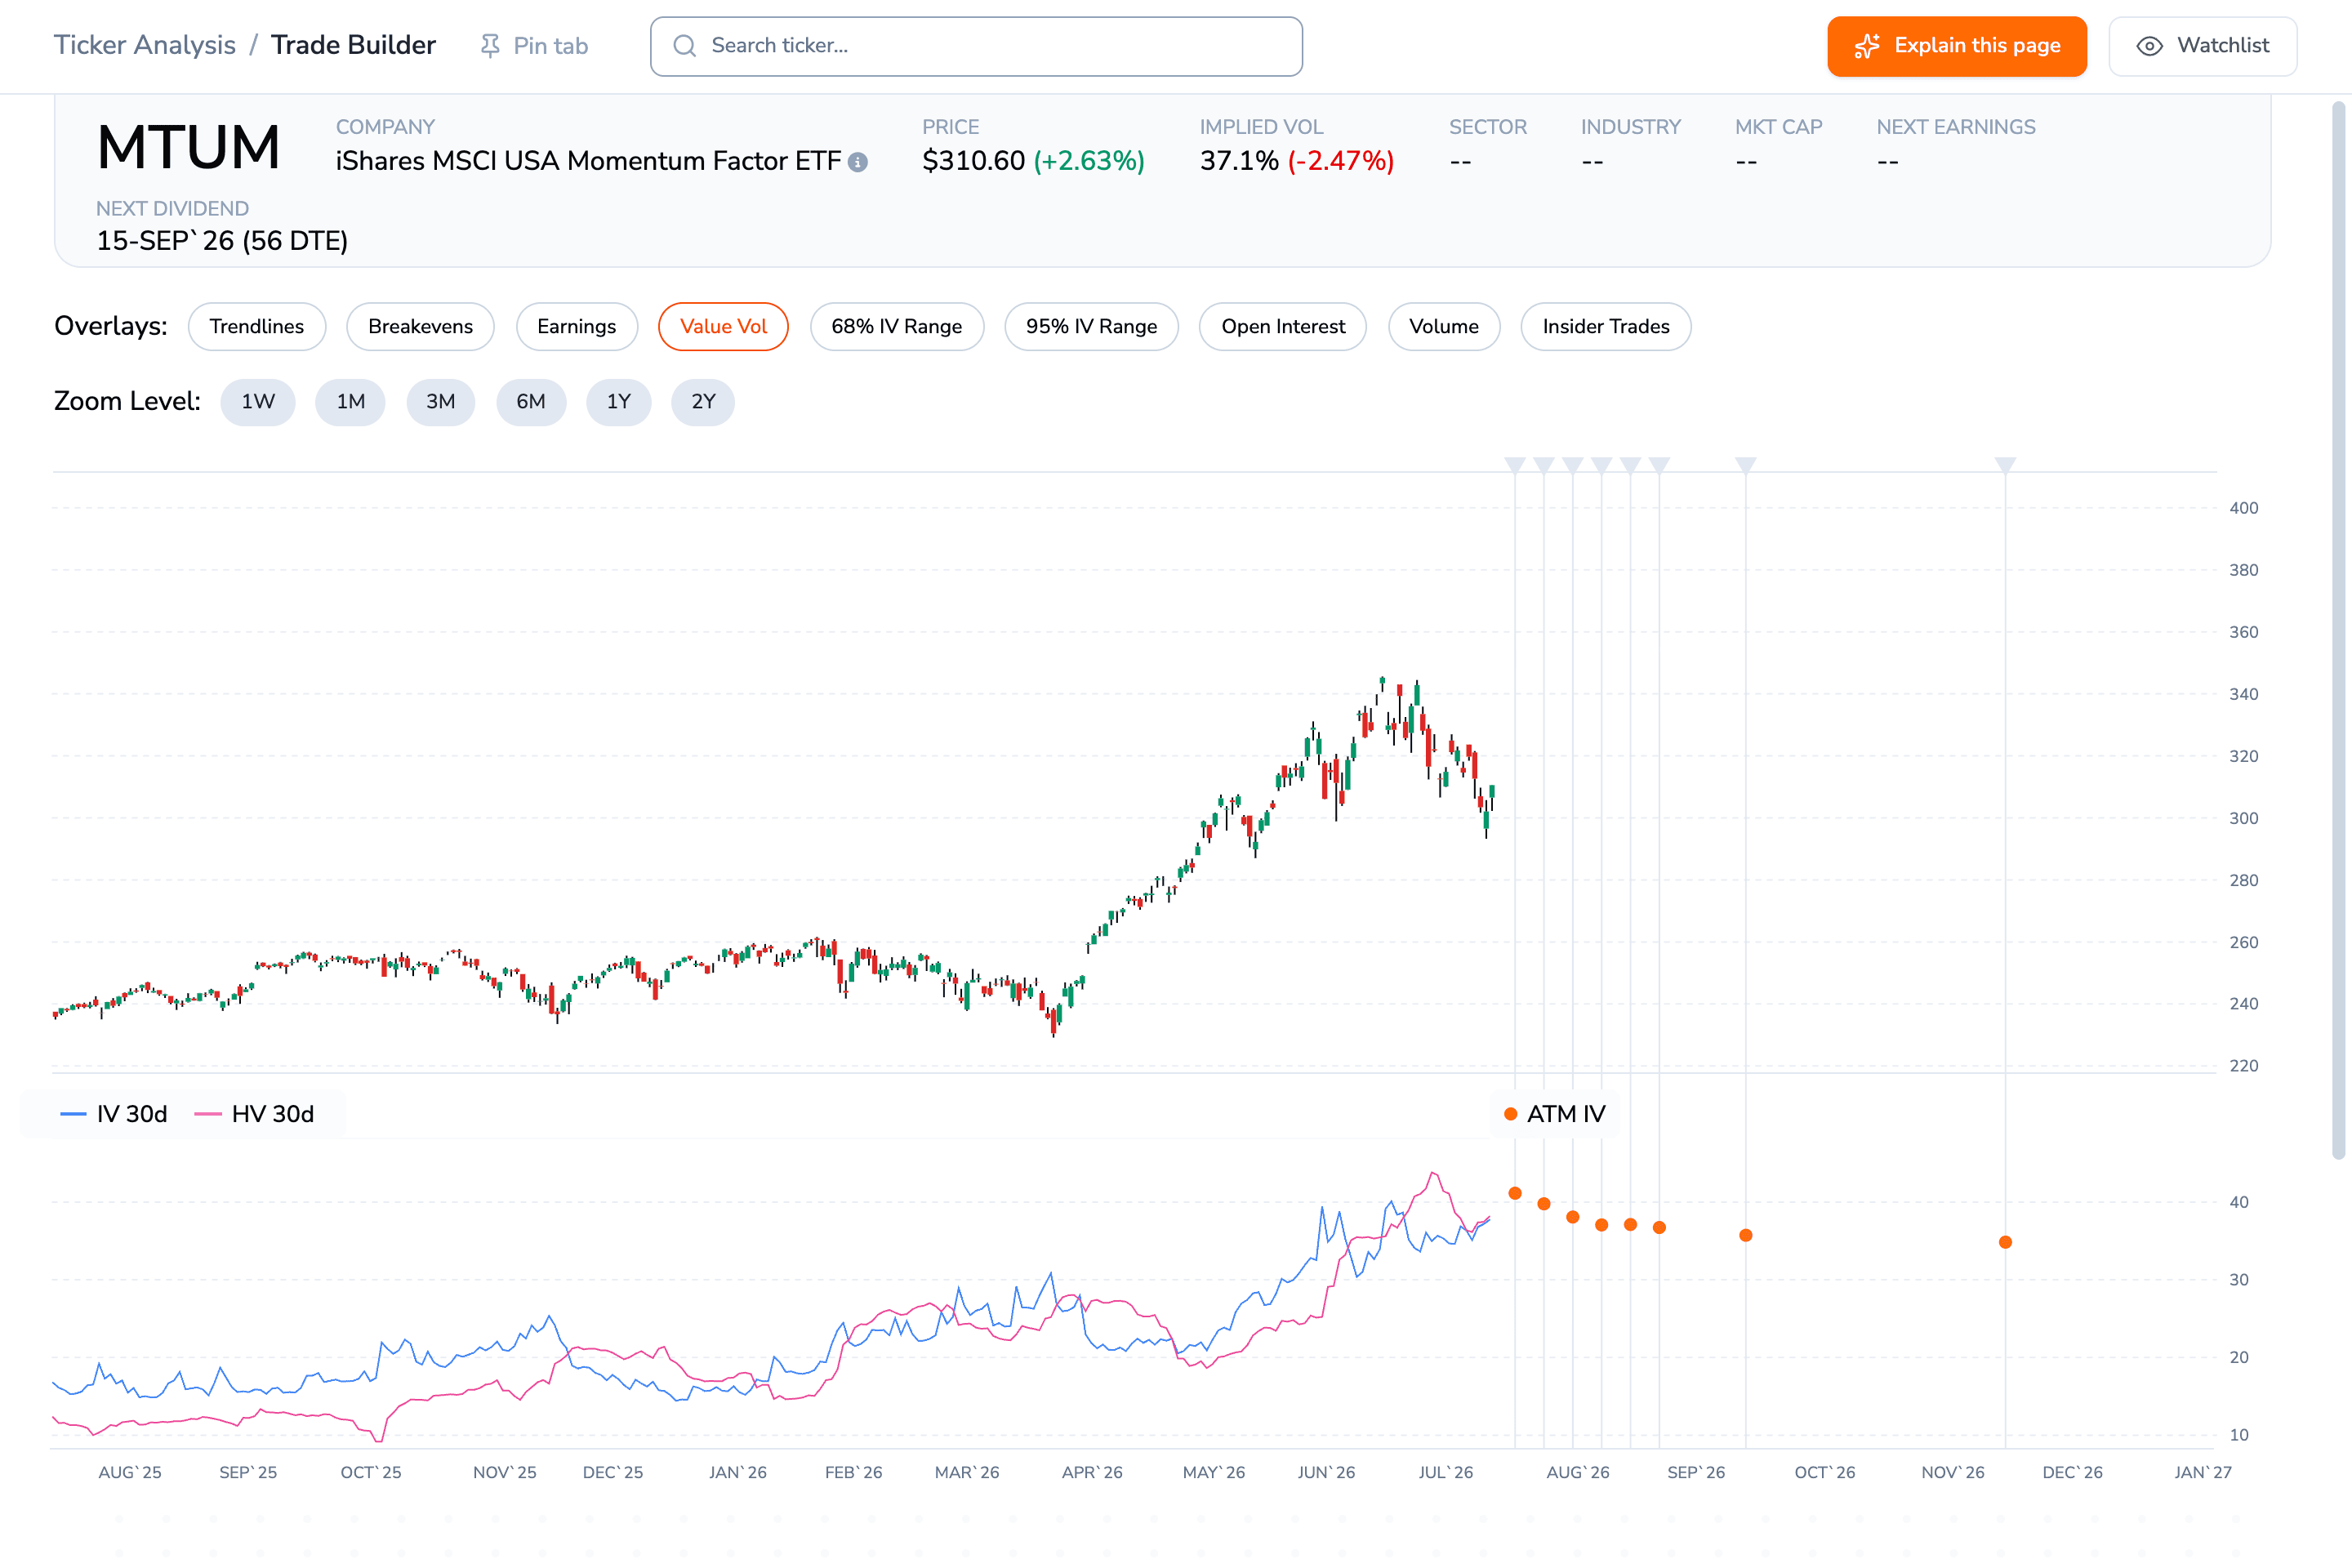
ORATS Trade Builder chart for MTUM. The upper panel shows a year of daily candles rising from about 240 last August to a June peak near 345 before rolling over to near 310. The lower panel shows the IV 30d line in blue starting in the mid-teens and the HV 30d line in pink starting lower, in the low teens, with both climbing to the high 30s and low 40s by July, and orange forward at-the-money implied vol dots trailing off to the right.
Implied vol climbs from the mid-teens last August and realized from the low teens, both into the high 30s. Live July 21 09:46 ET. Source: ORATS Trade Builder, /datav2/hist/cores.
The curve fades, and Monday's close barely charged for a reversal
At-the-money vol runs 42.0% at four days and decays to 33.5% at 179: elevated, and fading rather than a one-week event.
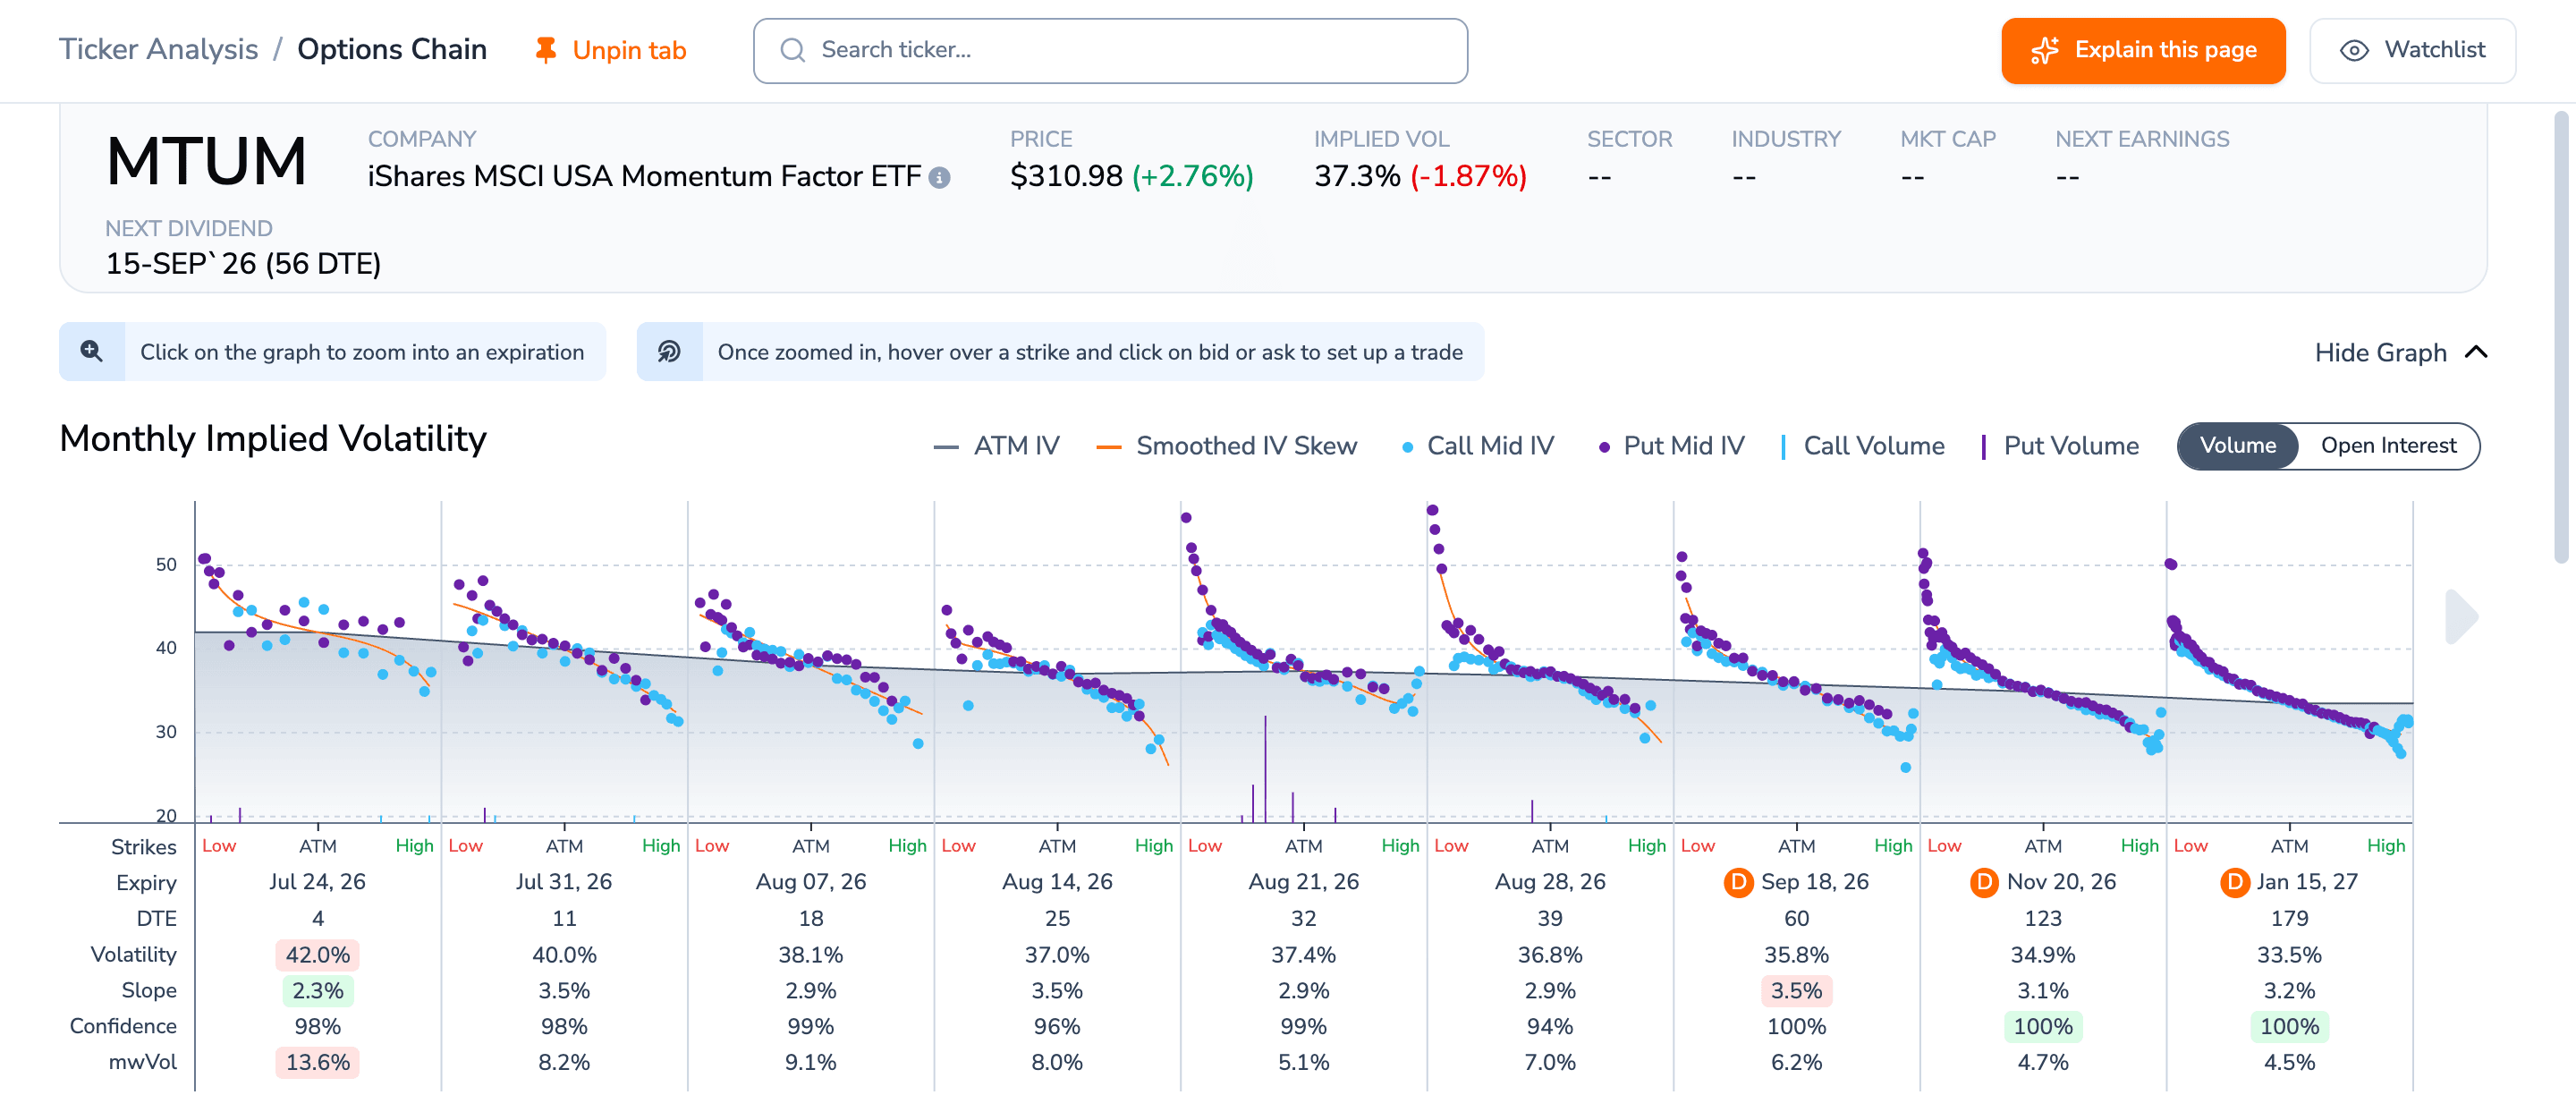
ORATS Options Chain page for MTUM showing a monthly implied volatility panel with nine expiration smiles of call and put mid implied vol, above a statistics row listing each expiry's days to expiration, at-the-money volatility, slope, confidence and market width in implied vol.
Every listed expiry from four to 179 days carries a per-expiry slope between 2.3 and 3.5. Live July 21 09:55 ET. Source: ORATS Options Chain, /datav2/live/strikes.
MTUM's 25-delta put-over-call spread is 5.33 vol points, close to SPY's 5.80, but only 14.0% of MTUM's at-the-money vol against SPY's 39.9% and XLK's 20.3%. Both readings carry the vol level, so I controlled for it directly on ORATS's constant-maturity 30-day slope. Monday's 2.80 is the 1.6th percentile of its year against a 5.80 median, and the median across its other 24 highest-vol sessions was 3.72, so most of that 3.0-point gap is the level and the residual is 0.9 points, with Monday under all 24. A momentum unwind's accident is a violent reversal, and Monday's close charged less for it than any of those 24 comparable sessions. By Tuesday midday the slope had firmed to 3.80, back to that conditional median, so read it as a Monday-close reading rather than a standing condition.
Three caveats. The 251-session window spans a portfolio that has turned over, so the percentile compares two baskets. The level control has no out-of-regime comparison: every session at this vol sits inside the same seven-week selloff. And MTUM trades 18,681 contracts a day against XLK's 23,510 and SPMO's 1,106.
If your factor sleeve prices at 2.6 times the index, stop sizing it like one. Reproduce it in the Stock Scanner: paste your tickers, add iv30d, orFcst20d and slopepctile as Display Only columns, and sort by implied vol.
$MTUM $SPMO $XLK $SPY $SMH
#Volatility #FactorInvesting #Momentum #ETFs #ImpliedVolatility #Skew
Disclaimer:
The opinions and ideas presented herein are for informational and educational purposes only and should not be construed to represent trading or investment advice tailored to your investment objectives. You should not rely solely on any content herein and we strongly encourage you to discuss any trades or investments with your broker or investment adviser, prior to execution. None of the information contained herein constitutes a recommendation that any particular security, portfolio, transaction, or investment strategy is suitable for any specific person. Option trading and investing involves risk and is not suitable for all investors.
All opinions are based upon information and systems considered reliable, but we do not warrant the completeness or accuracy, and such information should not be relied upon as such. We are under no obligation to update or correct any information herein. All statements and opinions are subject to change without notice.
Past performance is not indicative of future results. We do not, will not and cannot guarantee any specific outcome or profit. All traders and investors must be aware of the real risk of loss in following any strategy or investment discussed herein.
Owners, employees, directors, shareholders, officers, agents or representatives of ORATS may have interests or positions in securities of any company profiled herein. Specifically, such individuals or entities may buy or sell positions, and may or may not follow the information provided herein. Some or all of the positions may have been acquired prior to the publication of such information, and such positions may increase or decrease at any time. Any opinions expressed and/or information are statements of judgment as of the date of publication only.
Day trading, short term trading, options trading, and futures trading are extremely risky undertakings. They generally are not appropriate for someone with limited capital, little or no trading experience, and/ or a low tolerance for risk. Never execute a trade unless you can afford to and are prepared to lose your entire investment. In addition, certain trades may result in a loss greater than your entire investment. Always perform your own due diligence and, as appropriate, make informed decisions with the help of a licensed financial professional.
Commissions, fees and other costs associated with investing or trading may vary from broker to broker. All investors and traders are advised to speak with their stock broker or investment adviser about these costs. Be aware that certain trades that may be profitable for some may not be profitable for others, after taking into account these costs. In certain markets, investors and traders may not always be able to buy or sell a position at the price discussed, and consequently not be able to take advantage of certain trades discussed herein.
Be sure to read the OCCs Characteristics and Risks of Standardized Options to learn more about options trading.
Related Posts