Trading
Wednesday, July 15th 2026
Two Ways to Measure the Same Volatility, Two Different Answers
QQQ’s implied volatility can fail an IV rank screen and clear an IV percentile screen at the same time, because the two measures answer different questions.
Summary
The article explains that IV rank and IV percentile measure different aspects of implied volatility—rank reflects the distance of today’s vol within its historical range, while percentile counts how many past sessions were at or below the current level—resulting in often divergent values; it advises using percentile as the primary screen because rank thresholds are stricter, and demonstrates this with QQQ, SPY, IWM, and DIA examples.
By Tyler Cheves
The Nasdaq-100 handed me two answers to the same question this afternoon. At 2:45 PM ET QQQ's 20-day ex-earnings implied vol was 22.58%, and that single number scored an IV rank of 56.90 and an IV percentile of 77.69. Put your rich threshold at 70, a common setting, and the same ticker on the same tick fails one column and clears the other.
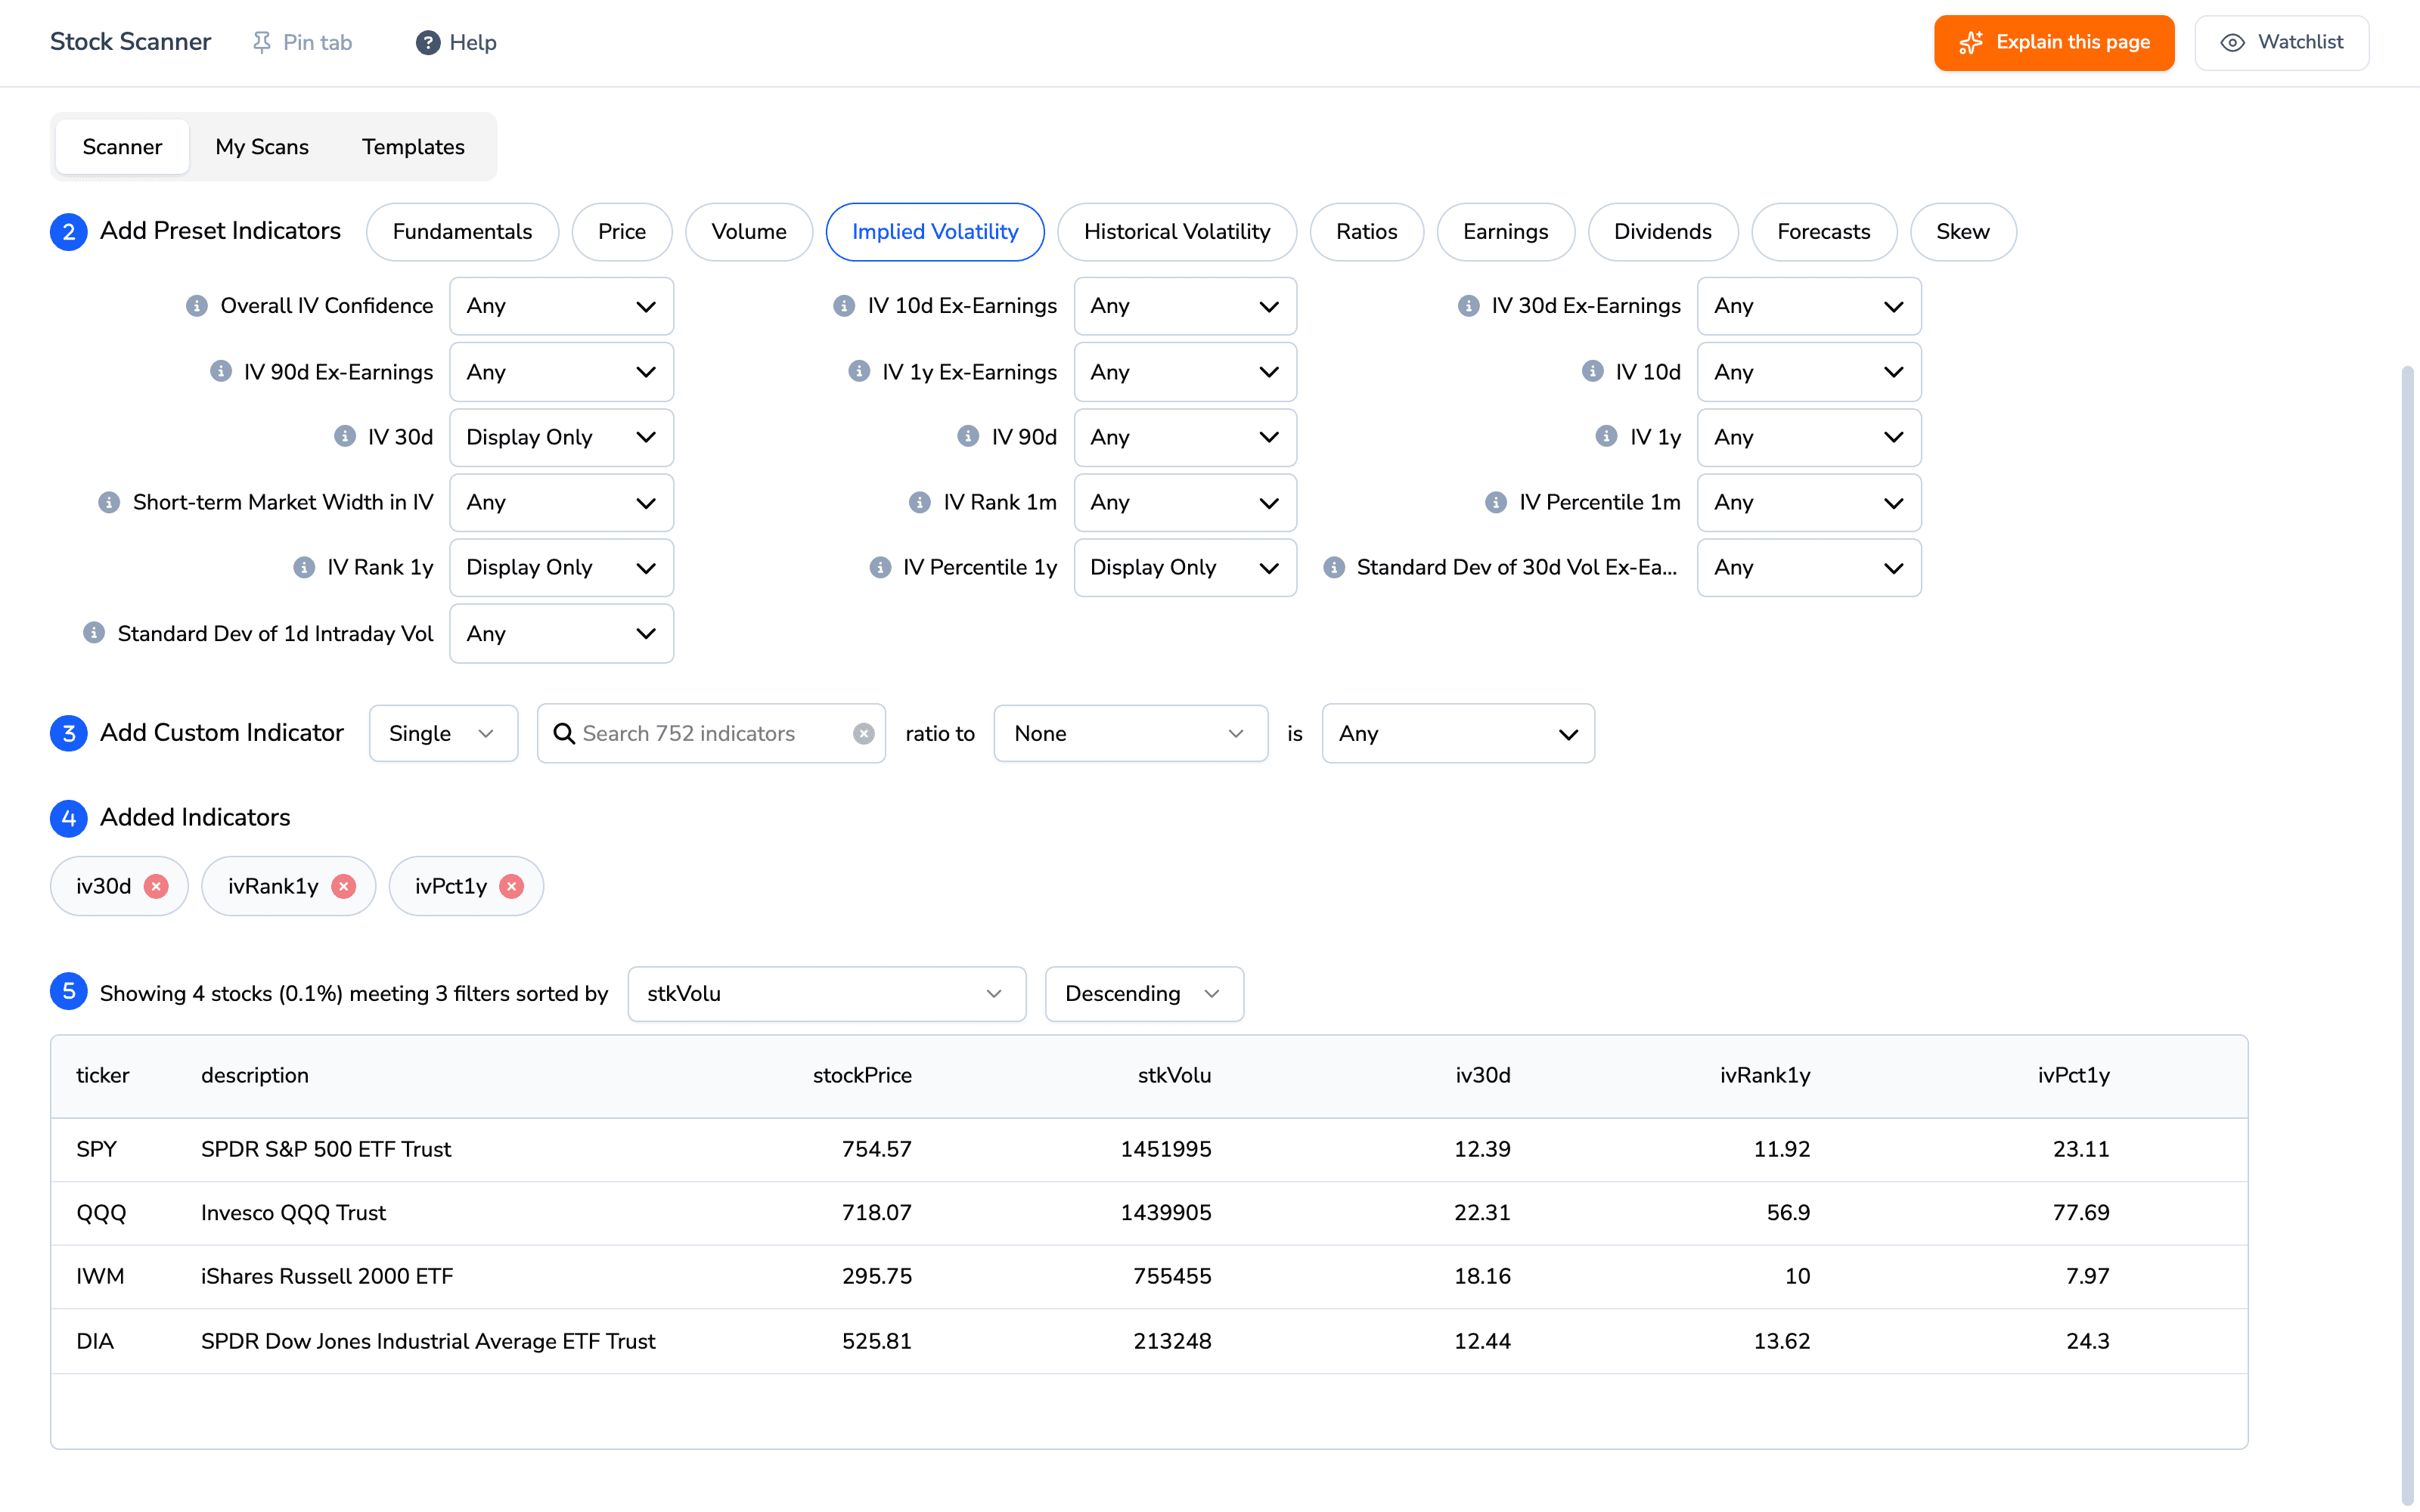
A Stock Scanner results table listing four index ETFs with columns for ticker, description, stock price, stock volume, iv30d, ivRank1y and ivPct1y. SPY shows 12.39 implied vol at rank 11.92 and percentile 23.11, QQQ shows 22.31 at rank 56.9 and percentile 77.69, IWM shows 18.16 at rank 10 and percentile 7.97, and DIA shows 12.44 at rank 13.62 and percentile 24.3.
Both columns, live 2:54 PM ET, added as display-only. The iv30d column is a different series from the basis the rank columns score, which is why QQQ reads 22.31 here against 22.58 above. Source: /datav2/ivrank.
Both readings are correct. Rank and percentile measure different things.
Rank measures distance. It asks where today sits between the lowest and highest vol of the 251 settled sessions behind it: current minus the low, divided by the high minus the low.
Percentile counts days. It asks how many of those 251 sessions settled at or below today's tick.
Distance and count only agree when vol is spread evenly across its range, and it never is.
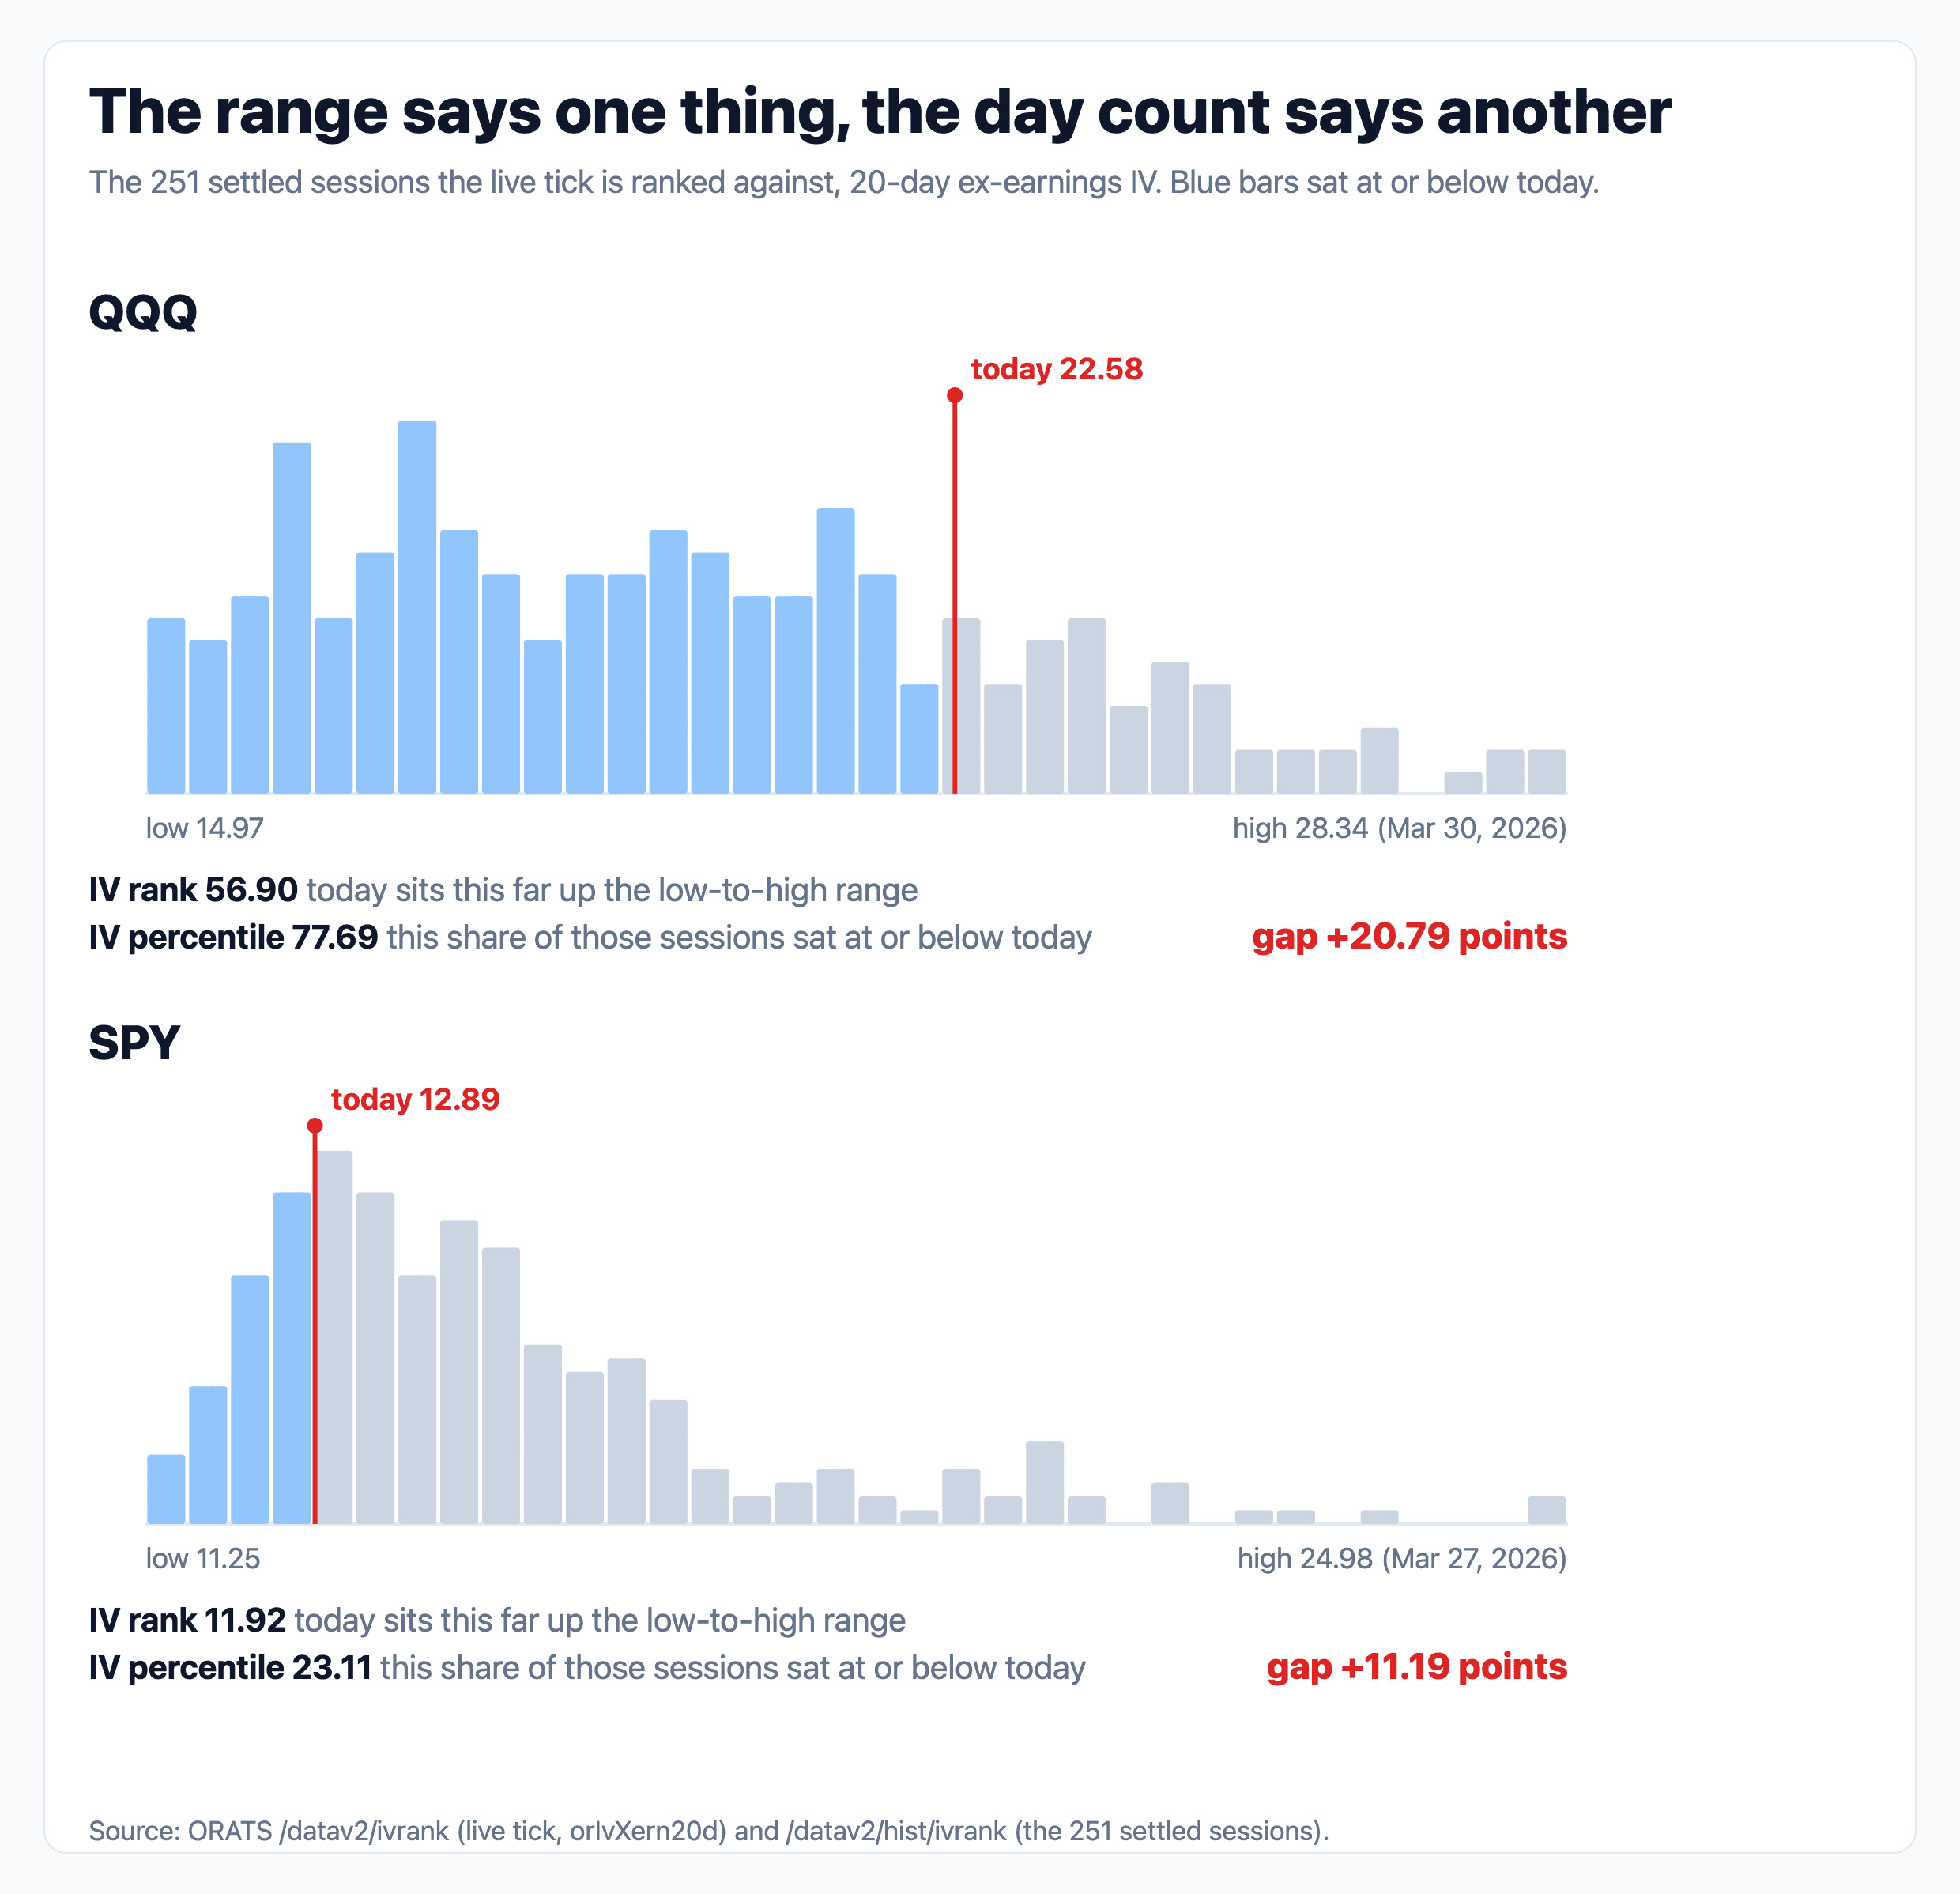
Two histograms of the 251 settled sessions of 20-day ex-earnings implied vol behind today's tick, QQQ on top and SPY below, each drawn across its own low-to-high range with sessions at or below today shaded blue and a red line marking today. QQQ's today line at 22.58 sits right of center with a thin scattered tail running out to a high of 28.34. SPY's today line at 12.89 sits far left with a tall cluster beside it and a long nearly empty tail stretching to a high of 24.98.
The top of each range is a genuine print almost no session revisited, which is the whole disagreement. Source: /datav2/ivrank live tick, /datav2/hist/ivrank distribution.
QQQ's year runs from 14.97% last August to 28.34% on March 30. Today sits 43.1% of the way below that ceiling, but only 22.3% of the sessions were above it. Rank reads that thin tail as room to run and marks QQQ down to 56.90.
SPY is the same trick, cheaper. Its ceiling is 24.98% from the March selloff, a level it has spent almost no time near, so rank reports 11.92 while percentile says 23.11. The gap is 11.19 against QQQ's 20.79.
Which column should you screen on?
That's the wrong question, and the history says so. Of the 295 QQQ sessions where rank cleared 70, percentile had already cleared it on all 295, and the same held on all 398 such sessions on SPY. Percentile cleared alone 907 and 1,095 times.
Rank clearing 70 implies percentile cleared it first, so choosing rank picks a stricter gate rather than a second opinion. The only breaks anywhere in this complex are three IWM sessions in early 2008, before QQQ's history even starts.
One ORATS surface has already picked. Of the three signals behind the Outlook's IV call, one reads percentile and none reads rank.
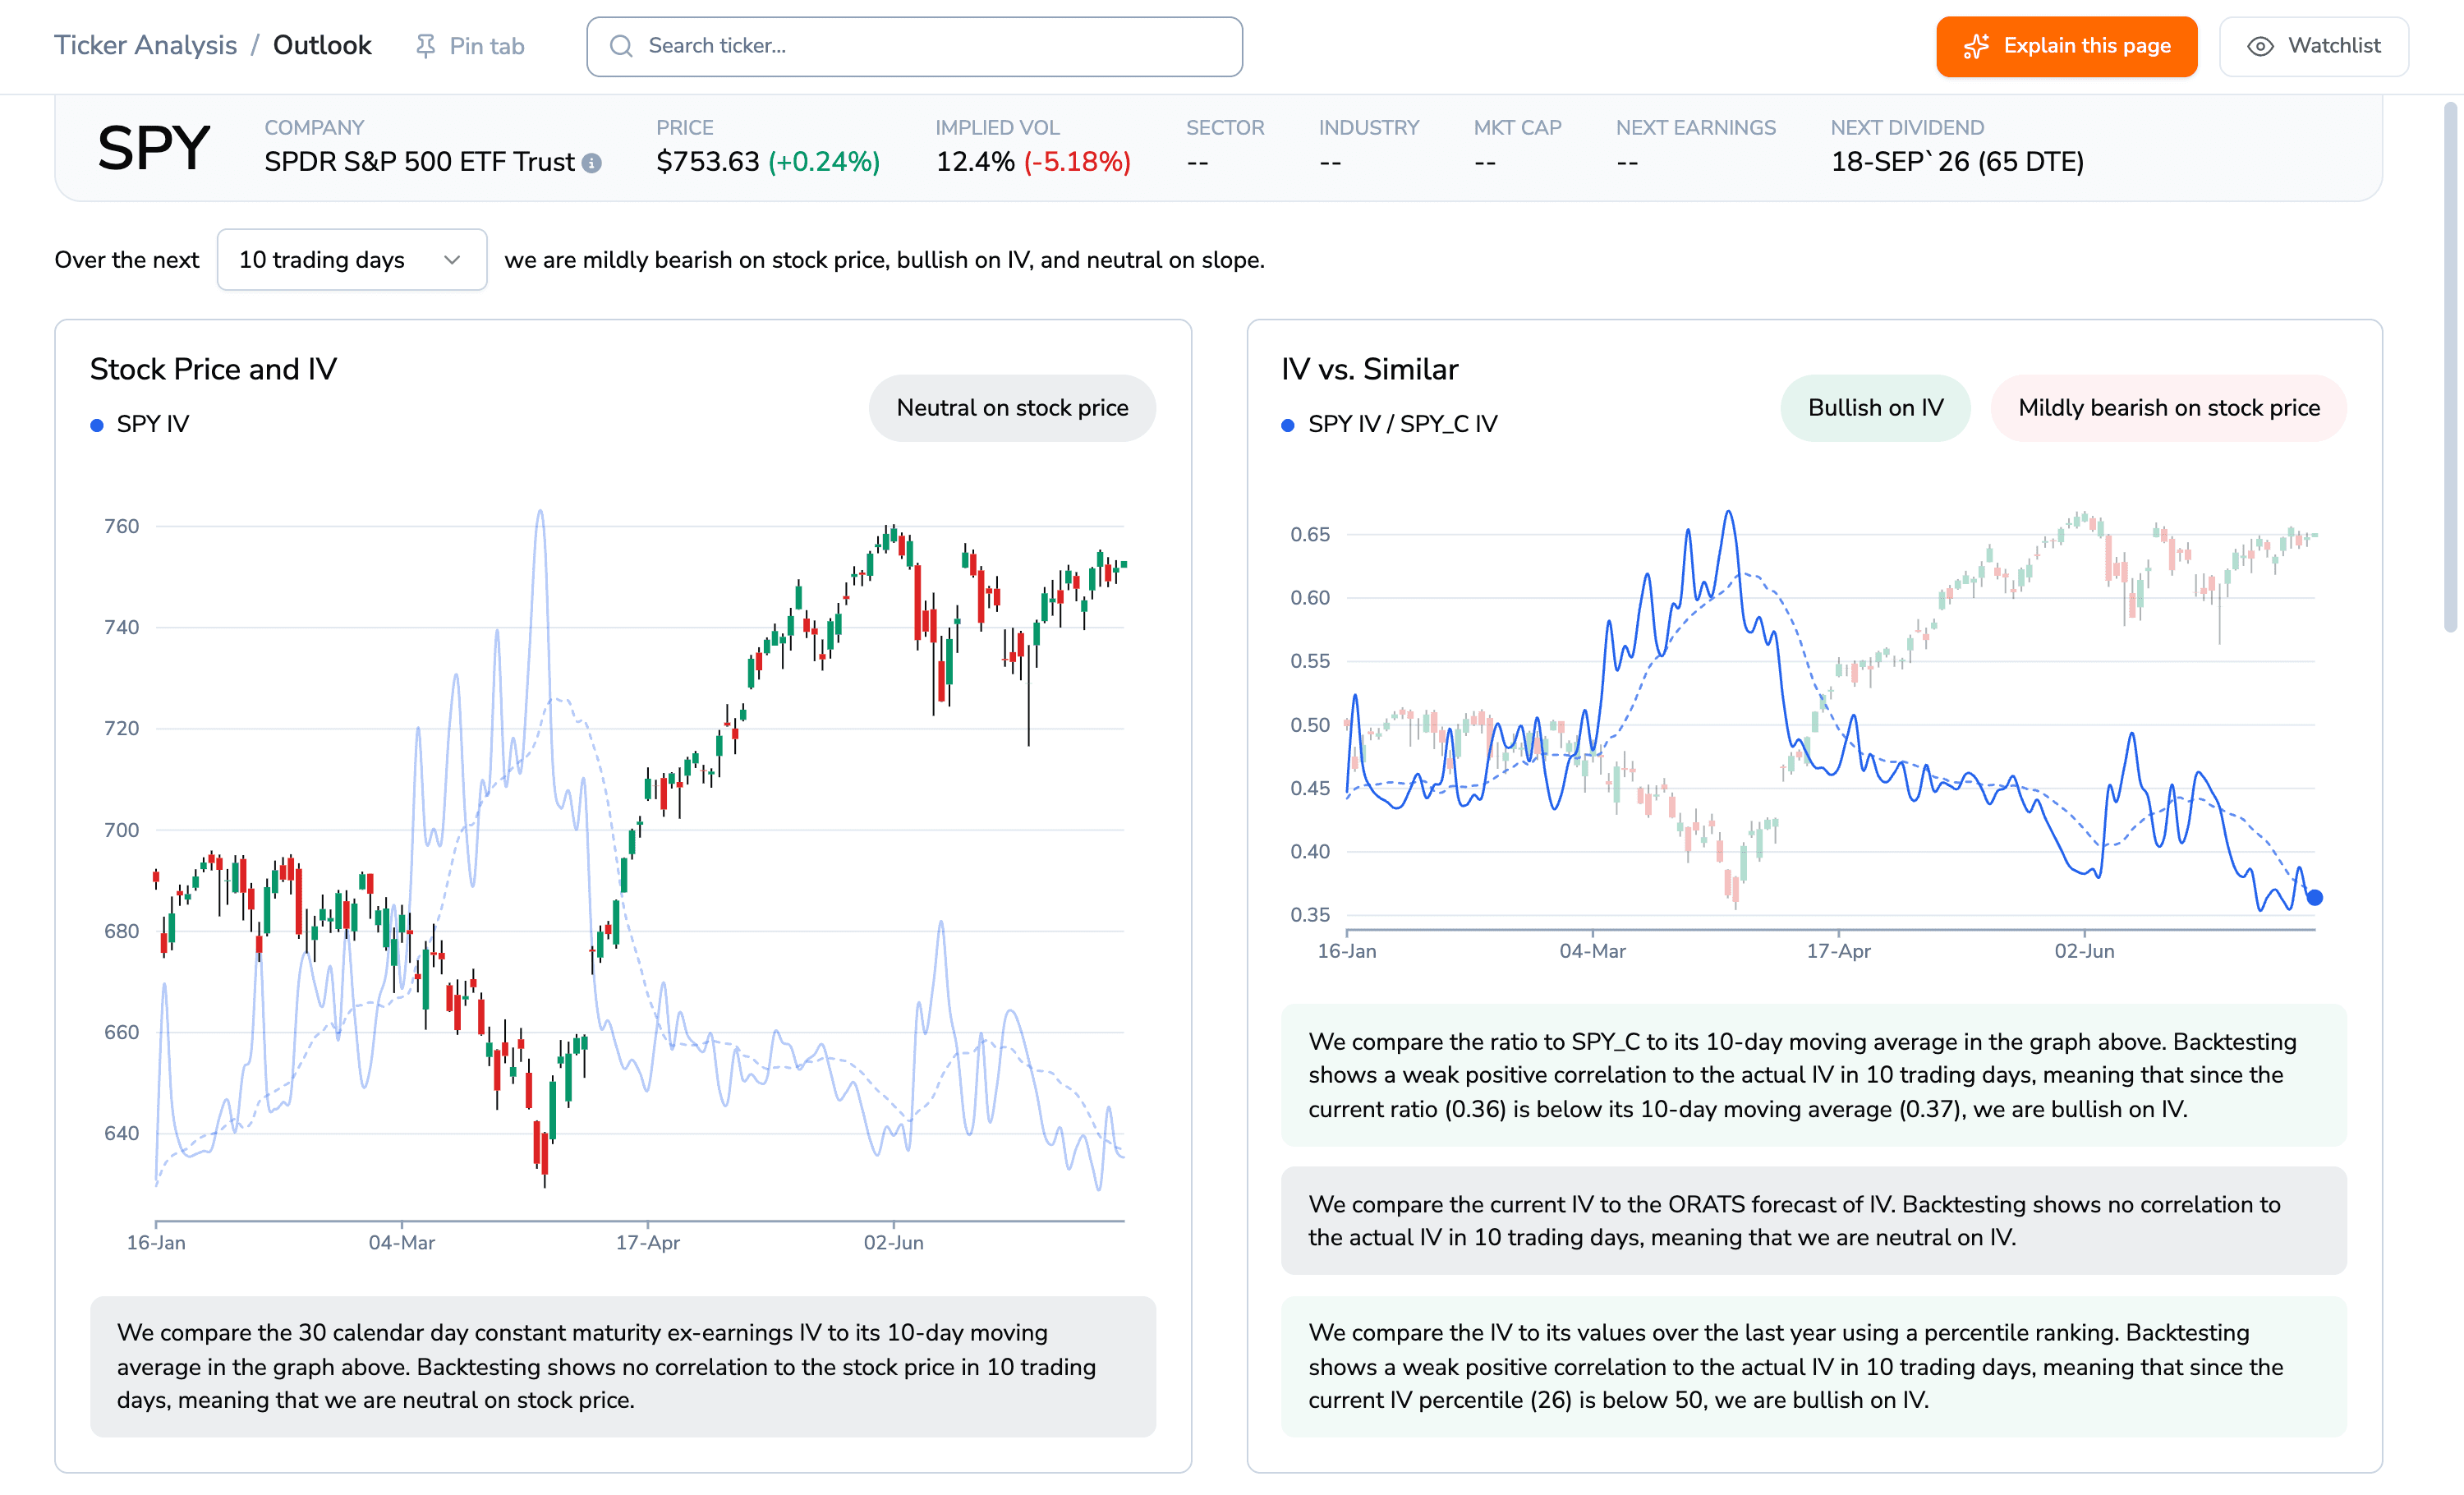
The ORATS Outlook page for SPY showing price 753.63 up 0.24% and implied vol 12.4%, with a Stock Price and IV chart and an IV vs Similar chart. The note under the second chart reads that comparing IV to its values over the last year using a percentile ranking, and since the current IV percentile of 26 is below 50, we are bullish on IV.
The Outlook, live 3:03 PM ET. Its percentile box reads 26 against the 23.11 above, a different computation on a later tick. Source: /datav2/live/cores for the header tick, /datav2/hist/cores for the charts.
That late-March panic set the ceiling for all four ETFs, rescaling every rank reading underneath it. Percentile counts it once.
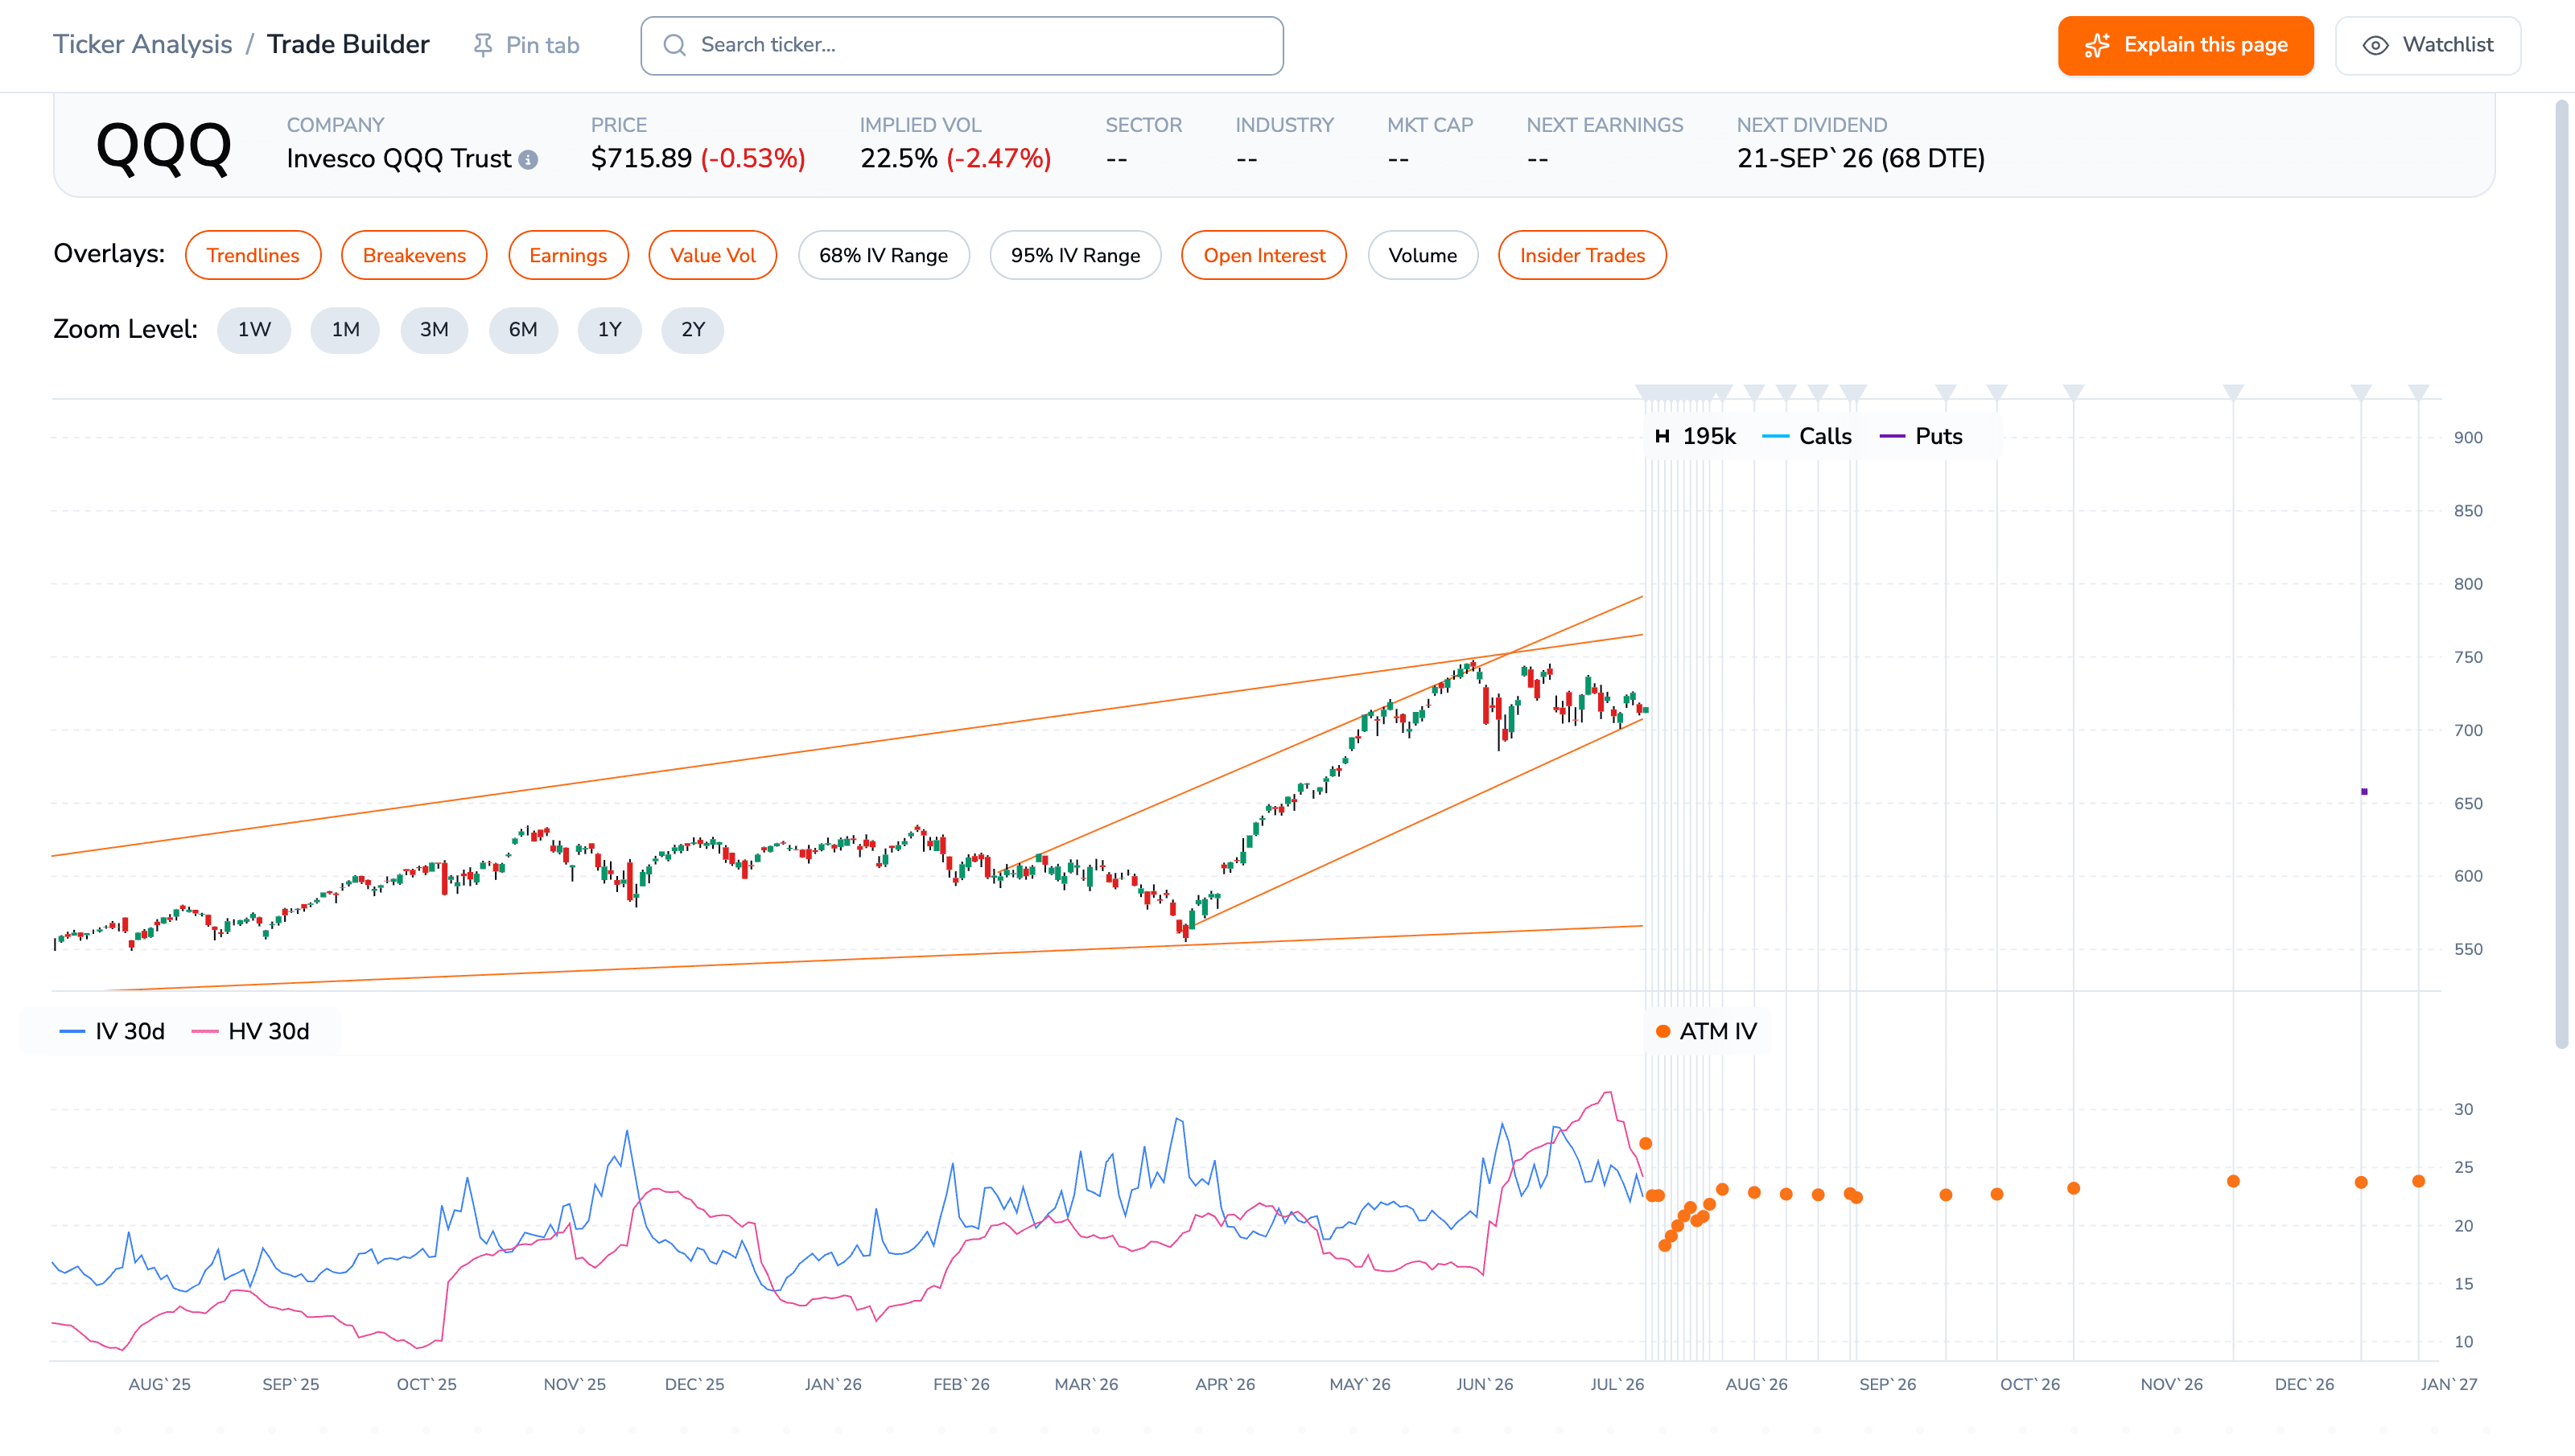
A Trade Builder view of QQQ, live 2:56 PM ET, with a candlestick chart from August 2025 to July 2026 climbing from about 550 to about 716 and a lower panel plotting a blue IV 30d line and a pink HV 30d line. The IV line spends most of the year between 15 and 25 with sharp spikes near 29 in late March and again in June.
QQQ's IV path, live 2:56 PM ET. This panel plots iv30d, a different series from the 20-day ex-earnings basis the rank uses; both peak in late March. Source: /datav2/hist/cores for the path, /datav2/live/cores for the header.
Don't read the gap as a signal
Percentile has run above rank on 86.3% of QQQ's 3,846 sessions since 2011, averaging 22.5 points when it does, and today's 20.79 is merely the 56th percentile across all of them. A gap this wide is the resting state of an index, and IWM's rank tops its percentile on one session in five.
What moves the verdict is your threshold. A rank filter and a percentile filter set to the same number are not the same filter. I'd read percentile first, since it's the column one bad week in March cannot quietly rescale.
Rebuild it in the ORATS Stock Scanner: paste QQQ, SPY, IWM and DIA, then add IV 30d, IV Rank 1y and IV Percentile 1y as display-only columns.
$QQQ $SPY $IWM $DIA
#Volatility #ImpliedVolatility #OptionsTrading #VolatilityScreening
Disclaimer:
The opinions and ideas presented herein are for informational and educational purposes only and should not be construed to represent trading or investment advice tailored to your investment objectives. You should not rely solely on any content herein and we strongly encourage you to discuss any trades or investments with your broker or investment adviser, prior to execution. None of the information contained herein constitutes a recommendation that any particular security, portfolio, transaction, or investment strategy is suitable for any specific person. Option trading and investing involves risk and is not suitable for all investors.
All opinions are based upon information and systems considered reliable, but we do not warrant the completeness or accuracy, and such information should not be relied upon as such. We are under no obligation to update or correct any information herein. All statements and opinions are subject to change without notice.
Past performance is not indicative of future results. We do not, will not and cannot guarantee any specific outcome or profit. All traders and investors must be aware of the real risk of loss in following any strategy or investment discussed herein.
Owners, employees, directors, shareholders, officers, agents or representatives of ORATS may have interests or positions in securities of any company profiled herein. Specifically, such individuals or entities may buy or sell positions, and may or may not follow the information provided herein. Some or all of the positions may have been acquired prior to the publication of such information, and such positions may increase or decrease at any time. Any opinions expressed and/or information are statements of judgment as of the date of publication only.
Day trading, short term trading, options trading, and futures trading are extremely risky undertakings. They generally are not appropriate for someone with limited capital, little or no trading experience, and/ or a low tolerance for risk. Never execute a trade unless you can afford to and are prepared to lose your entire investment. In addition, certain trades may result in a loss greater than your entire investment. Always perform your own due diligence and, as appropriate, make informed decisions with the help of a licensed financial professional.
Commissions, fees and other costs associated with investing or trading may vary from broker to broker. All investors and traders are advised to speak with their stock broker or investment adviser about these costs. Be aware that certain trades that may be profitable for some may not be profitable for others, after taking into account these costs. In certain markets, investors and traders may not always be able to buy or sell a position at the price discussed, and consequently not be able to take advantage of certain trades discussed herein.
Be sure to read the OCCs Characteristics and Risks of Standardized Options to learn more about options trading.
Related Posts