Trading
Wednesday, July 22nd 2026
Oil Volatility: A Record Spike But Is There More To Come?
USO volatility has reached an extreme versus SPY, yet ORATS history shows the ratio says far more about oil’s own premium than where equity volatility goes next.
Summary
Oil volatility spiked to a record level, with USO’s implied volatility 4.8 times the S&P 500’s and the oil‑to‑equity volatility ratio reaching the 94.6th percentile, but the ratio provides little forward insight into equity volatility; forward realized versus implied ratios remain flat across deciles, and recent sessions show mixed predictive power, indicating the high ratio is not a reliable signal for future market moves.

July 22, 2026
By Tyler Cheves
USO's implied volatility settled Tuesday at 4.8 times the S&P 500's, the 99th percentile of 4,825 sessions of ORATS history. Rank those sessions by the ratio and it tells you almost nothing about what equity vol does next: the correlation with the S&P's forward realized over its implied is 0.03. Every decile rounds to between 0.83 and 0.93, around an all-session median of 0.85, and a walk-forward version fires 786 times at 0.873 against that same 0.853.
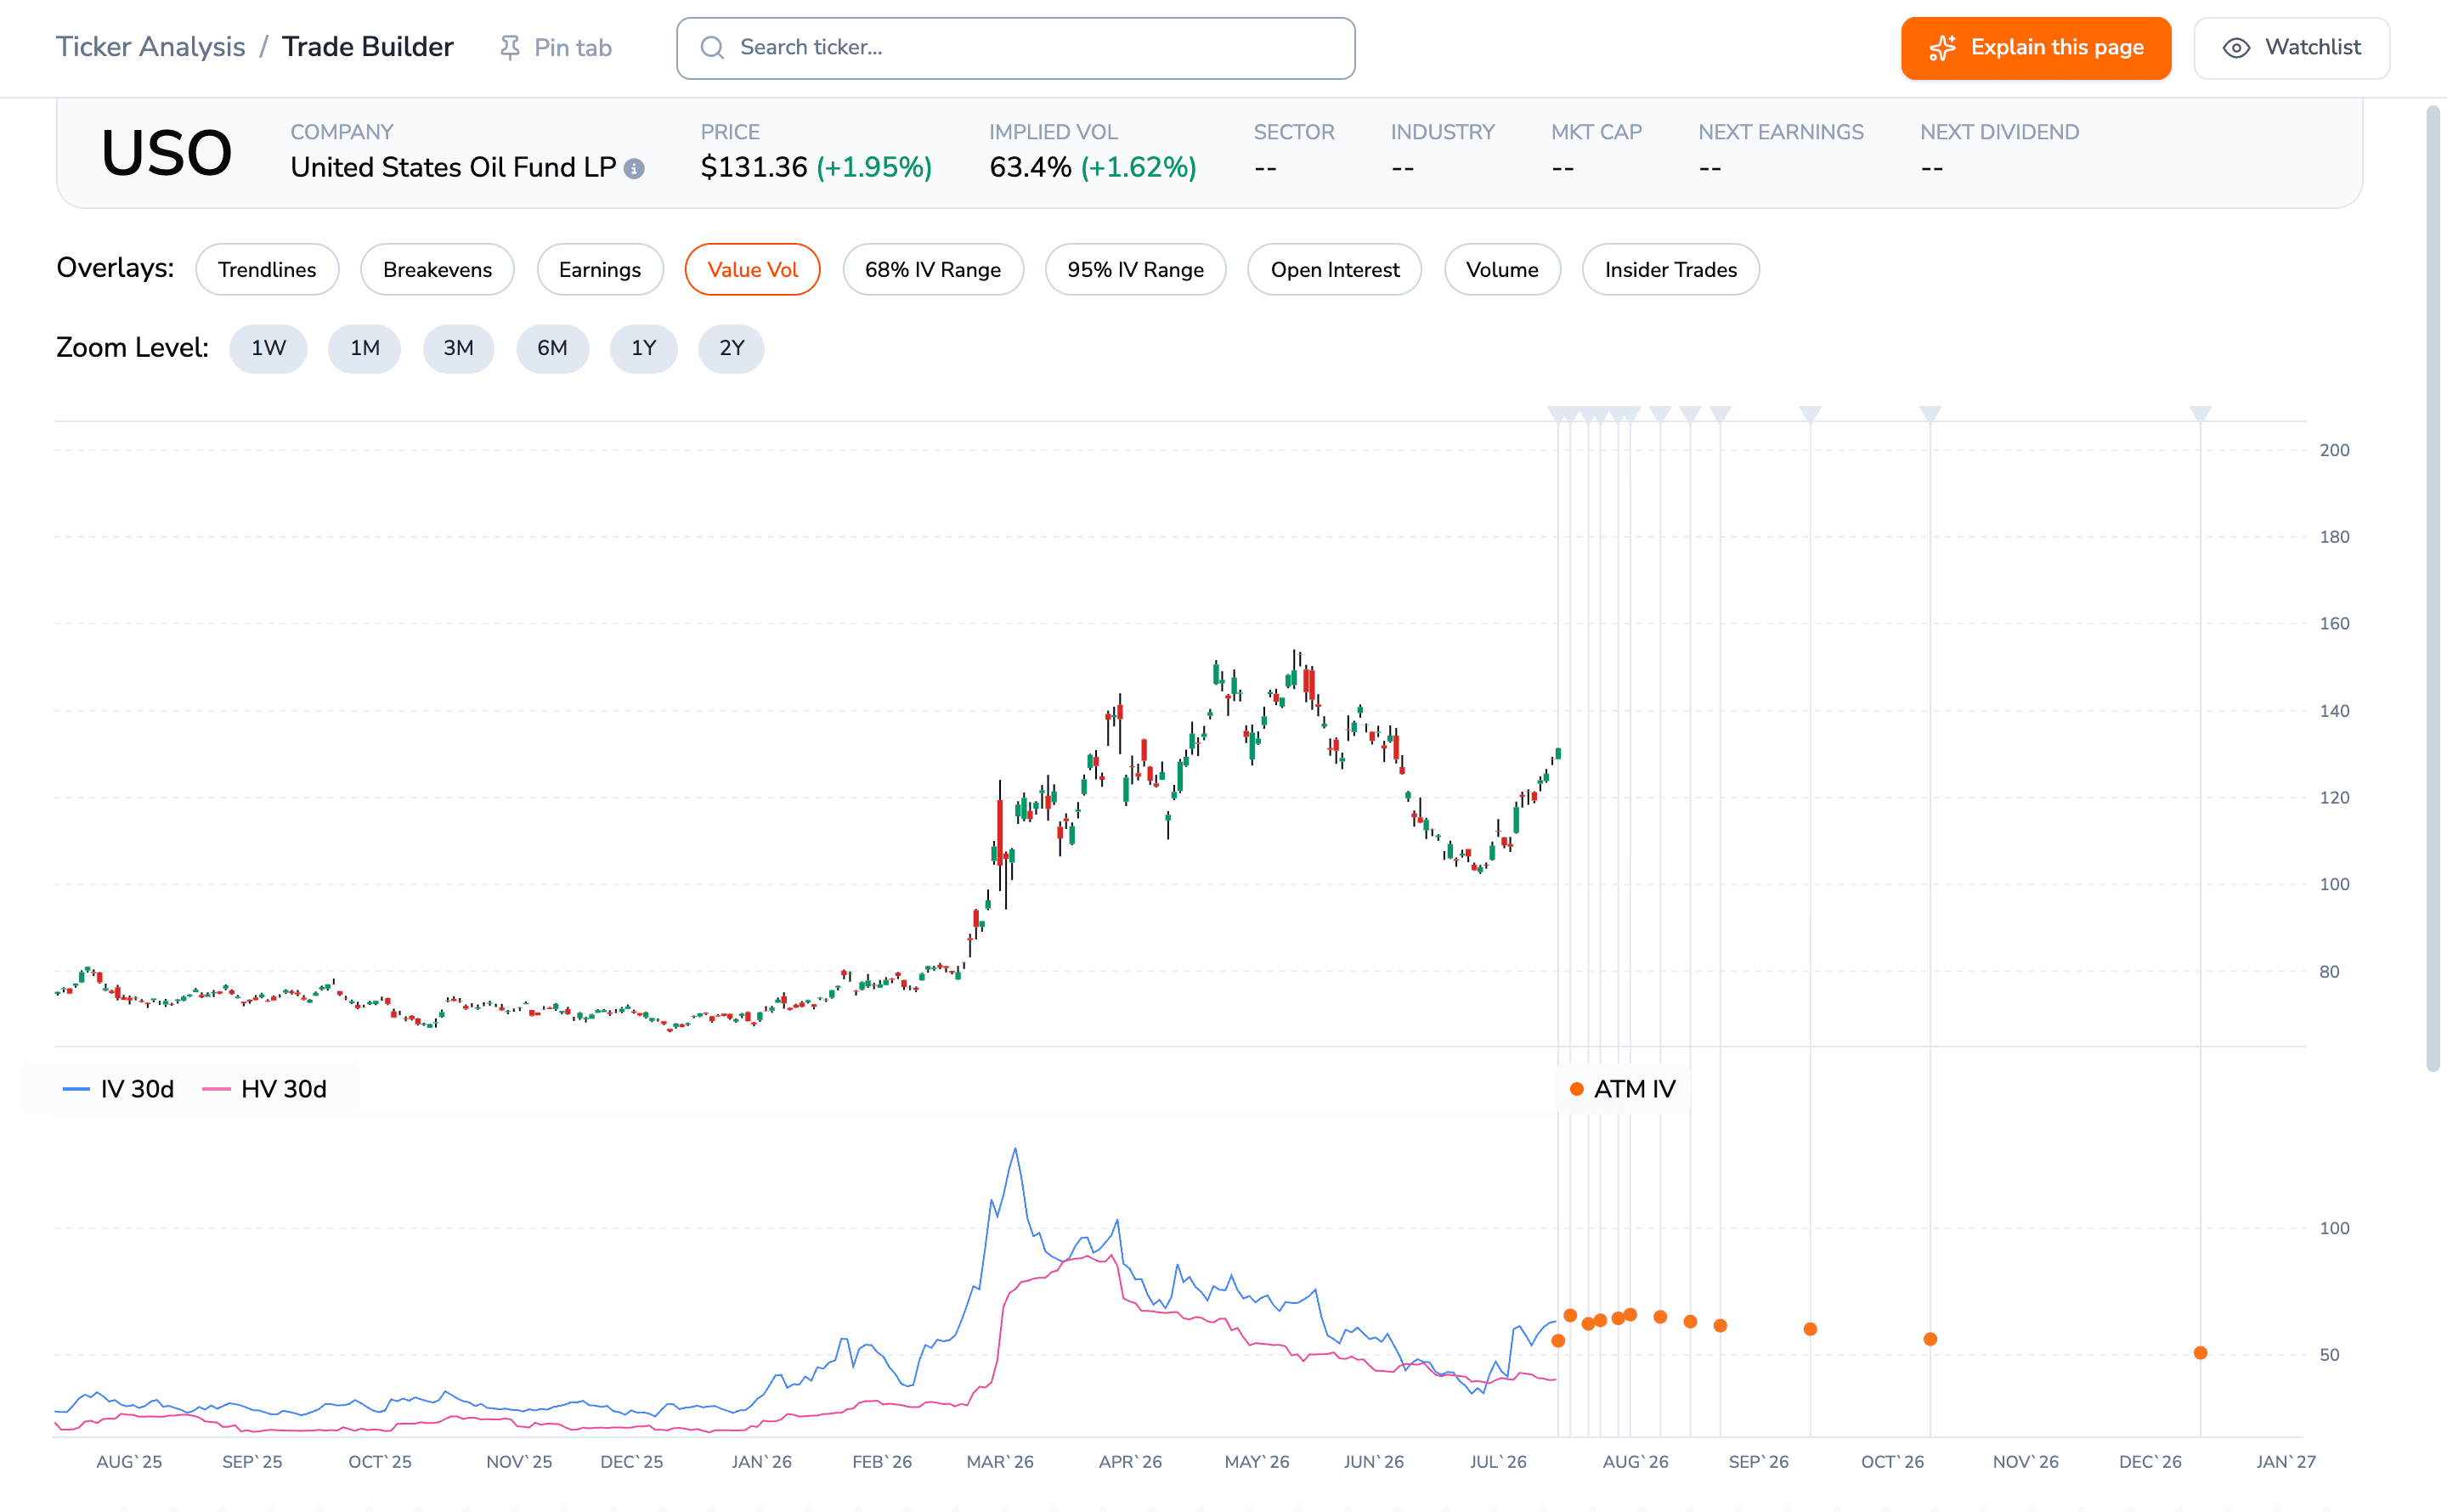
USO on the Trade Builder, live at 12:35 ET, IV 30d climbing off an early-July trough in the mid-30s. Source: ORATS Trade Builder.
USO settled at 62.72 on /datav2/hist/cores iv30d against SPY's 13.19, up 24.8% from a July 1 close that was its lowest since early March. Saxo's desk called it "oil vol at triple the VIX" on Monday and left it there, described as structure and never tested as a signal.
Which leg of the ratio actually moved
Over nineteen years USO sits at the 94.6th percentile of its own history and SPY at the 37.7th. Against 2026 alone the outlier leg swaps: oil vol is only at the 55th percentile of its own year, SPY at the 22nd, and the ratio itself at the 72nd.
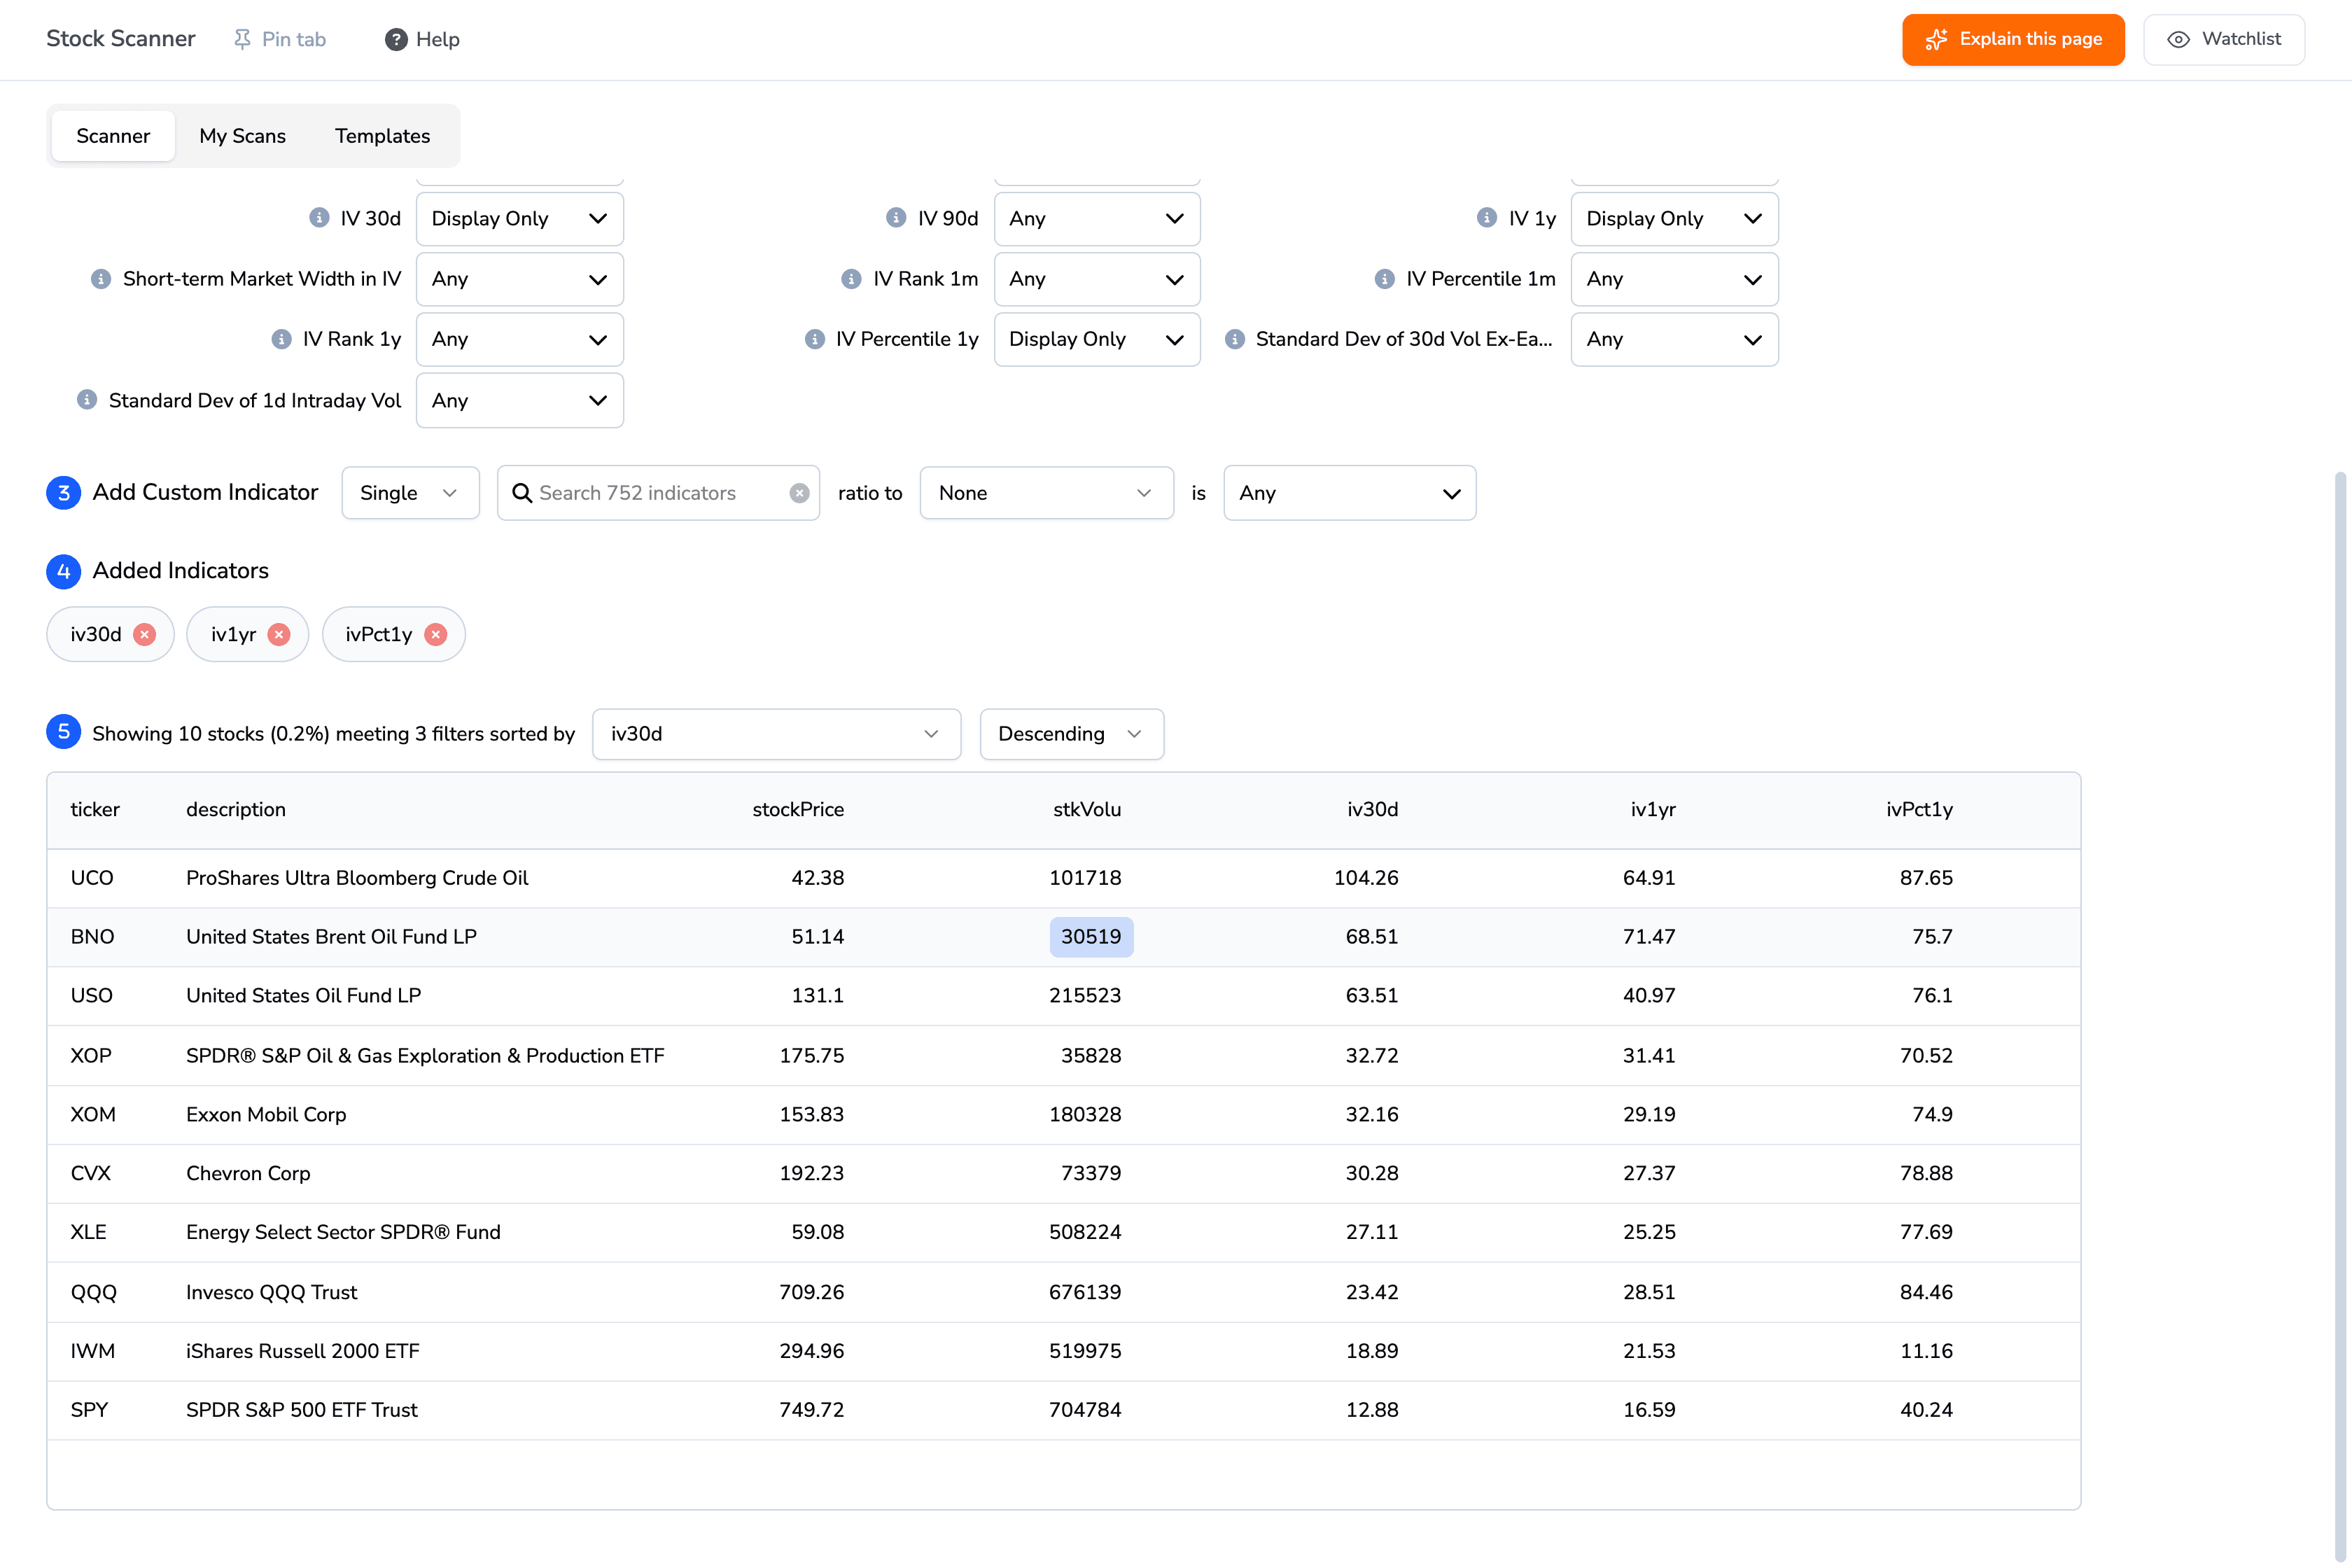
Live at 12:45 ET: USO 63.51 against SPY 12.88. ivPct1y is ORATS's one-year window, not the text's nineteen-year figures. Source: ORATS Scanner.
The shock does reach the sector, XLE at the 77.7th percentile of its own year and XOM at 74.9. It stops at the index: SPY's curve slopes up in the ordinary way, 12.88 at 30 days against 16.59 at a year.
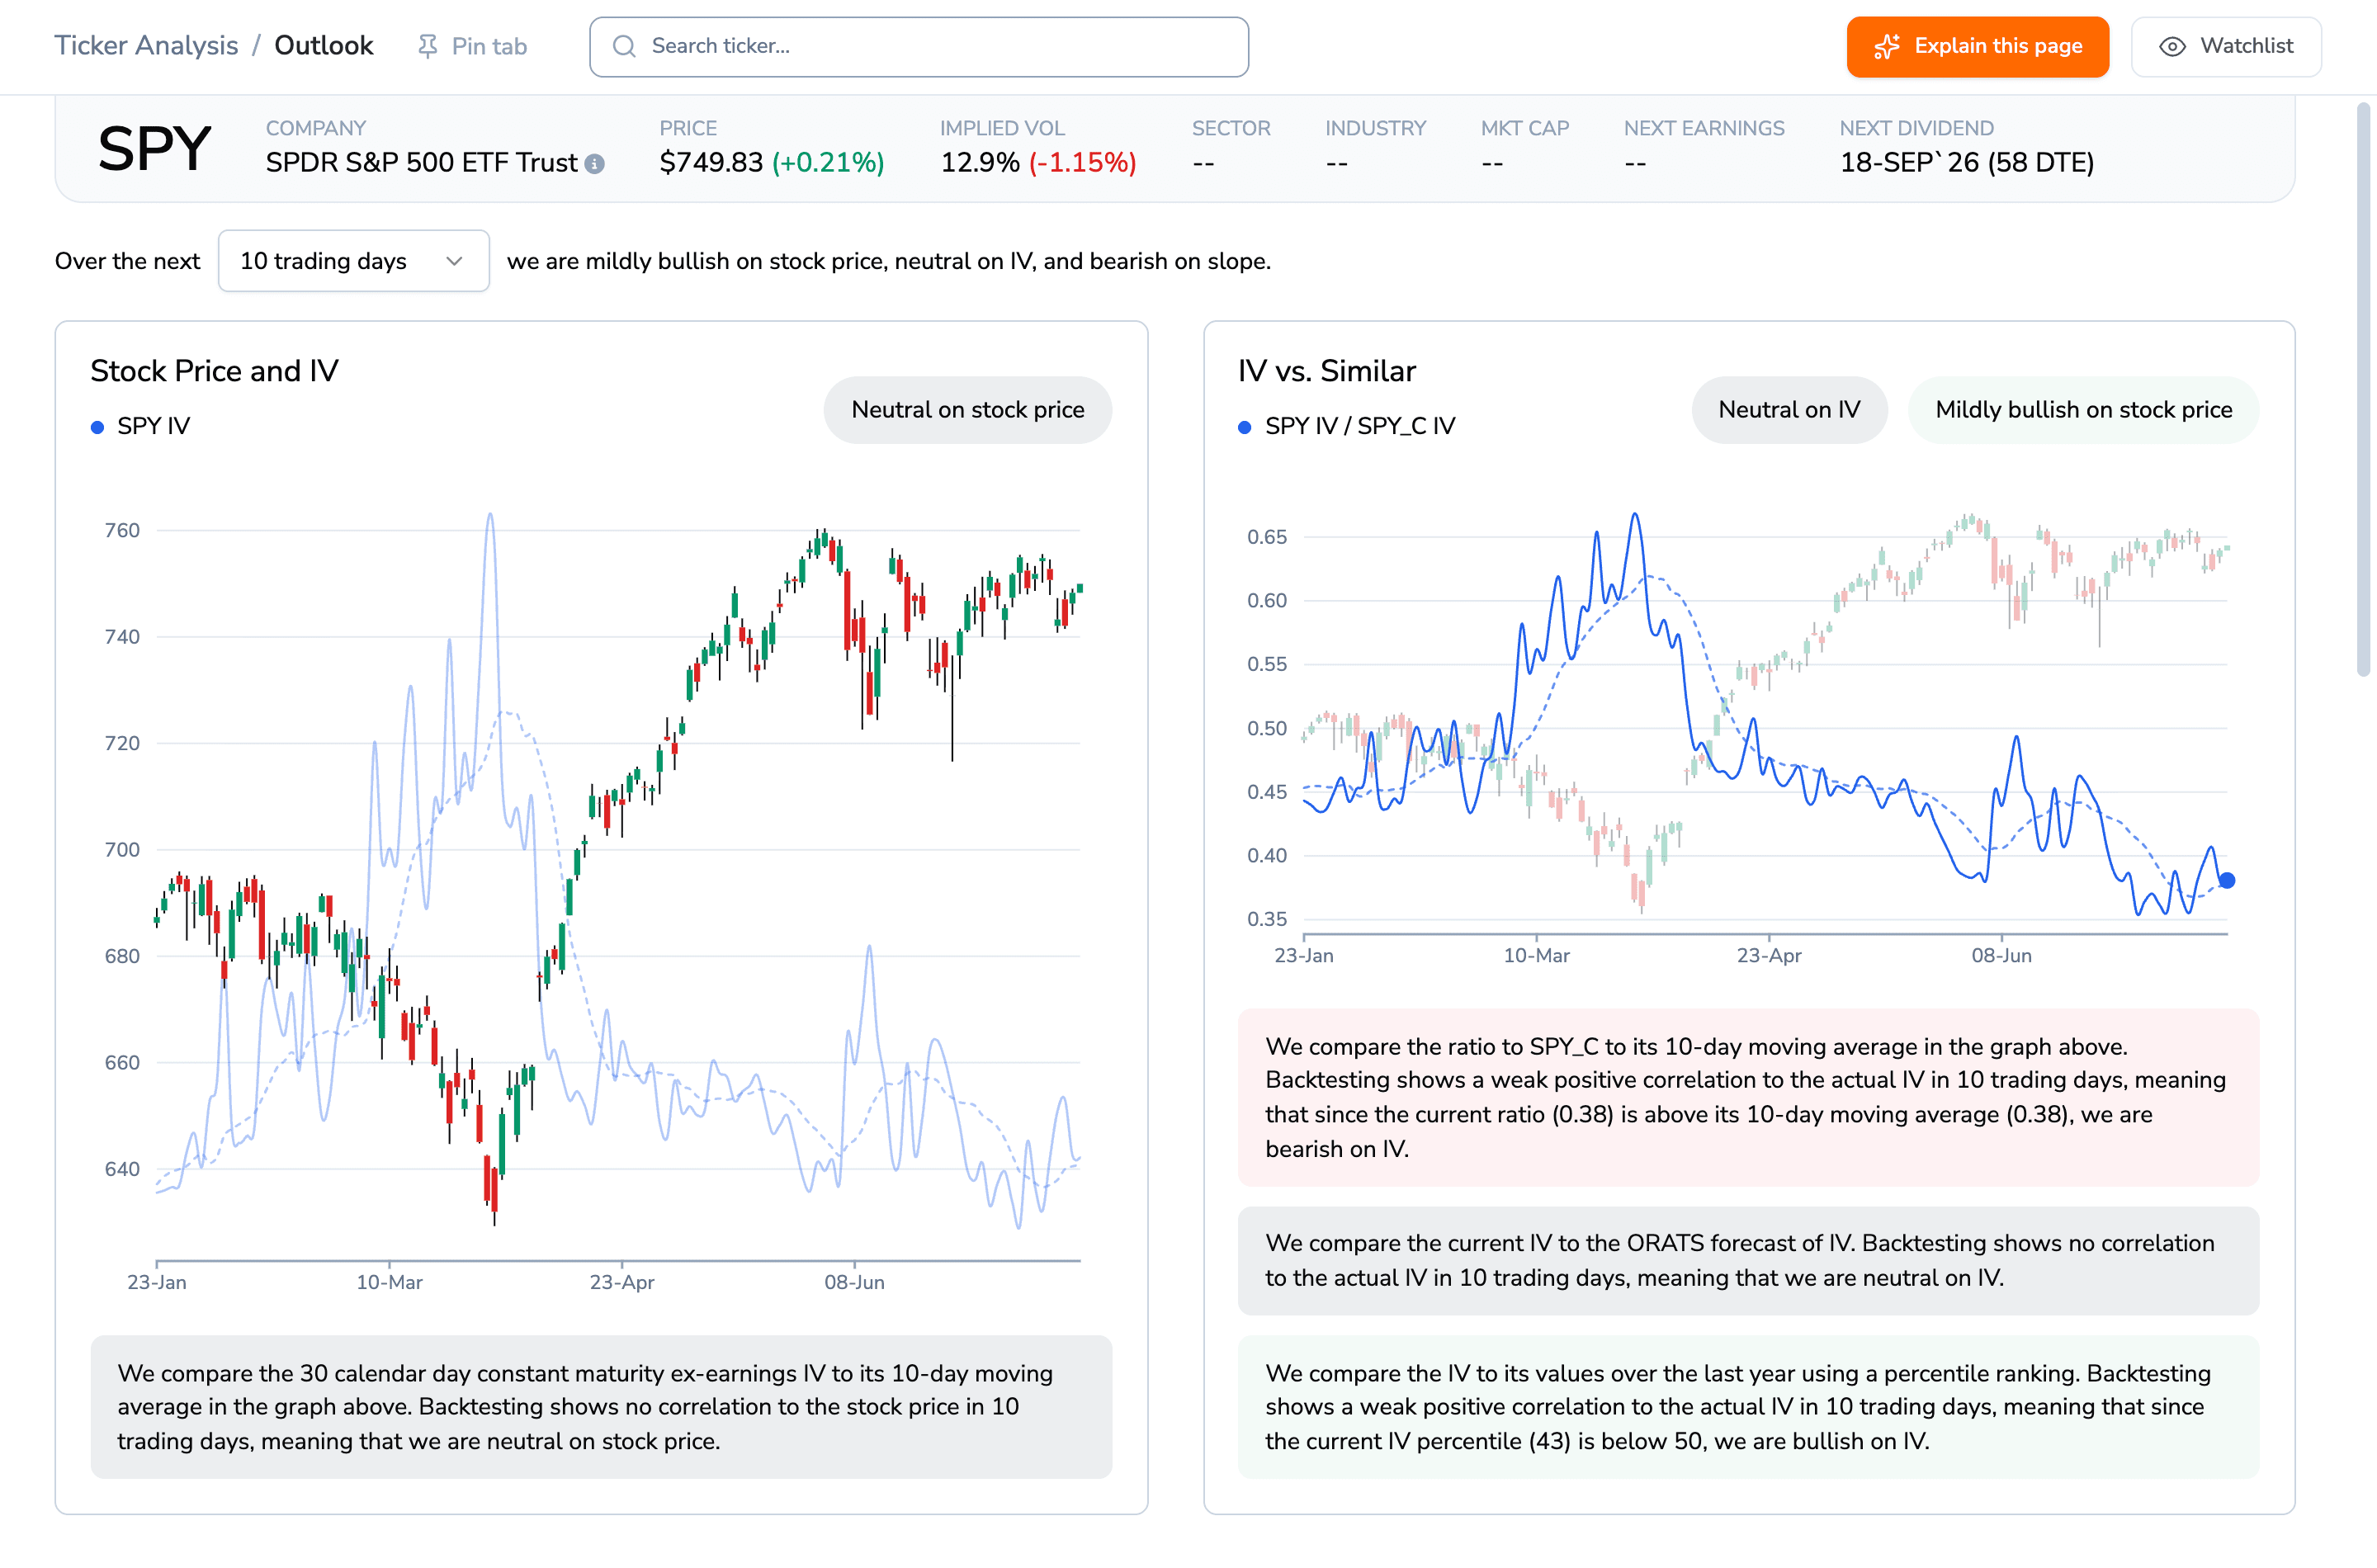
ORATS Outlook page for SPY showing a header with price 749.83 and implied vol 12.9 percent, a Stock Price and IV chart, an IV vs Similar ratio chart, and an explanatory box stating that the current IV percentile is 43 and is below 50.
Has a high ratio ever led equity vol?
Not on the metric an option position lives on. I measured forward 20-day realized against implied as a ratio rather than a point gap: the oil ratio is inversely rank-correlated with SPY's own vol level at minus 0.54, so a high reading is mostly a quiet-equity one.
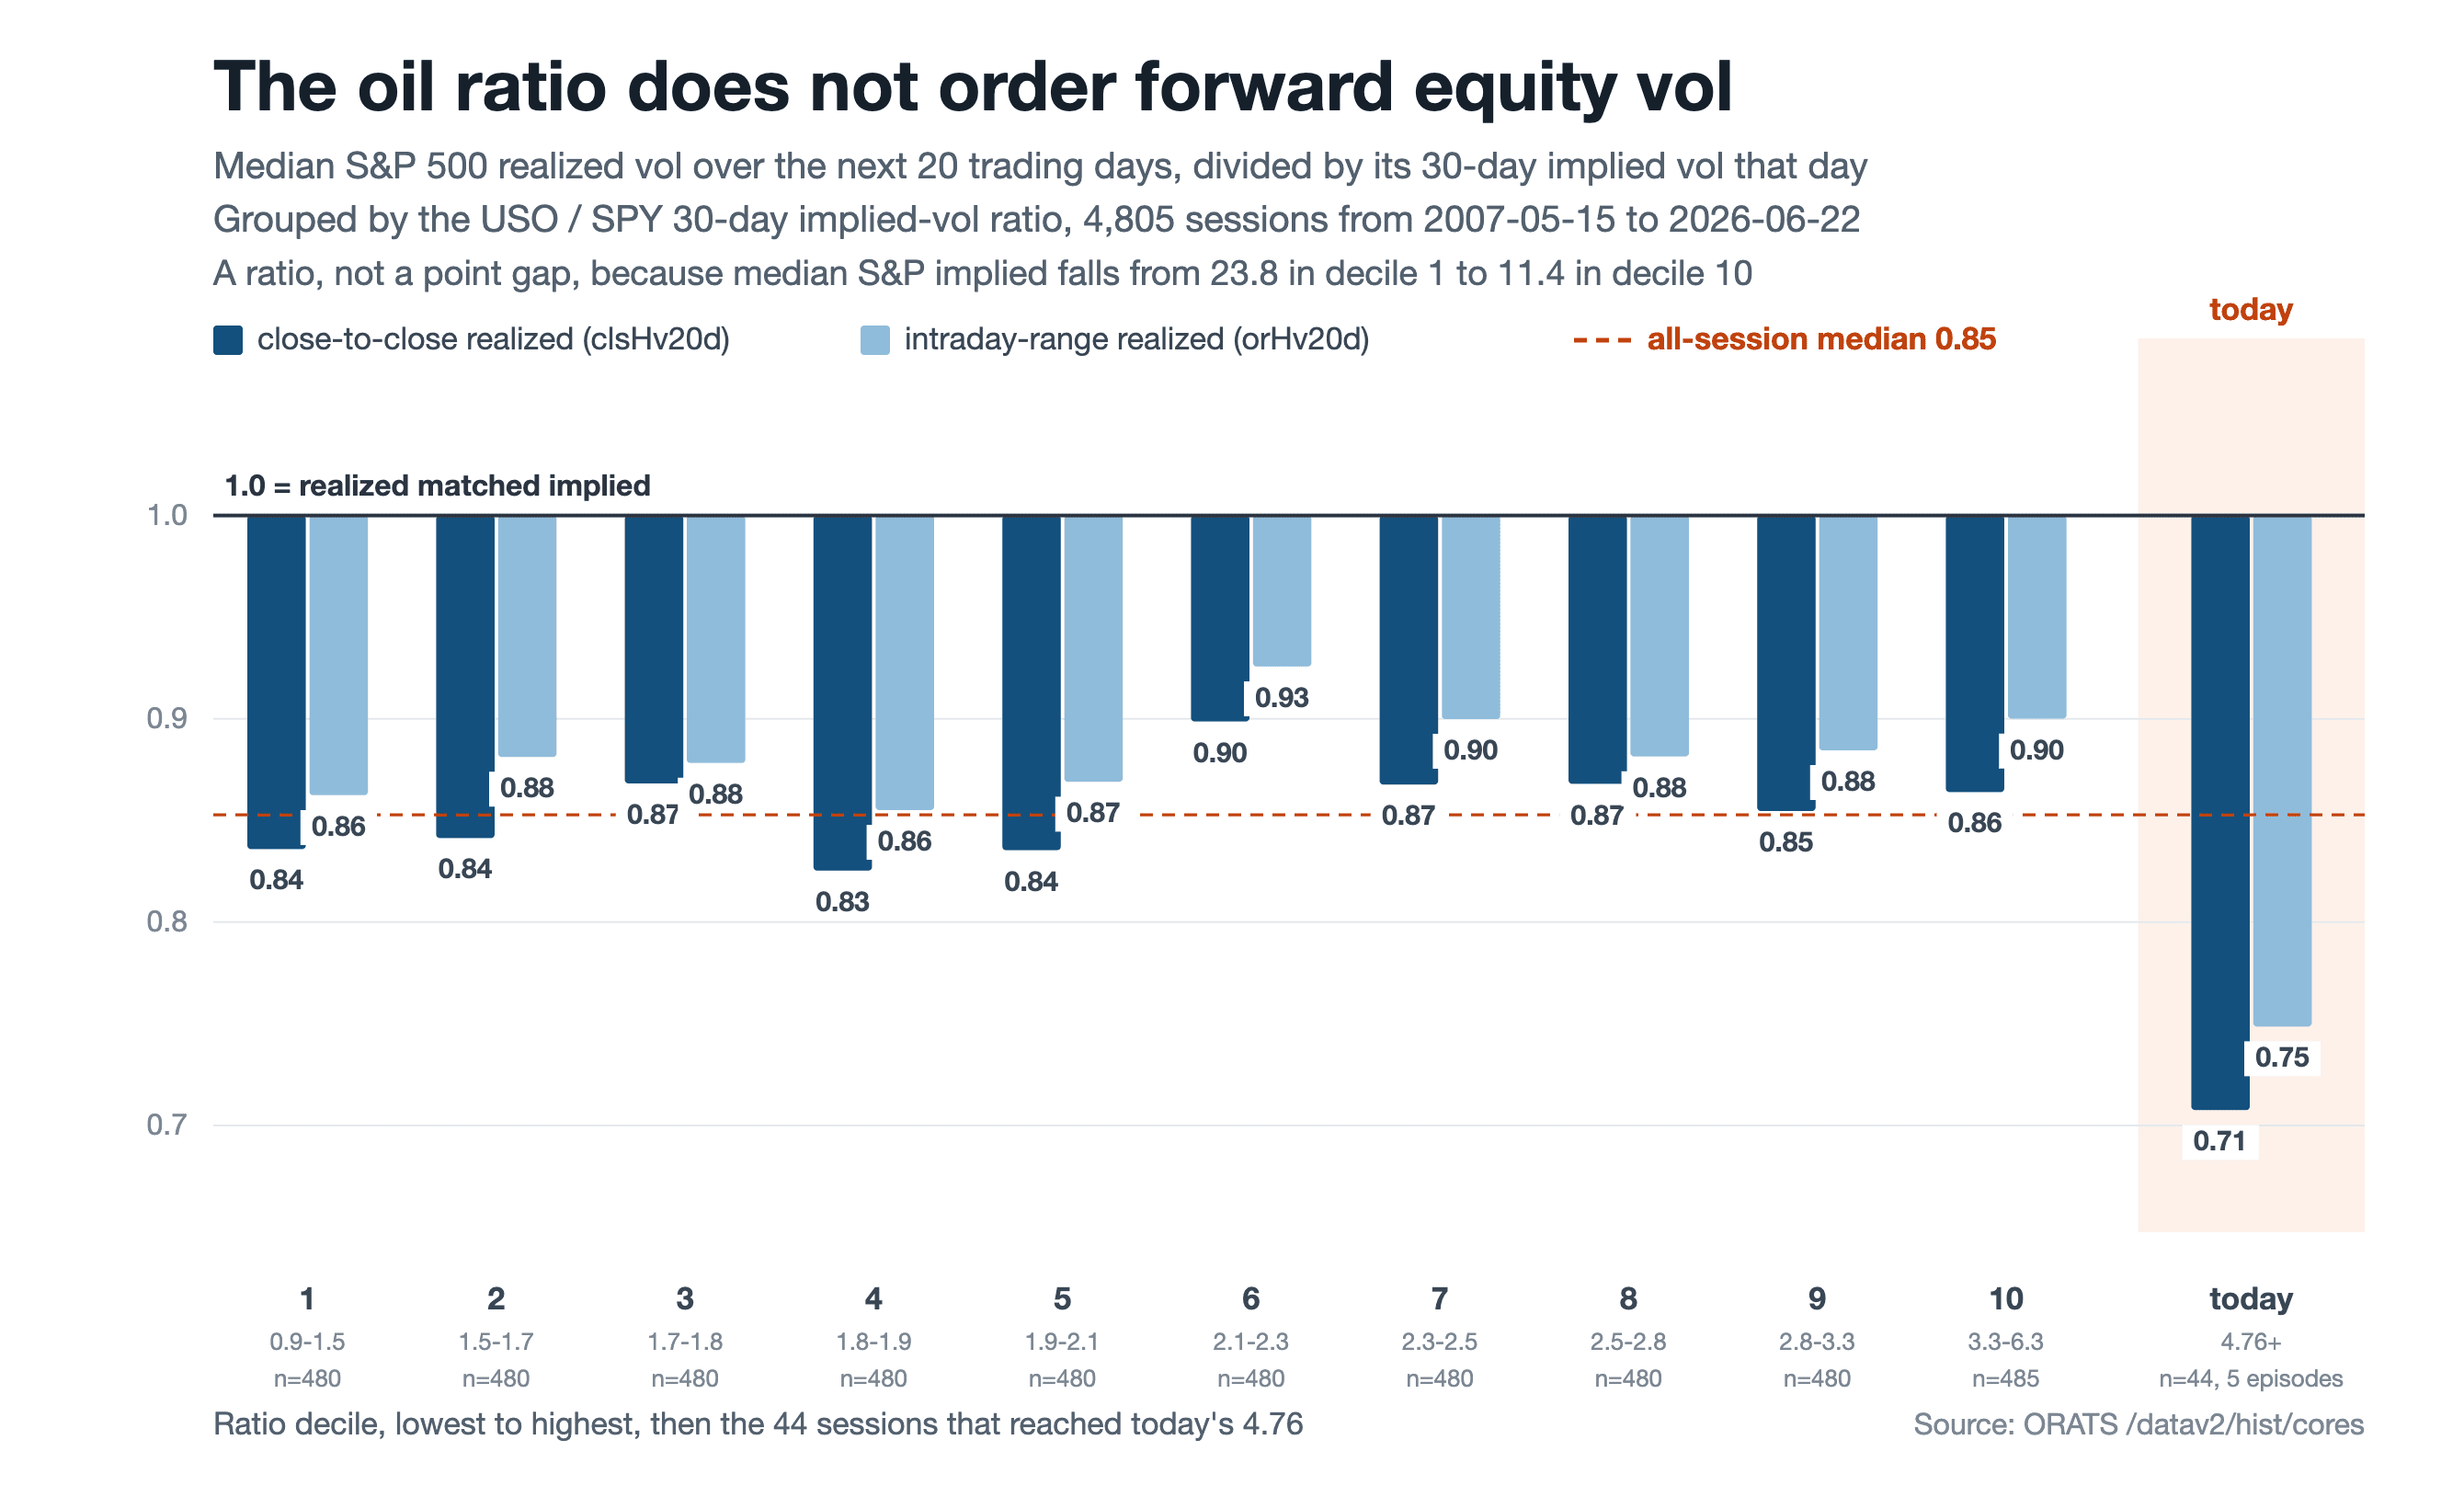
Forward realized over implied, by ratio decile, both estimators. The 4,805 plotted are the sessions with a forward 20-day window; the today group is 44 sessions but five episodes. Source: ORATS /datav2/hist/cores.
Forward implied does drift up out of the top deciles, but that's mean reversion: decile 10 is where SPY vol sits lowest.
Where the test is weakest
The 44 sessions that reached today's ratio printed 0.71, but they are five episodes and 28 of them are one April-to-May run. Strip it and the remaining 16 sessions, four episodes, print 0.92. Two of the five episode medians sit above the 0.853 baseline.
The top decile is also two regimes plus a thin residual: strip 2015 through 2017 and 2026 and the 67 sessions left, 20 episodes, beat implied on 43.3% of sessions, above both the 29.3% unconditional and 33.4% calm-market rates.
The level control is mixed: only two of five S&P vol buckets back it, though today's 13.19 sits in one. A full Hormuz closure is out of sample, and USO is a front-month WTI futures fund reverse split eight-for-one in April 2020.
So the honest reading is narrow: the ratio carries no forward information about equity vol, and what looks like a signal at today's level is one spring's worth of sessions.
Rank iv30d against orFcst20d in the Stock Scanner instead. ORATS documents a 0.85 to 1.15 band on it, and on Tuesday's settle USO prints 1.24 against its 50.43 forecast, outside the band, while SPY's 0.98 sits inside. That is a claim about the barrel's own premium, the leg the data supports.
$USO $SPY $XLE $XOM
#OilVolatility #CrossAssetVol #VolatilityRiskPremium #EnergyMarkets #ImpliedVolatility
Disclaimer:
The opinions and ideas presented herein are for informational and educational purposes only and should not be construed to represent trading or investment advice tailored to your investment objectives. You should not rely solely on any content herein and we strongly encourage you to discuss any trades or investments with your broker or investment adviser, prior to execution. None of the information contained herein constitutes a recommendation that any particular security, portfolio, transaction, or investment strategy is suitable for any specific person. Option trading and investing involves risk and is not suitable for all investors.
All opinions are based upon information and systems considered reliable, but we do not warrant the completeness or accuracy, and such information should not be relied upon as such. We are under no obligation to update or correct any information herein. All statements and opinions are subject to change without notice.
Past performance is not indicative of future results. We do not, will not and cannot guarantee any specific outcome or profit. All traders and investors must be aware of the real risk of loss in following any strategy or investment discussed herein.
Owners, employees, directors, shareholders, officers, agents or representatives of ORATS may have interests or positions in securities of any company profiled herein. Specifically, such individuals or entities may buy or sell positions, and may or may not follow the information provided herein. Some or all of the positions may have been acquired prior to the publication of such information, and such positions may increase or decrease at any time. Any opinions expressed and/or information are statements of judgment as of the date of publication only.
Day trading, short term trading, options trading, and futures trading are extremely risky undertakings. They generally are not appropriate for someone with limited capital, little or no trading experience, and/ or a low tolerance for risk. Never execute a trade unless you can afford to and are prepared to lose your entire investment. In addition, certain trades may result in a loss greater than your entire investment. Always perform your own due diligence and, as appropriate, make informed decisions with the help of a licensed financial professional.
Commissions, fees and other costs associated with investing or trading may vary from broker to broker. All investors and traders are advised to speak with their stock broker or investment adviser about these costs. Be aware that certain trades that may be profitable for some may not be profitable for others, after taking into account these costs. In certain markets, investors and traders may not always be able to buy or sell a position at the price discussed, and consequently not be able to take advantage of certain trades discussed herein.
Be sure to read the OCCs Characteristics and Risks of Standardized Options to learn more about options trading.
Related Posts