Backtesting
Wednesday, April 17th 2019
How to Set Up a Pairs Trading Backtest
Pairs trading by options traders can take advantage of price, implied volatility, skew and calendar comparisons between two related symbols.
Summary
Pairs trading by options traders can take advantage of miss-pricing between two symbols options prices. The strategy usually involves purchasing an option or spread of options and selling a similar option or spread in another related symbol. ORATS users typically look for historical relationships that have gotten out of whack to set up a pairs trade entry and exit dates and then backtest the strategy before implementing. The historical relationships can be based on underlying price comparisons, implied volatility comparisons, slope of put/call skew comparisons, or term structure comparisons. Backtesting can uncover strengths and weaknesses of the relatedness issues and help avoid the backtested pitfalls going forward.
Pairs trading is used by options traders to take advantage of miss-pricing between two symbols options prices. The strategy usually involves purchasing an option or spread of options and selling a similar option or spread in another related symbol.
Traders using ORATS usually will look for historical relationships that have gotten out of whack to set up a pairs trade entry and exit dates and then backtest the strategy before implementing.
HISTORICAL RELATIONSHIPS
Typical relationships and the associated strategies are:
- Underlying price comparisons. The trade occurs when the ratio of the stock prices goes outside a range. A delta heavy strategy like a call, short put, long call or short put vertical is sold in the overpriced symbol and simultaneously bought in the underpriced one.
- Implied volatility comparisons. The trade occurs when the ratio of the IVs goes outside a range. A vega heavy strategy like a straddle, strangle, iron butterfly, or iron condor is sold in the overpriced symbol and simultaneously bought in the underpriced one.
- Slope of put/call skew comparisons. The trade occurs when the ratio of the slopes goes outside a range. A slope heavy strategy like a vertical or 1 x 2 is set up where the short leg in the overpriced slope is the lower strike and long leg the higher strike and an opposite trade is made in the underpriced slope stock.
- Term structure comparisons. The trade occurs when the ratio of the forward volatilities (forward vols are explained in this blog post) goes outside a range. A calendar strategy is sold in the overpriced symbol and simultaneously bought in the underpriced one.
Here's a graph of the QQQ/SPY implied volatility ratio:

These comparisons can be set up using the ORATS Data API Core General or Earnings area of the Data API here or the Excel API in the DataHistory tab dropdown. You can sign up for a free trial to the Data API here.
Here's how to construct comparisons:
- Underlying price comparisons are made by aligning closing stock prices are under the heading pxAtmIv. Set up a ratio of the prices of symbol1/symbol2 and a trigger points. That trigger points should be entry dates and associated exit dates as in the picture below.
- Implied volatility comparisons are made using one of many IV calculations, most popular are exErnIv20d, the implied 20 calendar day interpolated implied volatility with earnings effect out. Set up a ratio of the prices and a trigger point.
- Slope of put/call skew comparisons called "slope" that is the put call slope at the interpolated 30 calendar days of the tangent at 50 delta.
- Term structure comparisons can compare for example the ratio of exErnIv20d to exErnIv60d.
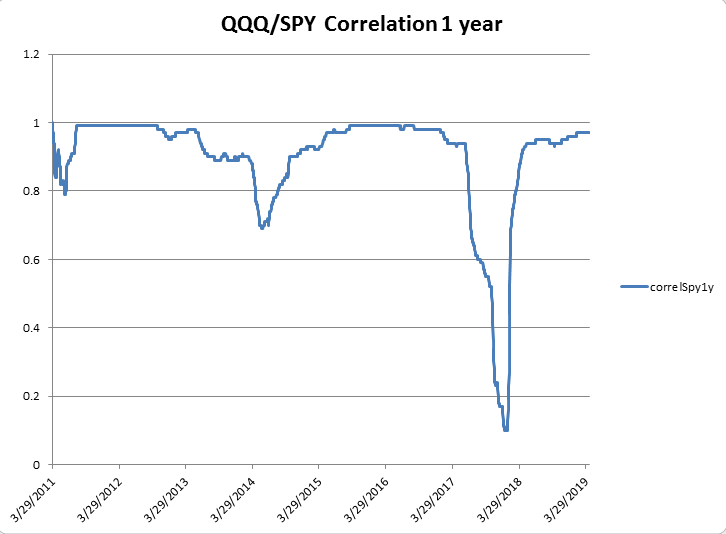
To choose the symbol pairs, the relatedness determination usually done by calculating by correlations of stock prices or implied volatility. Correlation calculations are based on historical information and can change and negatively affect your results. Backtesting can uncover strengths and weaknesses of the relatedness issues and help avoid the backtested pitfalls going forward.
For example, here is a graph of the correlation between the NDX and S&P500:
Betas are also calculated between the pairs to calculate the sizing of the trades. The higher beta stock will have a lower relative sizing. The calculation can get complex but a backtest can help understand this relationship and size the trade.
Correlations and betas can be more or less consistent based on various factors like levels of implied volatility, nearness to earnings if stocks, and momentum trends in the correlations and betas.
BACKTESTING
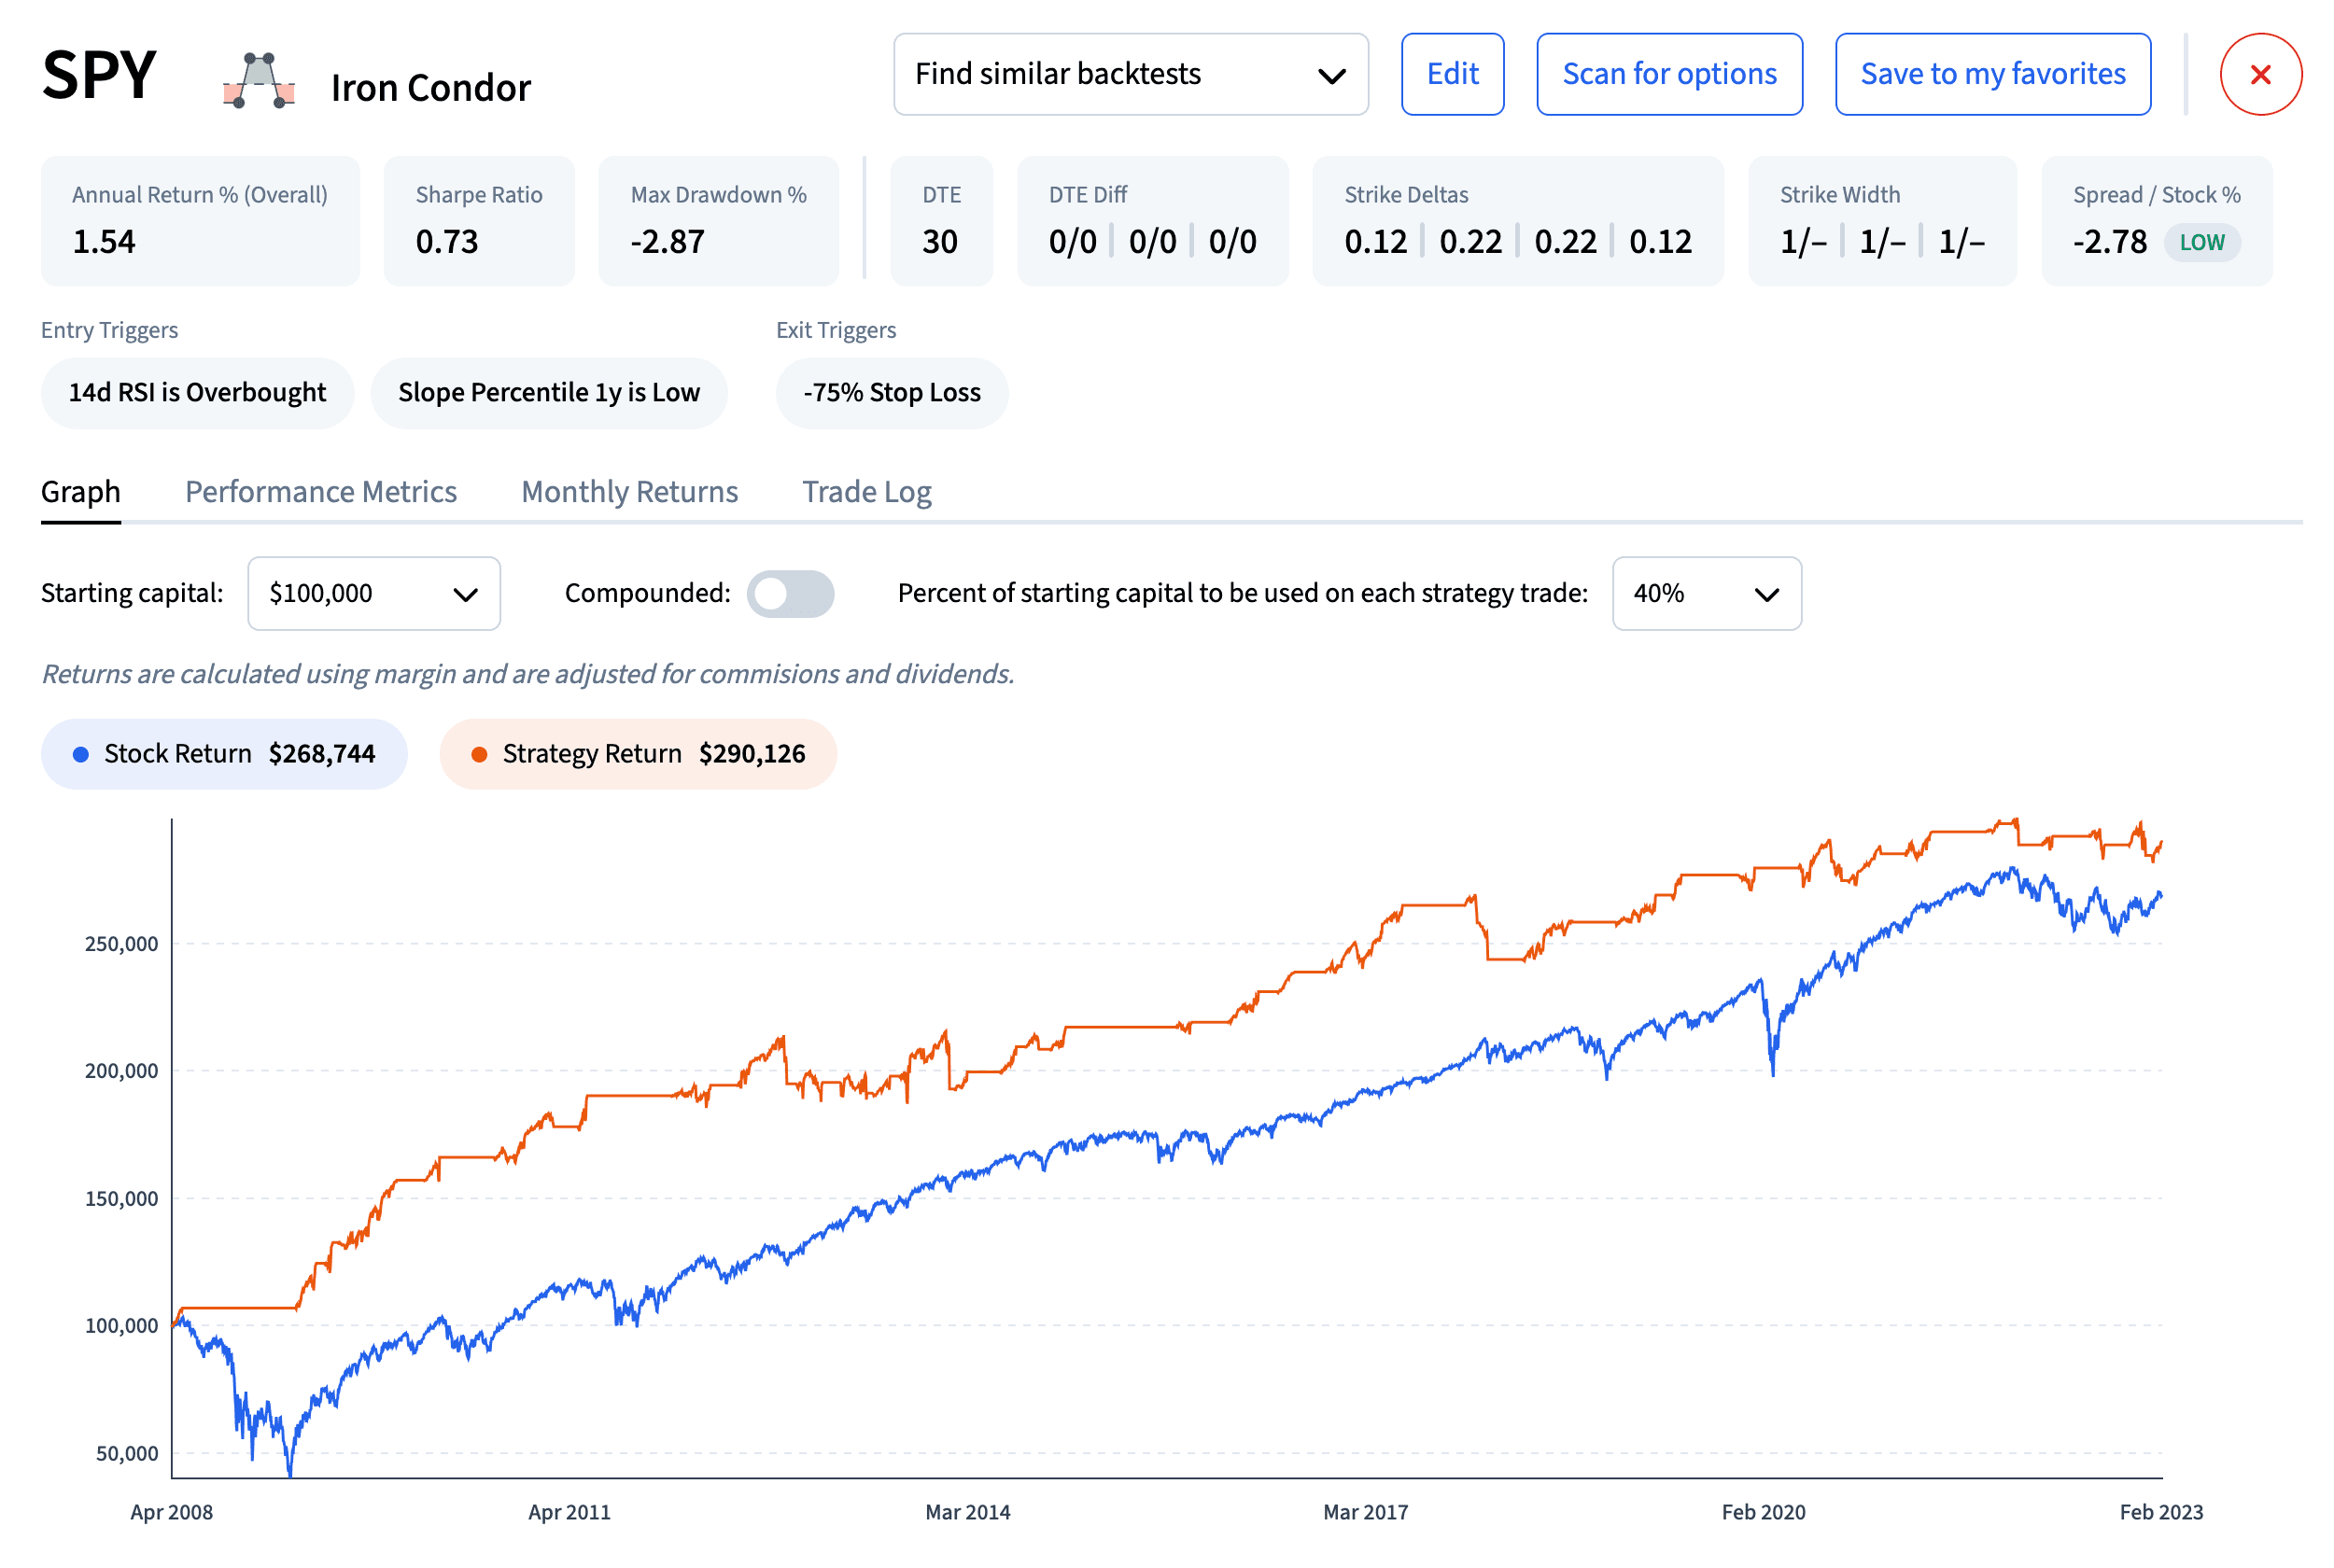
Backtesting can be accomplished by taking the symbol entry & exit dates from the historical relationships and pasting them into the Symbol input in the backtester. Here is a sample of a put/call skew relationship where the ORATS Slope in NDX divided by SPX was outside of a range to determine the entry date and when the ratio came back into the range the exit date.
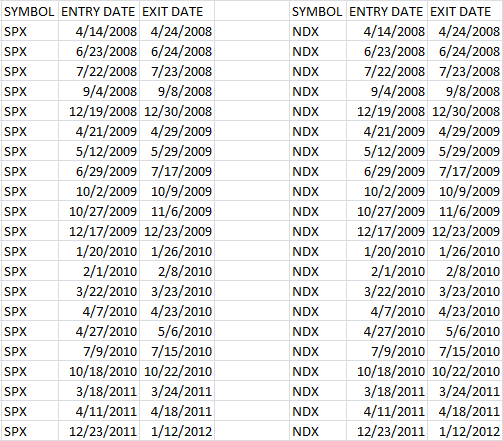
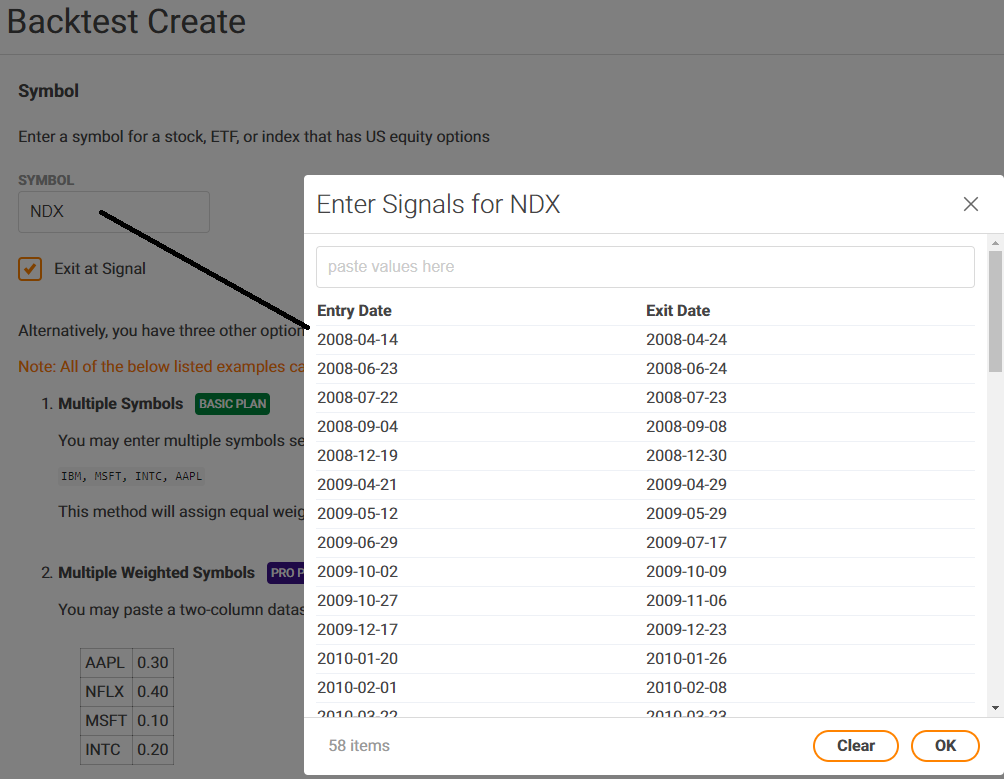
The Symbol, Entry Date and Exit Date are pasted into the backtester Symbol input box and the choice is selected to exit at the exit date (trades otherwise would be held to expiration) as seen here:
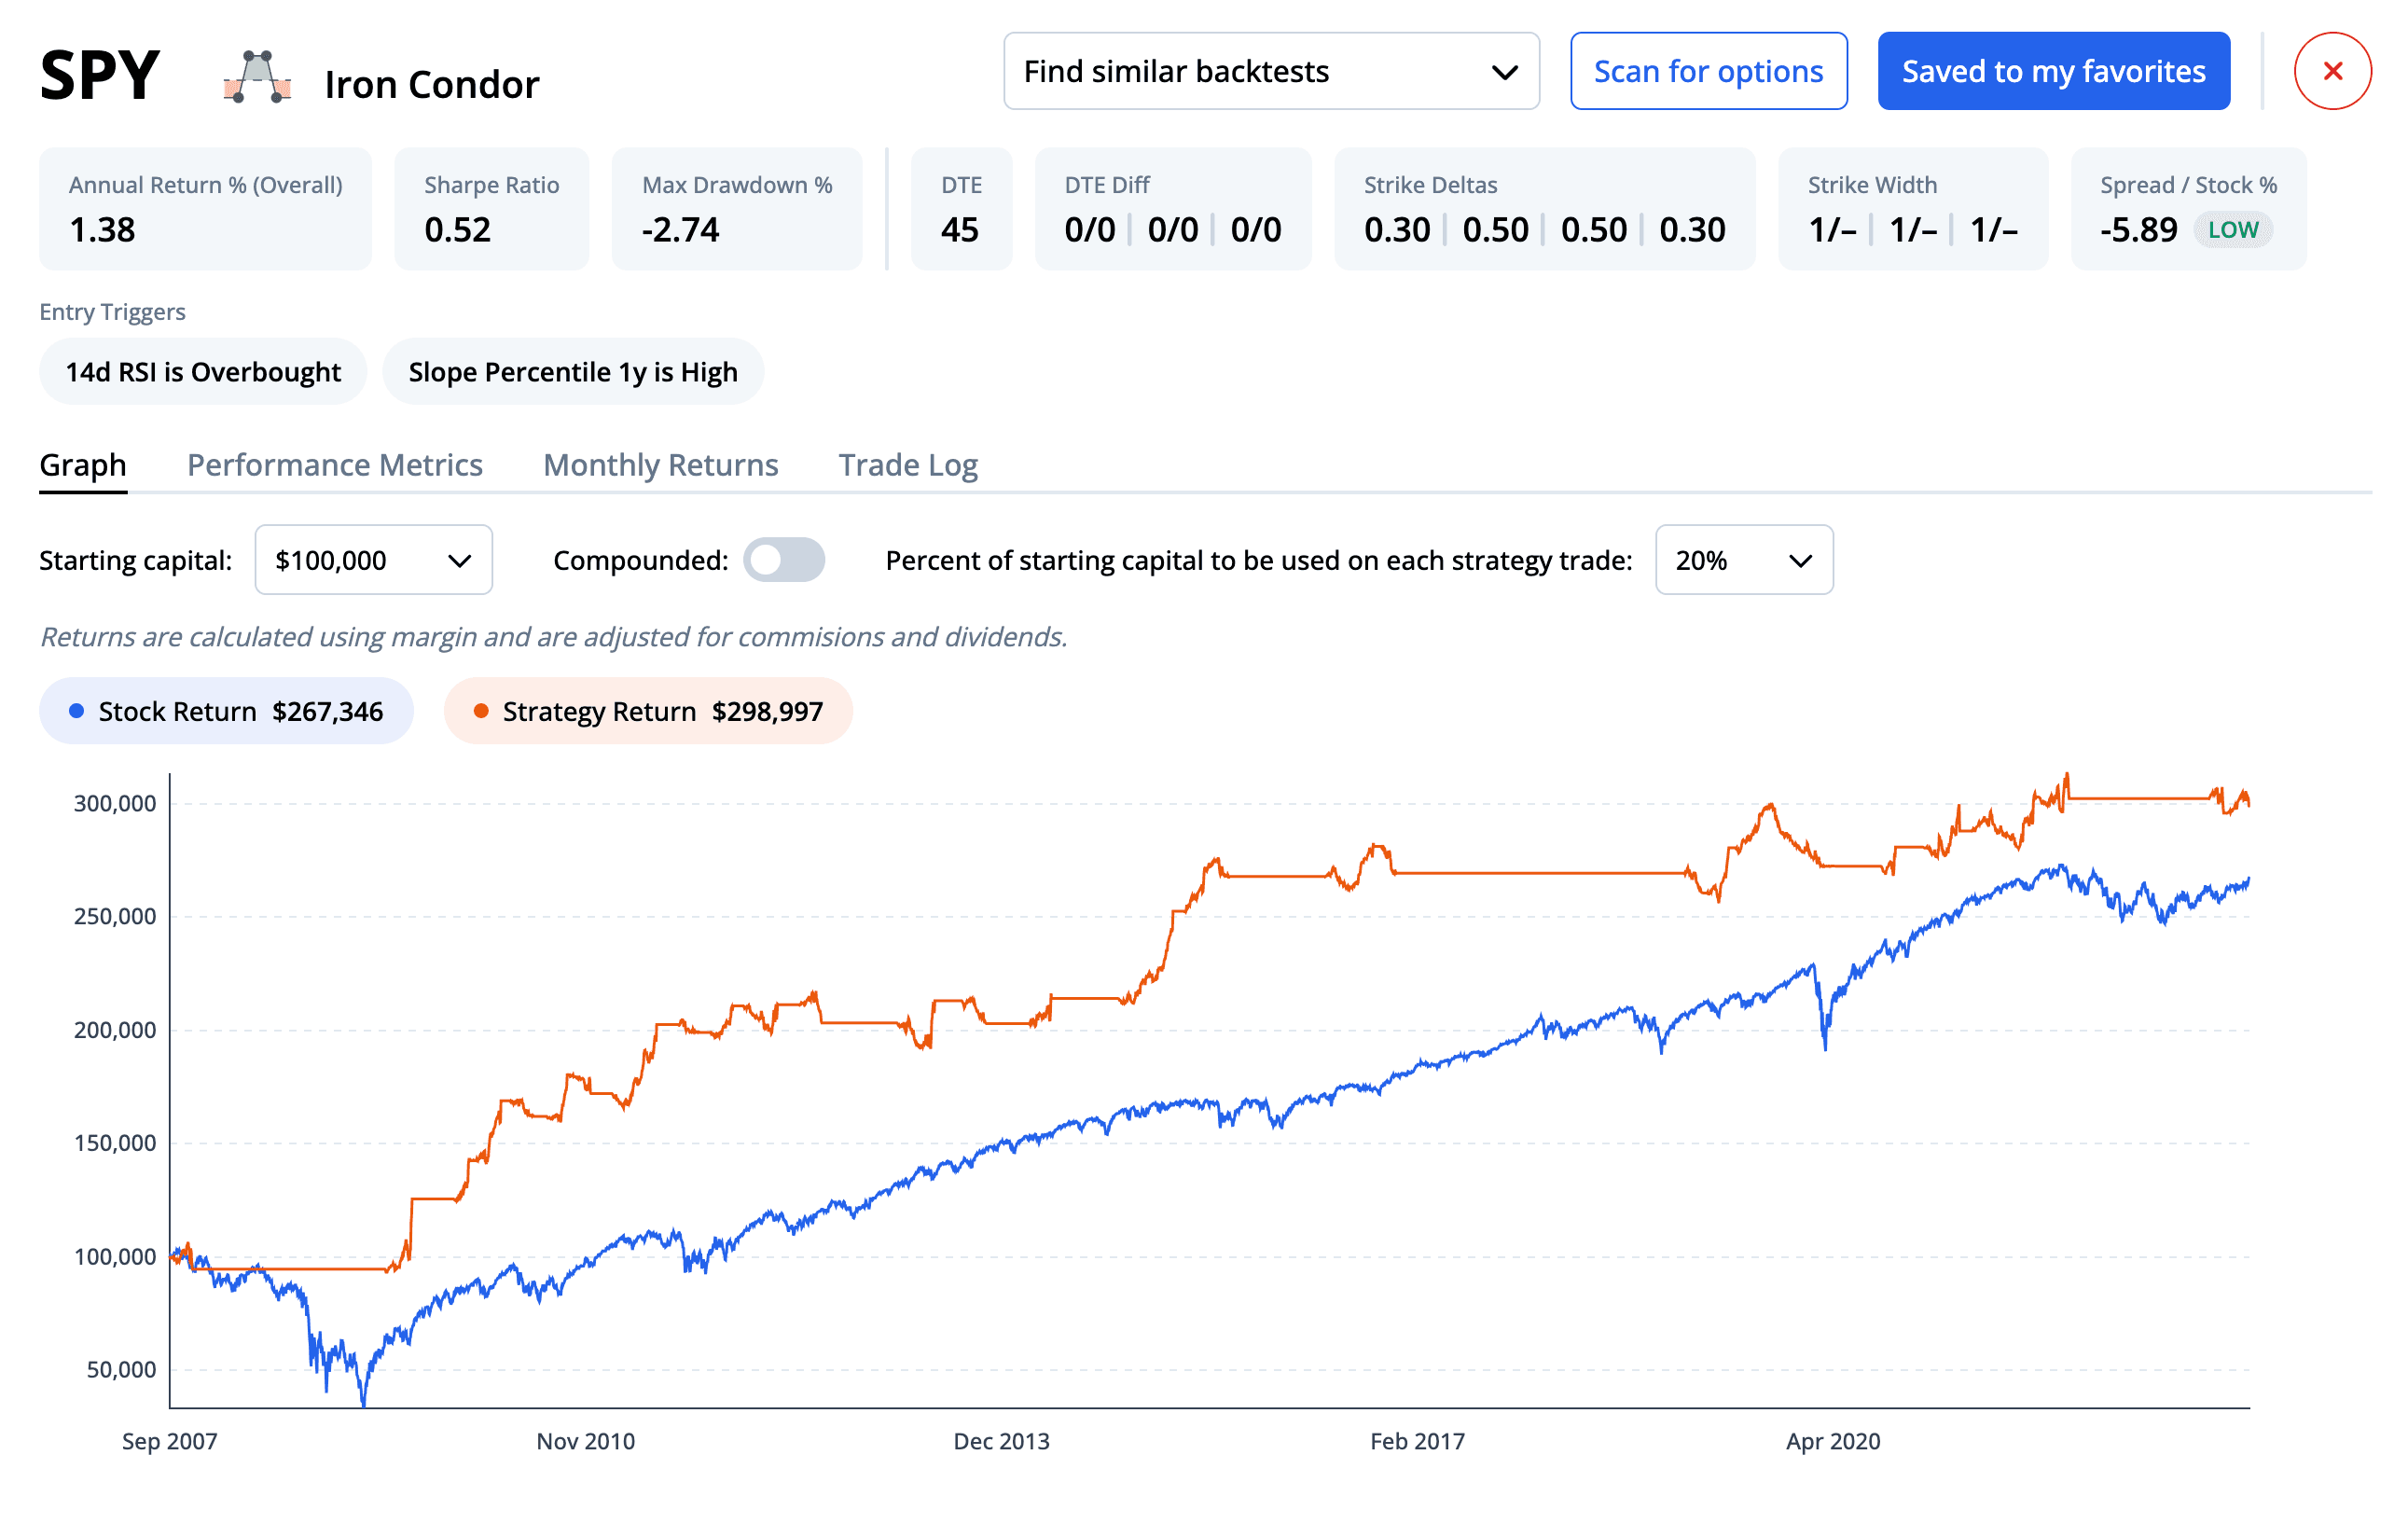
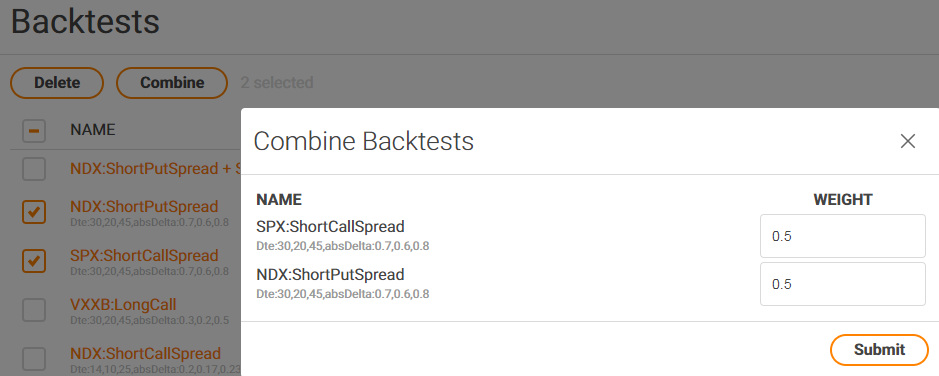
A backtest taking advantage of the comparisons explained above are run in complementary for each symbol. Finally, the strategies are combined and the report can be viewed.
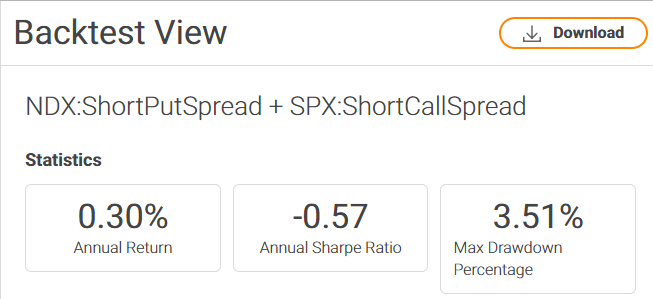
After the backtest has run, the report can be viewed, and a download of the trades can be collected.
SUMMARY
By using the ORATS Data API, a list of entry and exit dates can be made for each symbol. The entry and exit dates are pasted into the backtester to run individual tests that offset the pairs comparison. Finally, the two tests are combined and the report is observed.
Go to wheel.orats.com to try it out!
To see pricing for various levels of the backtester, go HERE.
If you need to upgrade or cancel your subscription you can do that HERE.
Check out backtesting blogs HERE
Disclaimer:
The opinions and ideas presented herein are for informational and educational purposes only and should not be construed to represent trading or investment advice tailored to your investment objectives. You should not rely solely on any content herein and we strongly encourage you to discuss any trades or investments with your broker or investment adviser, prior to execution. None of the information contained herein constitutes a recommendation that any particular security, portfolio, transaction, or investment strategy is suitable for any specific person. Option trading and investing involves risk and is not suitable for all investors.
All opinions are based upon information and systems considered reliable, but we do not warrant the completeness or accuracy, and such information should not be relied upon as such. We are under no obligation to update or correct any information herein. All statements and opinions are subject to change without notice.
Past performance is not indicative of future results. We do not, will not and cannot guarantee any specific outcome or profit. All traders and investors must be aware of the real risk of loss in following any strategy or investment discussed herein.
Owners, employees, directors, shareholders, officers, agents or representatives of ORATS may have interests or positions in securities of any company profiled herein. Specifically, such individuals or entities may buy or sell positions, and may or may not follow the information provided herein. Some or all of the positions may have been acquired prior to the publication of such information, and such positions may increase or decrease at any time. Any opinions expressed and/or information are statements of judgment as of the date of publication only.
Day trading, short term trading, options trading, and futures trading are extremely risky undertakings. They generally are not appropriate for someone with limited capital, little or no trading experience, and/ or a low tolerance for risk. Never execute a trade unless you can afford to and are prepared to lose your entire investment. In addition, certain trades may result in a loss greater than your entire investment. Always perform your own due diligence and, as appropriate, make informed decisions with the help of a licensed financial professional.
Commissions, fees and other costs associated with investing or trading may vary from broker to broker. All investors and traders are advised to speak with their stock broker or investment adviser about these costs. Be aware that certain trades that may be profitable for some may not be profitable for others, after taking into account these costs. In certain markets, investors and traders may not always be able to buy or sell a position at the price discussed, and consequently not be able to take advantage of certain trades discussed herein.
Be sure to read the OCCs Characteristics and Risks of Standardized Options to learn more about options trading.
Related Posts