Indicators
Friday, November 14th 2025
How ORATS Uses Historical Volatility Forecasts to Improve Options Trading Decisions
How ORATS combines historical data, earnings patterns, and sector signals to forecast volatility.
Summary
ORATS utilizes a proprietary historical volatility (HV) forecast system to enhance options trading decisions by analyzing ex-earnings HV, short and long-term forecasts, IV-HV relationships, and sector signals. Traders can identify mispriced options, optimize calendar spreads, and refine earnings strategies by comparing implied volatility with HV forecasts. The system emphasizes data-driven predictions, allowing for improved strategy timing and risk management based on forecast confidence levels.
One of ORATS' most powerful yet underappreciated features is our proprietary historical volatility (HV) forecast system. While most traders focus solely on what implied volatility (IV) is telling them, understanding where realized volatility is likely to go can provide a significant edge. Here's how we build these forecasts and how you can use them.
The Problem with Traditional Volatility Analysis
Most options platforms show you:
- Current implied volatility from option prices
- Historical realized volatility from past stock moves
- Maybe an IV percentile or rank
But they leave you to figure out the crucial question: Is current IV fairly pricing future realized volatility?
This is where ORATS' forecast methodology comes in.
How ORATS Builds HV Forecasts
Our forecasting system uses a multi-factor approach that considers:
1. Ex-Earnings Historical Volatility
We calculate HV both with and without earnings days included. Since earnings create massive one-day moves that distort the signal, our ex-earnings HV (orHvXern) provides a cleaner baseline for "normal" market conditions.
For example, a stock might show:
- 20-day HV: 35% (includes recent earnings)
- 20-day ex-earnings HV: 28% (more representative of typical movement)
2. Short-Term and Long-Term Views
We forecast at two primary horizons:
- orFcst20d: 20-day forward HV forecast (short-term trading)
- orFcstInf: Infinite/2-year HV forecast (long-term mean reversion)
This dual approach captures both near-term momentum and long-term equilibrium.
3. IV-HV Relationships
We've analyzed years of data on how IV relates to future HV. The market's current IV pricing contains information — we extract and combine it with our historical patterns.
4. Related ETF Analysis
Individual stocks don't trade in isolation. We incorporate volatility signals from sector ETFs and broad market indices. If the entire tech sector is experiencing elevated volatility, that informs our forecast for individual tech names.
5. Earnings Adjustments
Our forecasts account for upcoming earnings. We calculate:
- ieeEarnEffect: The market's implied earnings effect
- fcstErnEffct: Our forecasted earnings effect based on historical patterns
- impliedEarningsMove: Expected percentage move
Then we add these back in when forecasting periods that include earnings.
The Forecast Fields Explained
orFcst20d
Our forecast of what the stock's 20-day realized volatility will be over the next 20 trading days, excluding earnings effects.
orIvFcst20d
Our forecast of where 20-day IV will be in 20 trading days. This is particularly useful for calendar traders.
orFcstInf
Our long-term forecast, essentially where we expect the stock's "normal" volatility to settle. Think of this as the mean reversion target.
How to Use These Forecasts in Your Trading
1. Identifying Mispriced Options
Compare current IV to our HV forecast:
If iv30d > orFcst20d → Options may be overpriced (sell premium) If iv30d < orFcst20d → Options may be underpriced (buy premium)
In the ORATS Dashboard, you can scan for these opportunities using the Stock Scanner with filters like:
- iv30d / orFcst20d > 1.15 (IV is 15%+ above forecast — sell opportunity)
- iv30d / orFcst20d < 0.85 (IV is 15%+ below forecast — buy opportunity)
2. Calendar Spread Selection
Calendar spreads profit when near-term IV is high relative to longer-term IV. Our IV forecast (orIvFcst20d) helps you determine if that premium is sustainable or likely to collapse.
Good Calendar Setup:
- Front month IV elevated vs forecast
- Back month IV closer to forecast
- Expect front month vol to decline while back month stays stable
3. Earnings Strategy Optimization
Compare the implied earnings move to our forecast:
impliedEarningsMove vs fcstErnEffct
If the market is pricing a 6% move but our forecast based on 12 quarters of history suggests 4.5%, you might consider selling premium ahead of earnings.
4. Strategy Optimizer Integration
In the ORATS Strategy Optimizer, you can use forecast indicators as entry/exit triggers:
Entry Indicators:
- orFcst20d — Enter when forecast is high/low
- ivHvXernRatio — Current IV/HV ratio
- fcstR2 — Goodness of fit (higher = more reliable forecast)
Exit Indicators:
- Exit when iv30d converges to orFcst20d
- Exit when realized vol reaches forecast levels
The optimizer's p-values will tell you if these forecast-based entries have been statistically significant over 18+ years of backtesting.
5. Risk Management
Our forecast confidence is measured by fcstR2 (R-squared):
- R² > 0.5: High confidence forecast
- R² < 0.3: Lower confidence, wider potential range
Use this to size positions appropriately. Don't bet heavily on forecast edge when confidence is low.
Real-World Example
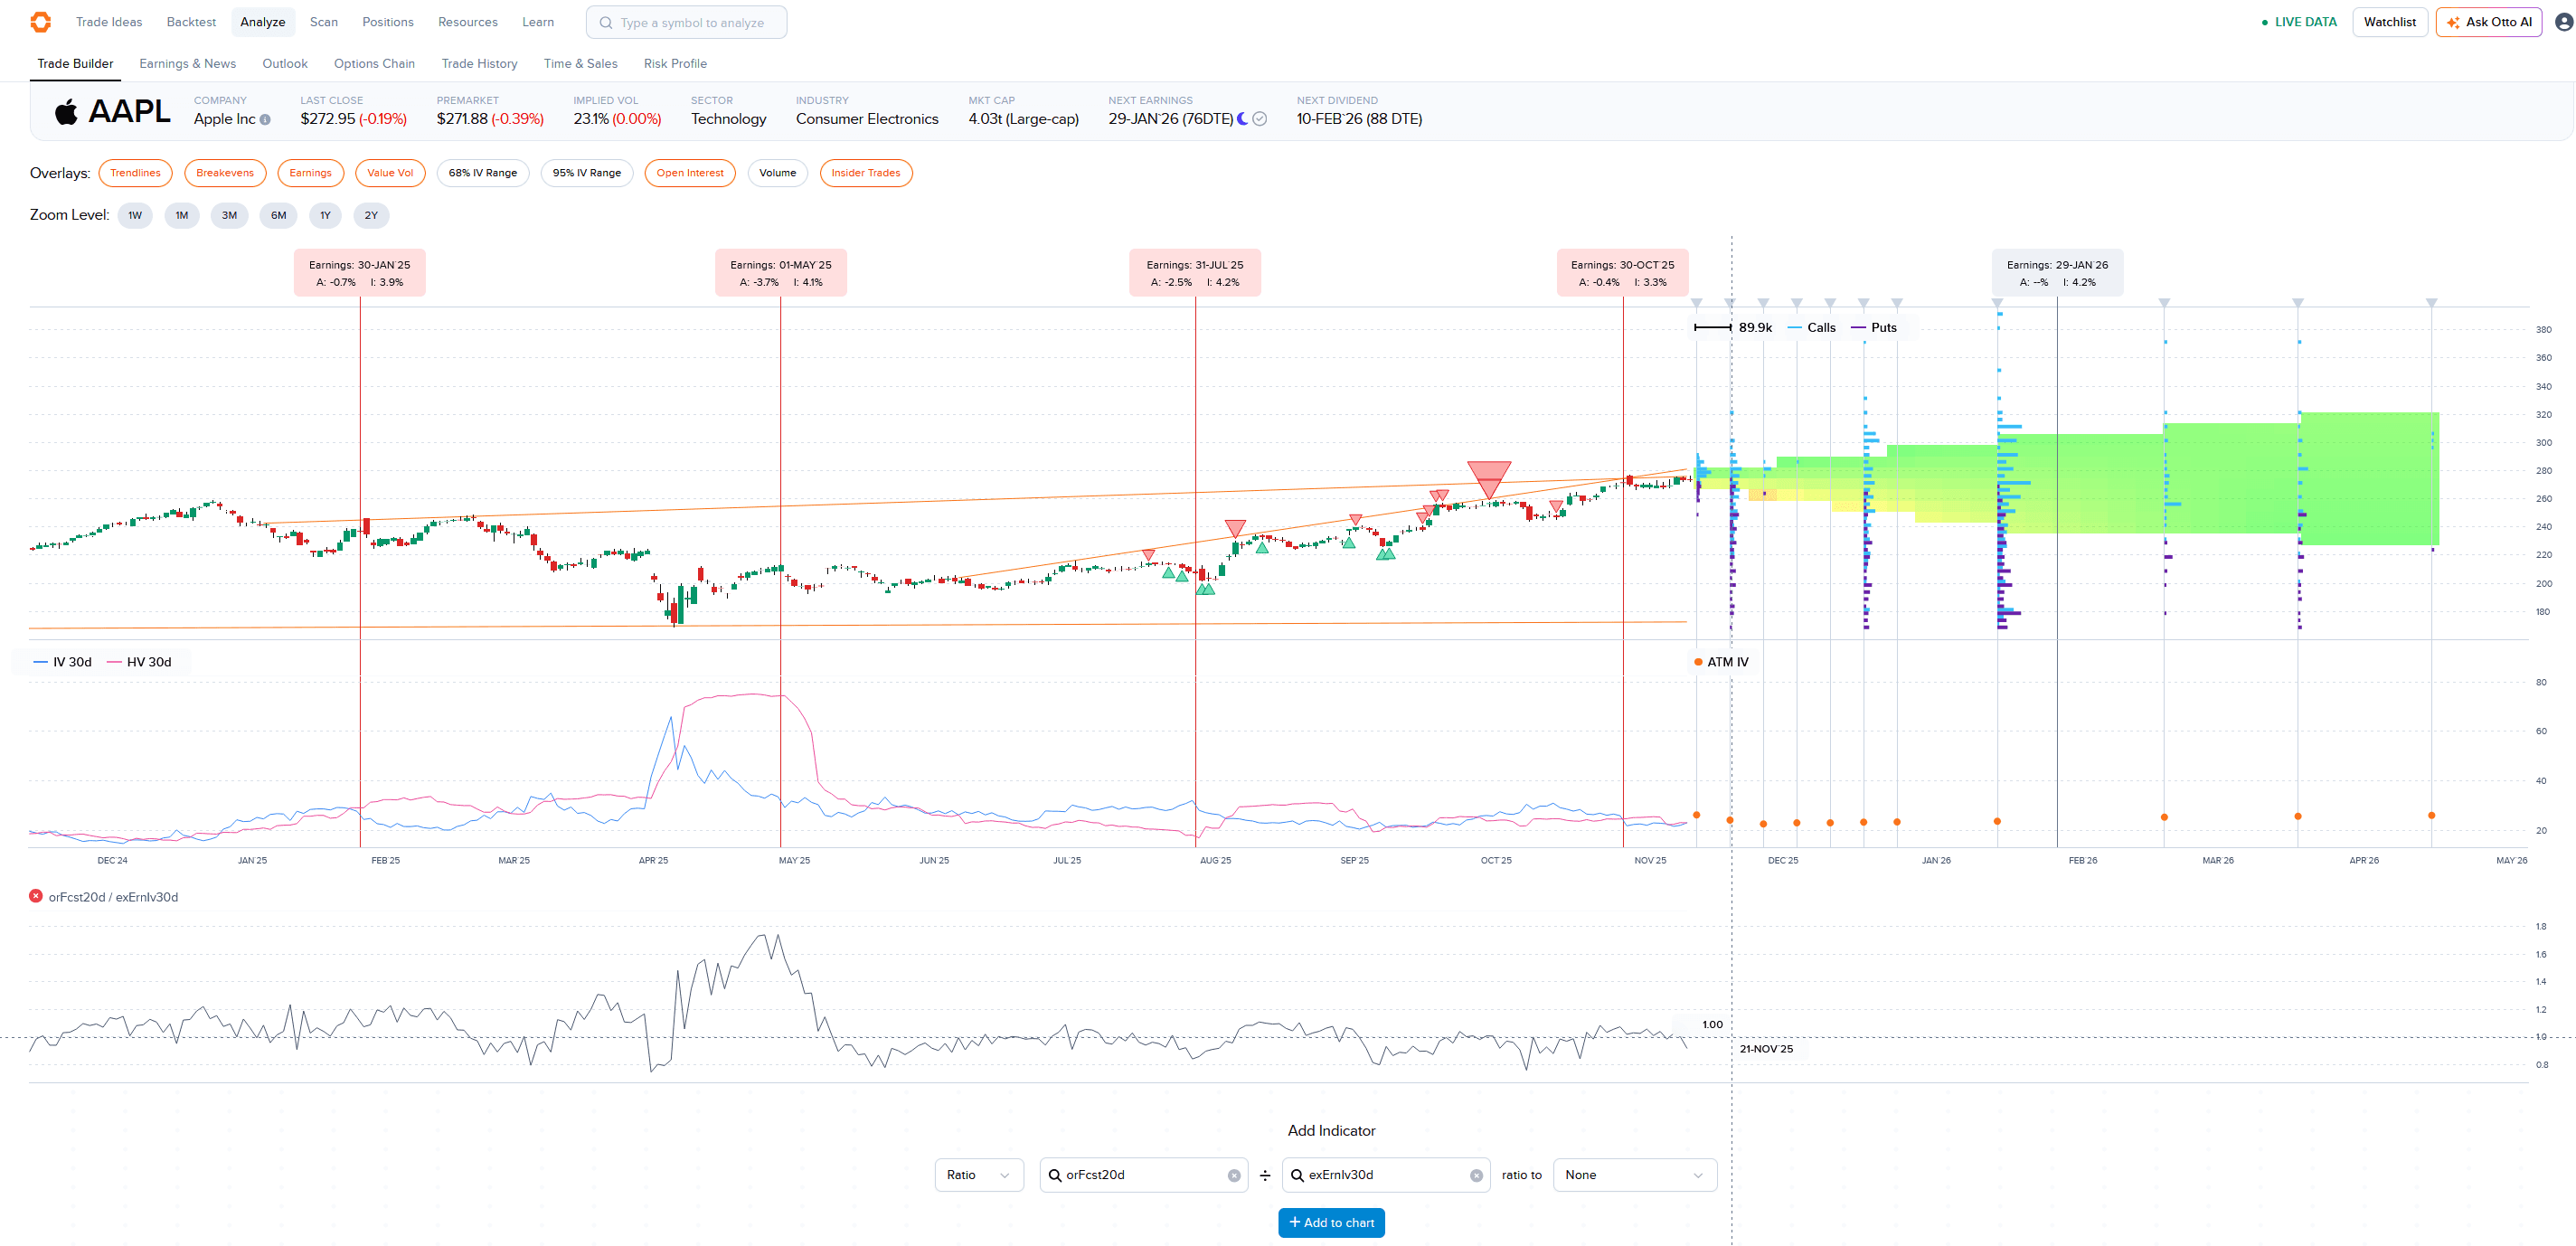
Figure: AAPL volatility forecast view with ORATS’ forward HV model, showing how implied volatility, ex-earnings HV, and forecast ranges align around upcoming earnings cycles.
Let's say you're looking at AAPL:
- Current iv30d: 25%
- orFcst20d: 21%
- orHvXern20d: 19%
- fcstR2: 0.62 (good confidence)
Interpretation:
The market is pricing 25% vol, but our forecast suggests only 21% realized vol over the next 20 days, and recent ex-earnings HV has been running at 19%. With an R² of 0.62, we have decent confidence in this forecast.
Potential Trade:
Consider selling premium strategies like iron condors or credit spreads, as the market appears to be overpricing volatility relative to our forecast.
Why ORATS Forecasts Work
Our forecasts have shown predictive power (measured by R²) because they:
- Remove noise — Ex-earnings HV provides cleaner signals
- Combine multiple signals — HV, IV, sector data, earnings patterns
- Adapt to regime changes — Short-term forecasts capture momentum, long-term capture mean reversion
- Account for structure — Hard-to-borrow rates, dividend timing, earnings calendar
The fcstR2 field in our data tells you exactly how well our 20-day forecast has predicted actual 20-day future HV historically.
Getting Started with Forecasts
In the Dashboard
- Go to Stock Scanner
- Add columns: iv30d, orFcst20d, orFcst20d/iv30d
- Sort by the ratio to find biggest divergences
- Filter by fcstR2 > 0.4 for reliable forecasts
In the Backtest Optimizer
- Choose a base strategy (e.g., iron condor)
- Add entry indicator: orFcst20d < iv30d (selling overpriced vol)
- Look at p-values to see if forecast edge is statistically significant
- Refine with additional filters like confidence and IV rank
In the API
Access forecast fields in the /datav2/hist/cores or /datav2/cores.summaries endpoints:
- orFcst20d
- orIvFcst20d
- orFcstInf
- fcstR2
The Bottom Line
While most traders focus exclusively on what IV is doing right now, ORATS' HV forecasts give you a forward-looking edge. By comparing what the market is pricing (IV) to what we forecast will actually happen (HV), you can identify mispriced options and improve your strategy entry/exit timing.
The key is combining forecast signals with other ORATS indicators — IV rank, term structure, skew, confidence — to build robust, statistically-validated strategies.
Our 18+ years of historical data and continuous refinement of forecast models means you're not trading on hunches — you're trading on data-driven predictions with measurable track records.
Want to dive deeper? Check out our webinar on Using Forecasts of Volatility to Find Trades where we walk through practical examples of building forecast-based scans and strategies.
Access ORATS forecast data through the Dashboard at dashboard.orats.com or via our APIs. Questions? Contact support@orats.com.
Disclaimer:
The opinions and ideas presented herein are for informational and educational purposes only and should not be construed to represent trading or investment advice tailored to your investment objectives. You should not rely solely on any content herein and we strongly encourage you to discuss any trades or investments with your broker or investment adviser, prior to execution. None of the information contained herein constitutes a recommendation that any particular security, portfolio, transaction, or investment strategy is suitable for any specific person. Option trading and investing involves risk and is not suitable for all investors.
All opinions are based upon information and systems considered reliable, but we do not warrant the completeness or accuracy, and such information should not be relied upon as such. We are under no obligation to update or correct any information herein. All statements and opinions are subject to change without notice.
Past performance is not indicative of future results. We do not, will not and cannot guarantee any specific outcome or profit. All traders and investors must be aware of the real risk of loss in following any strategy or investment discussed herein.
Owners, employees, directors, shareholders, officers, agents or representatives of ORATS may have interests or positions in securities of any company profiled herein. Specifically, such individuals or entities may buy or sell positions, and may or may not follow the information provided herein. Some or all of the positions may have been acquired prior to the publication of such information, and such positions may increase or decrease at any time. Any opinions expressed and/or information are statements of judgment as of the date of publication only.
Day trading, short term trading, options trading, and futures trading are extremely risky undertakings. They generally are not appropriate for someone with limited capital, little or no trading experience, and/ or a low tolerance for risk. Never execute a trade unless you can afford to and are prepared to lose your entire investment. In addition, certain trades may result in a loss greater than your entire investment. Always perform your own due diligence and, as appropriate, make informed decisions with the help of a licensed financial professional.
Commissions, fees and other costs associated with investing or trading may vary from broker to broker. All investors and traders are advised to speak with their stock broker or investment adviser about these costs. Be aware that certain trades that may be profitable for some may not be profitable for others, after taking into account these costs. In certain markets, investors and traders may not always be able to buy or sell a position at the price discussed, and consequently not be able to take advantage of certain trades discussed herein.
Be sure to read the OCCs Characteristics and Risks of Standardized Options to learn more about options trading.
Related Posts