Indicators
Friday, May 27th 2022
Market Looks To Firm Up According To Implied Volatility Indicators
Implied volatility, contango, and forward volatility can be used to predict underlying movement. Ex-earnings IV for stocks is explained. Backwardation is described as is the flat volatility method.
Summary
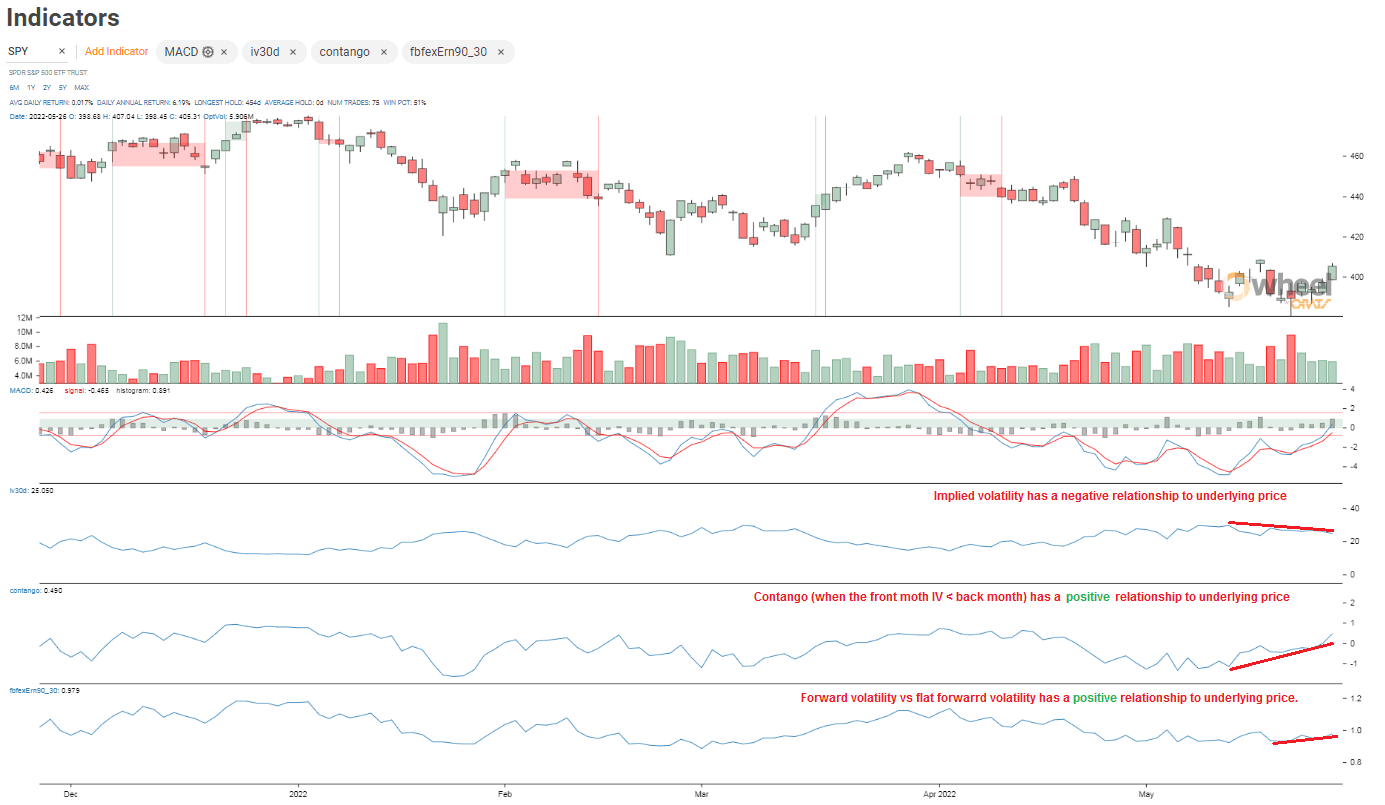
Implied volatility, contango, and forward volatility are three indicators that have predictive qualities for underlying direction in the market. Implied volatility has a negative relationship with underlying prices for equities, while contango is positively correlated with underlying prices and represents a normal market. Forward volatility can be calculated using a standard method or a flat forward calculation, with the ratio of the two producing a measure of market duress. Monitoring signals can be triggered by moving averages or trendlines, with ORATS producing both daily and minute-by-minute observations.
There is much hand-wringing in the news about the market. It is helpful to cut through the noise of the pundits and see what the options market is saying about the market.
At ORATS, we have identified three indicators in our backtesting that have predictive qualities for underlying direction, implied volatility, contango, and forward volatility.
Implied Volatility
Implied volatility is calculated by using the options price in an options pricing formula and solving for the volatility that matches the options price with the formula calculation. For equity options, there is a largely negative relationship of implied volatility with underlying prices as equities tend to move down faster than up. Other types of assets like gold or crypto tend to move up faster than down and have a positive relationship to implied.
For individual stocks, the quarterly earnings announcement has a positive impact on the implied volatility. This impact should be taken out of the implied volatility so a cleaner comparison can be made for the project at hand, finding predictive indicators for underlying direction. The ex-earnings implied volatility is calculated side by side to the regular volatility and should be used here. Ex-earnings implied volatility for ETFs is the same as implied volatility as there are no earnings.
Contango
Contango measures the slope of the implied volatility centering at 45 days to expiration. A positive measure is more contango, when the implied volatilities of the expirations near term are lower than the longer term IVs. A negative slope is said to be in "backwardation" so named because equities are less commonly in this state. This happens when the IV of the front months are bid up, usually to protect traders from a down move in the stock.
Contango is positively correlated with underlying prices. This state generally represents a market that is perceived by options traders as normal. Negative contango or backwardation represents a market in duress for options traders.
Forward Volatility
A forward volatility calculation is based on the options price relationships for the time between two expirations in the future. That time gap has an implied forward volatility associated with it that can be calculated. There are two ways generally used to calculate the IV between dates, 1) standard forward volatility and 2) implying a volatility using an options pricing model to solve for implied volatility of the price of the calendar spread we call the flat forward calculation.
The forward volatility ratio of the flat forward and standard forward produces a measure of market duress. As markets get more volatile and IVs rise, the ratio falls. The flat forward volatility does not go as high as the forward calculation when IV is high and does not go as low when vol is low. The flat calculation is stickier.
Monitoring Signals
Typically, there are two ways to measure oscillation signals, with moving averages and with trendlines. A signal might be triggered when a moving average crosses a longer term moving average. With trendlines, when a upper resistance or a lower support is breached a signal is triggered.
The graph above shows daily calculations which can be used for longer term market signals. ORATS also produces minute by minute observations that can be used for intraday signals.
Disclaimer:
The opinions and ideas presented herein are for informational and educational purposes only and should not be construed to represent trading or investment advice tailored to your investment objectives. You should not rely solely on any content herein and we strongly encourage you to discuss any trades or investments with your broker or investment adviser, prior to execution. None of the information contained herein constitutes a recommendation that any particular security, portfolio, transaction, or investment strategy is suitable for any specific person. Option trading and investing involves risk and is not suitable for all investors.
All opinions are based upon information and systems considered reliable, but we do not warrant the completeness or accuracy, and such information should not be relied upon as such. We are under no obligation to update or correct any information herein. All statements and opinions are subject to change without notice.
Past performance is not indicative of future results. We do not, will not and cannot guarantee any specific outcome or profit. All traders and investors must be aware of the real risk of loss in following any strategy or investment discussed herein.
Owners, employees, directors, shareholders, officers, agents or representatives of ORATS may have interests or positions in securities of any company profiled herein. Specifically, such individuals or entities may buy or sell positions, and may or may not follow the information provided herein. Some or all of the positions may have been acquired prior to the publication of such information, and such positions may increase or decrease at any time. Any opinions expressed and/or information are statements of judgment as of the date of publication only.
Day trading, short term trading, options trading, and futures trading are extremely risky undertakings. They generally are not appropriate for someone with limited capital, little or no trading experience, and/ or a low tolerance for risk. Never execute a trade unless you can afford to and are prepared to lose your entire investment. In addition, certain trades may result in a loss greater than your entire investment. Always perform your own due diligence and, as appropriate, make informed decisions with the help of a licensed financial professional.
Commissions, fees and other costs associated with investing or trading may vary from broker to broker. All investors and traders are advised to speak with their stock broker or investment adviser about these costs. Be aware that certain trades that may be profitable for some may not be profitable for others, after taking into account these costs. In certain markets, investors and traders may not always be able to buy or sell a position at the price discussed, and consequently not be able to take advantage of certain trades discussed herein.
Be sure to read the OCCs Characteristics and Risks of Standardized Options to learn more about options trading.
Related Posts