Indicators
Monday, April 25th 2022
Earnings Crush Implied Volatility
The fall of implied volatility after earnings is the earnings crush.
Summary
Earnings crush is the fall in implied volatility after earnings is announced, with front month expirations generally having higher IVs than back months. Measuring the effect involves estimating where IV will fall in each expiration, with a rational term structure where expirations fit into a smooth curve drawn over time. An options trade to take advantage of high IV vs ex-earnings IV is a time spread or calendar.
Earnings crush is the fall in implied volatility after earnings is announced. Typically, earnings announcements cause the price of the stock to move more than normal. The move will have more effect on short dated expirations since the day of earnings large move has more weight than the rest of the days with normal moves. For this reason, front month expirations will generally have higher IVs than back months. After earnings, the implied volatility falls more in the front months than in the back months for this reason.
There are various measurements to view this effect. Measuring the effect starts with estimating where IV will fall in each of the expirations. This can be accomplished by estimating an earnings effect in each month and varying the effect until the relationship between the IVs make a rational term structure. A rational term structure is where the expirations fit into a smooth curve drawn over time. The term structure is not necessarily a flat as many calculations use. Sometimes the term structure will solve to contango, with a a lower front month, or in backwardation with higher front IVs than back month IVs.
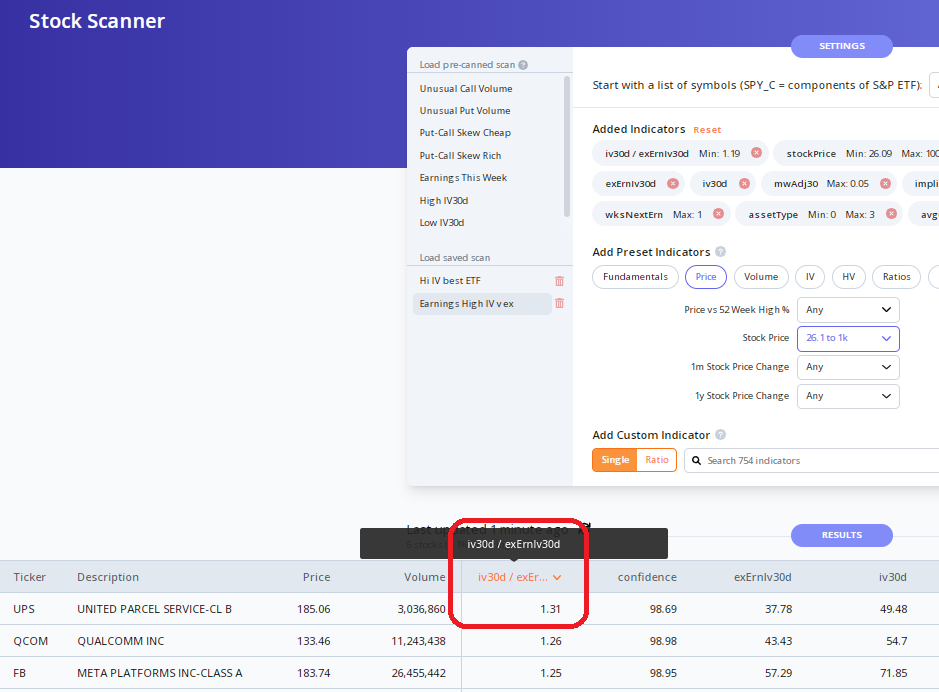
When the part of IV that is the earnings effect is extracted from the raw IV, an ex-earnings IV can be compared. Below is a list of stocks with IV 30 day divided by ex-earnings IV 30 day sorted from highest to lowest.
UPS is the highest ratio at 1.31 with the IV=49.48% and ex earnings IV=37.78%.
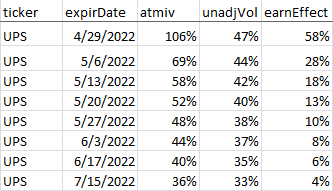
Here's a view of the monthly unadjusted ATM IV for UPS. May 27th is about 30 days out and the IV is 48%. Constructing a rational term structure taking out an earnings effect over the months makes a 38% ex earnings IV for May 27th. The front month of 4/29/22 trading at 106% IV is expected to come down to 47%. The term structure, post earnings is still in backwardwardation.
An options trade to take advantage of this high IV vs ex earnings IV is a time spread or calendar.
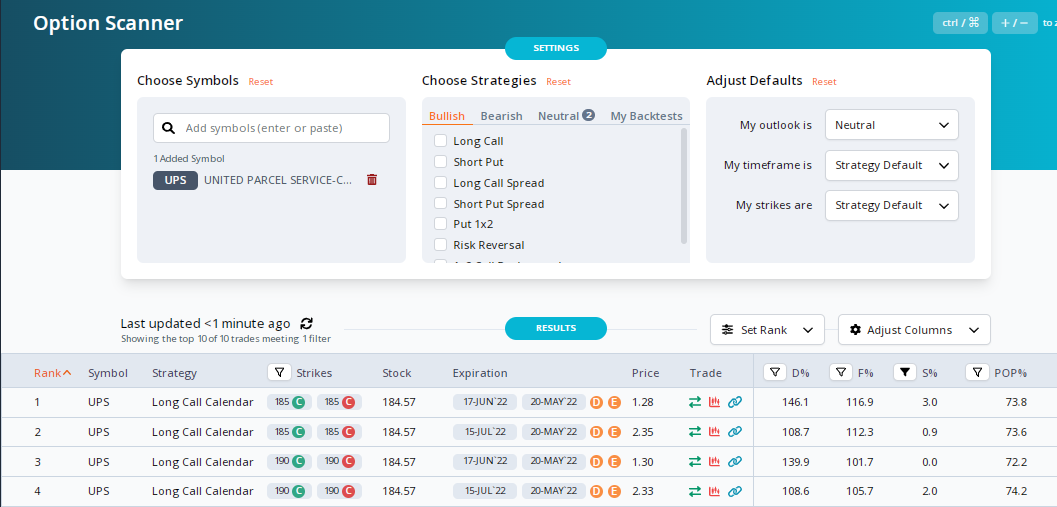
The May-20 June-17 $185 Long Call Calendar has the following profile:
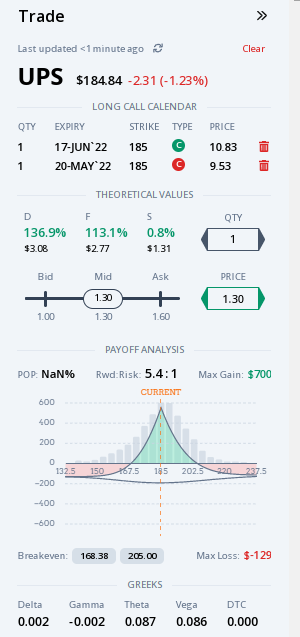
The break even points are estimated at $168.38 -9% and $205 +11%.
The history of UPS moves versus expectations are below:
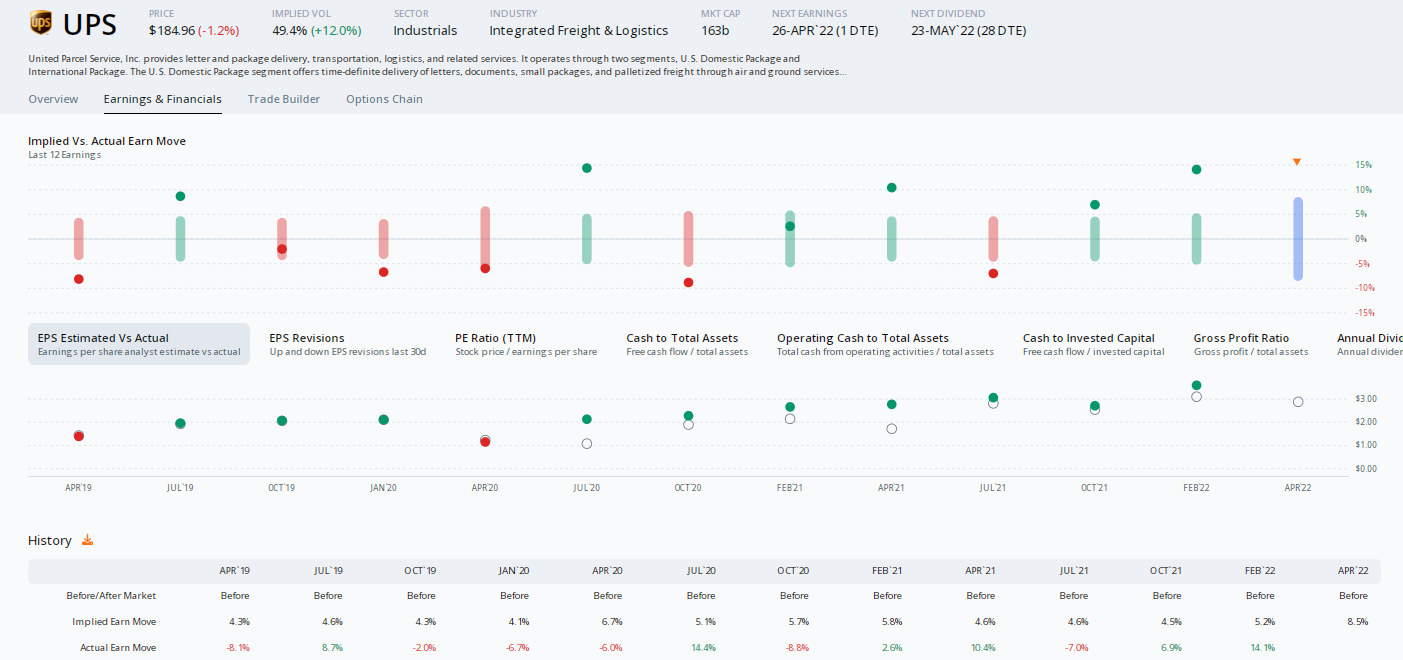
There are two moves of +14% in the last 12 observations but the rest of the earnings moves would probably result in a winning trade.
Disclaimer:
The opinions and ideas presented herein are for informational and educational purposes only and should not be construed to represent trading or investment advice tailored to your investment objectives. You should not rely solely on any content herein and we strongly encourage you to discuss any trades or investments with your broker or investment adviser, prior to execution. None of the information contained herein constitutes a recommendation that any particular security, portfolio, transaction, or investment strategy is suitable for any specific person. Option trading and investing involves risk and is not suitable for all investors.
All opinions are based upon information and systems considered reliable, but we do not warrant the completeness or accuracy, and such information should not be relied upon as such. We are under no obligation to update or correct any information herein. All statements and opinions are subject to change without notice.
Past performance is not indicative of future results. We do not, will not and cannot guarantee any specific outcome or profit. All traders and investors must be aware of the real risk of loss in following any strategy or investment discussed herein.
Owners, employees, directors, shareholders, officers, agents or representatives of ORATS may have interests or positions in securities of any company profiled herein. Specifically, such individuals or entities may buy or sell positions, and may or may not follow the information provided herein. Some or all of the positions may have been acquired prior to the publication of such information, and such positions may increase or decrease at any time. Any opinions expressed and/or information are statements of judgment as of the date of publication only.
Day trading, short term trading, options trading, and futures trading are extremely risky undertakings. They generally are not appropriate for someone with limited capital, little or no trading experience, and/ or a low tolerance for risk. Never execute a trade unless you can afford to and are prepared to lose your entire investment. In addition, certain trades may result in a loss greater than your entire investment. Always perform your own due diligence and, as appropriate, make informed decisions with the help of a licensed financial professional.
Commissions, fees and other costs associated with investing or trading may vary from broker to broker. All investors and traders are advised to speak with their stock broker or investment adviser about these costs. Be aware that certain trades that may be profitable for some may not be profitable for others, after taking into account these costs. In certain markets, investors and traders may not always be able to buy or sell a position at the price discussed, and consequently not be able to take advantage of certain trades discussed herein.
Be sure to read the OCCs Characteristics and Risks of Standardized Options to learn more about options trading.
Related Posts