Indicators
Friday, May 27th 2022
Options 101: Implied Volatility Calculation And Uses
Options pricing models produce theoretical values for options and implied volatilities. Here we show common methods for calculating IV and how to interpret them.
Summary
Implied volatility (IV) is a crucial data point in options trading, allowing for normalization of options prices. IV is calculated using an options pricing model, with volatility being the least known and most important input. Monthly IV, constant maturity IV, IV skew, and IVs at various deltas are all commonly used measurements of IV. The low strikes of equities typically have a higher IV than high strikes due to the options implied volatility skew. Showing IVs for deltas can be helpful in comparing over time and across constant maturities.
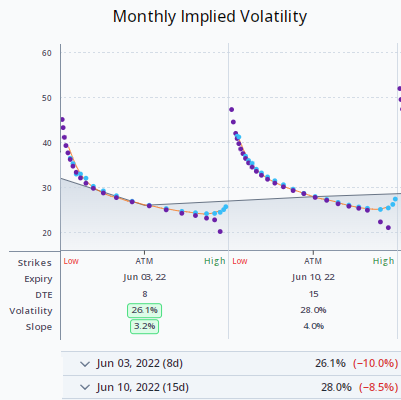
Implied volatility (IV) is the most important options data point next to options prices. Implied volatility allows users to make sense of options prices by normalizing to a more uniform metric. In a perfect world, all of the options at all strikes and expirations for an underlying would have the same implied volatility even through the options prices are different. In the real world, implied volatility has a slope or skew and each month is different. For most equities, the low strikes have a higher IV than the high strikes as seen below.
Calculating Implied Volatility
Implied volatility is calculated by using an options pricing model. The typical use of a pricing model is to use the following inputs to create a theoretical options value:
- Options strike price
- Time to expiration
- Underlying stock price
- Interest and dividend rates
- Volatility
Of these inputs, volatility is the least known, has a large impact and because of this, the most important. The options pricing model assumes that you have a volatility to input. However, if you do not have a volatility but you have a theoretical or market price, you can solve for the implied volatility by gradually changing the volatility until the theoretical price matches the options price. The final volatility that produces the equal price is the implied volatility of the option.
There are other measurements of implied volatility that are typically used, like monthly IV, constant maturity IV, skew of the IV, and IVs at various deltas.
Monthly IV
Communicating the implied volatility of a particular expiration is important to options traders. In the graphic above, the monthly IVs are shown as is the change on the day. The monthly IV is found by taking all the options and calculating a weighted average, weighting the ones towards the middle 50 delta higher.
Constant Maturity IV
Typical constant maturities of 30, 60 and 90 days to expiration are useful to compare to each other and over time. Constant maturities are calculated by taking a weighted average of the IVs for the two closest expirations to the days of the constant maturity.
IV Skew
The difference in implied volatility of lower strikes to the higher strikes in a particular expiration produces a sloped line referred to as the options implied volatility skew. Typically, the low strikes have a higher IV because underlying equity prices tend to fall faster than they rise and options investors are willing to pay more for lower striked options.
IVs For Deltas
Another way to present IVs are to show them at various deltas. The delta of an option ranges between 0 and 1 for calls and 0 and -1 for puts and is defined as the amount of the change in options theoretical price for every one dollar change in the underlying price. Showing IVs for deltas are helpful to compare over time and across constant maturities. For example, the 5 delta out of the money IVs have risen relative to other deltas since the RobinHood retail effect of buying these calls hit the market.
Disclaimer:
The opinions and ideas presented herein are for informational and educational purposes only and should not be construed to represent trading or investment advice tailored to your investment objectives. You should not rely solely on any content herein and we strongly encourage you to discuss any trades or investments with your broker or investment adviser, prior to execution. None of the information contained herein constitutes a recommendation that any particular security, portfolio, transaction, or investment strategy is suitable for any specific person. Option trading and investing involves risk and is not suitable for all investors.
All opinions are based upon information and systems considered reliable, but we do not warrant the completeness or accuracy, and such information should not be relied upon as such. We are under no obligation to update or correct any information herein. All statements and opinions are subject to change without notice.
Past performance is not indicative of future results. We do not, will not and cannot guarantee any specific outcome or profit. All traders and investors must be aware of the real risk of loss in following any strategy or investment discussed herein.
Owners, employees, directors, shareholders, officers, agents or representatives of ORATS may have interests or positions in securities of any company profiled herein. Specifically, such individuals or entities may buy or sell positions, and may or may not follow the information provided herein. Some or all of the positions may have been acquired prior to the publication of such information, and such positions may increase or decrease at any time. Any opinions expressed and/or information are statements of judgment as of the date of publication only.
Day trading, short term trading, options trading, and futures trading are extremely risky undertakings. They generally are not appropriate for someone with limited capital, little or no trading experience, and/ or a low tolerance for risk. Never execute a trade unless you can afford to and are prepared to lose your entire investment. In addition, certain trades may result in a loss greater than your entire investment. Always perform your own due diligence and, as appropriate, make informed decisions with the help of a licensed financial professional.
Commissions, fees and other costs associated with investing or trading may vary from broker to broker. All investors and traders are advised to speak with their stock broker or investment adviser about these costs. Be aware that certain trades that may be profitable for some may not be profitable for others, after taking into account these costs. In certain markets, investors and traders may not always be able to buy or sell a position at the price discussed, and consequently not be able to take advantage of certain trades discussed herein.
Be sure to read the OCCs Characteristics and Risks of Standardized Options to learn more about options trading.
Related Posts