Trading
Monday, December 5th 2022
Lam Research LRCX: Playing Bullish Trends Via a Short Put Spread
Using a stock scanner and options scanner, we identify a short put spread trade on Lam Research LRCX.
Summary
This article discusses a short put spread trade on Lam Research (LRCX), a semiconductor equipment manufacturer. The trade is based on the stock's reasonable valuation, bullish chart, and attractive options. The article includes a detailed explanation of how the idea was found, the characteristics of the short put spread, and the fundamental and technical analysis of LRCX. The trade is a bullish out-of-the-money short-put spread with limited risk, with a risk to reward ratio of 1:5.5 and a high probability of profit of 85.5%.
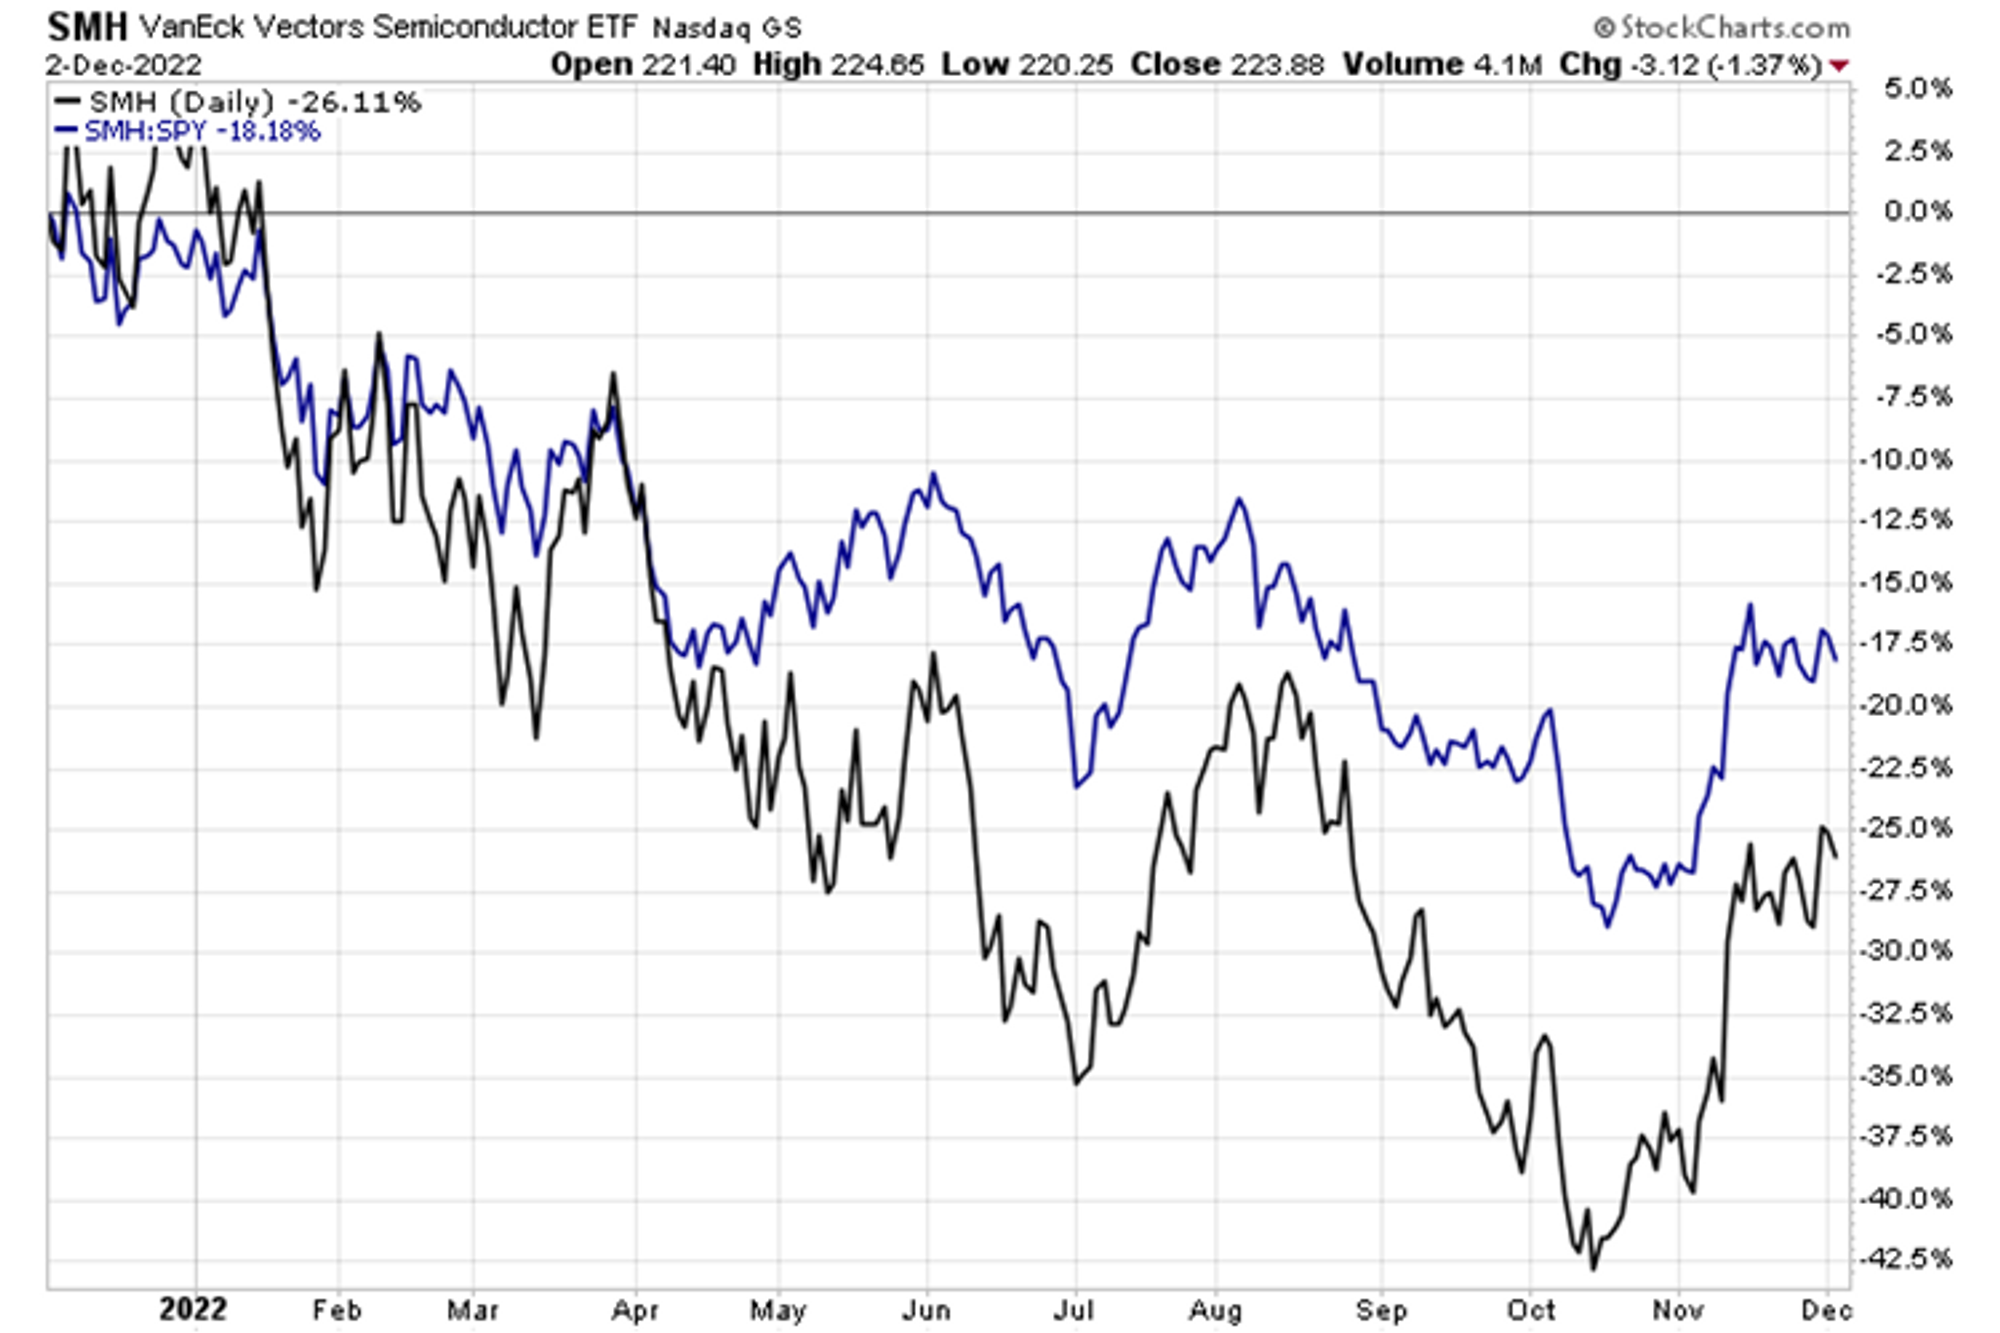
Call it a chip comeback. The VanEck Vectors Semiconductor ETF (SMH) has outpaced the S&P 500 ETF (SPY) since mid-October. Generally decent industry earnings reports despite dire fears, some optimism in China in recent weeks, and lower interest rates have all been tailwinds for the embattled semiconductor industry.
Some of the group’s biggest stocks have seen major snapbacks, but many investors wonder if it is yet another bear market rally. Today, we’ll look at one name that is reasonably valued, features a somewhat bullish chart, and has attractive options to play from the neutral to long side.
Semiconductor Stocks’ Comeback
Source: Stockcharts.com
Income Options Trade
With this idea, we identified stocks with strong underlying fundamentals that trade at reasonable valuations. Also important is a good technical setup so that we can spot favorable risk/reward plays with key price levels to watch. The options trade is a bullish out-of-the-money short-put spread with limited risk. Overall, we are looking to find the best options value based on the historical distribution of stock price returns.
How We Found the Idea
With a focus on value, liquidity, and stocks without a near-term earnings event, we screened for equities with trailing and forward price-to-earnings ratios between 10 and 25 – that rejects non-profitable firms, possible value traps, and shares that are too richly priced. We also wanted to home in on companies that are still valued highly by the market, so we filtered for those with price-to-book ratios above 5. Of course, with options, volatility is important, so we included only companies with an earnings announcement more than a month away. Finally, market caps larger than $20 million and firms with more than 5,000 employees were considered.
Short Put Spread Characteristics & Definitions
- Risk to reward is less than 7 times. The risk to reward is the maximum loss of the spread divided by the premium collected by selling the spread.
- Probability of profit is greater than 80%. The probability of profit is the total area under a distribution that results in a positive return of the spread. The distribution is built by observing stock price changes historically.
- The market width of the options prices is less than 17% of the stock price. The market width of the trade is the total ask minus bid of the long and short puts.
- Delta of less than 0.1. The delta is the estimated profit from a $1 increase in the stock price.
- We then sorted by a combination of reward to risk, probability of profit, and expected return versus price of the spread. The expected return of the spread is the value at each point in the distribution times the probability at that point.
Survey Says: Lam Research
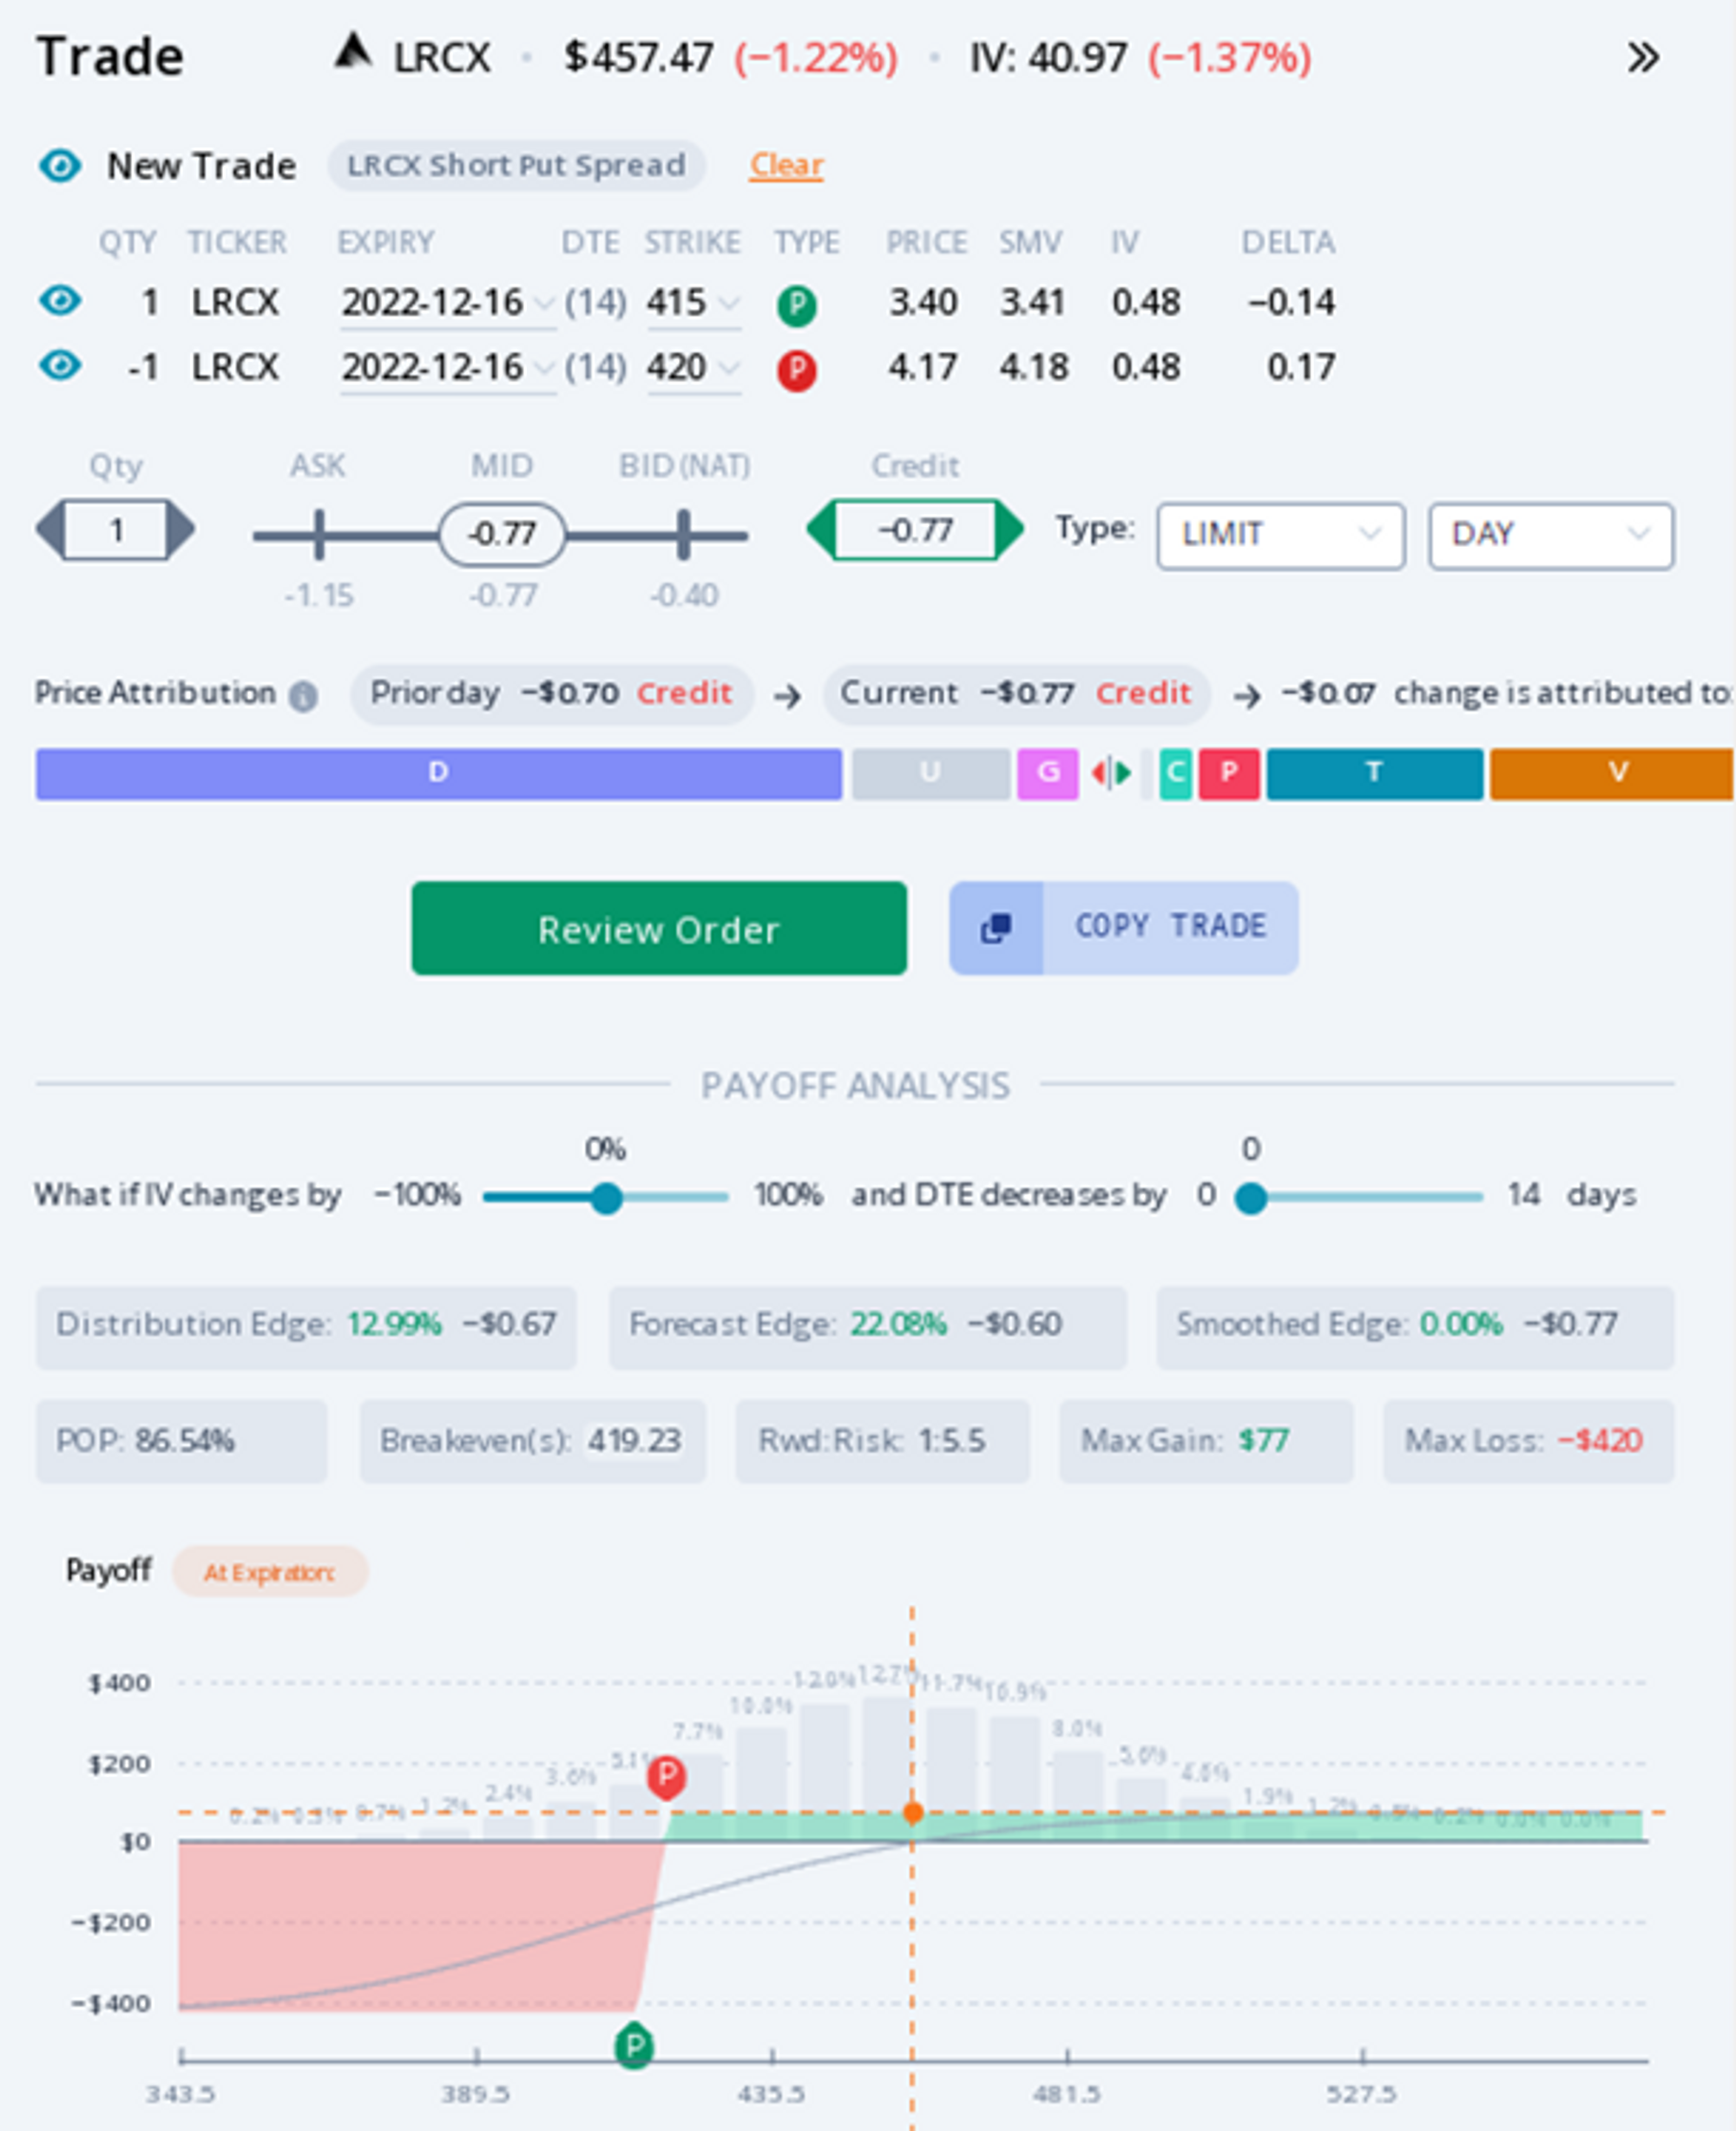
The top result was a bullish short put spread on Lam Research (LRCX) expiring on December 16. The $415 and $420 strikes are used. With a risk to reward ratio of 1:5.5 and a high probability of profit of 85.5%, the trade looks good for those with a near-term time horizon. The max gain is $78 while the max loss is $422 as of the close on Friday, December 2. The delta is low at just 0.03 and the market width is 16.4%. In all, you’d collect $0.77 of premium and would see a max gain so long as the stock is at or above the higher strike put at expiration.
The profit and loss distribution illustrated below shows that shares can pull back further before losses are incurred.
Short Put Spread: Where You’ll Make Money
In the graph below, the green shaded area is your profit payoff at various stock prices above the break-even of $419.23. The red shaded area below the break-even is the loss amount. The maximum loss is capped as the difference between the strikes less the amount of credit you received for selling the put spread. Here, the max loss is $420 minus $415 plus $0.77 times 100 (options prices are communicated on a per share basis but actually represent 100 shares per options contract) equaling -$423. The max gain is the amount received for selling the spread of $77.
Source: ORATS
Fundamental Focus
Let’s dive into the fundamentals and, later, the technicals of this neutral to bullish trade on Lam Research.
Lam Research Corporation designs, manufactures, markets, refurbishes, and services semiconductor processing equipment used in the fabrication of integrated circuits. It’s a leading supplier of wafer fabrication equipment and is an important player in servicing chip companies. The systems Lam Research helps facilitate allow the chip industry to produce smaller, faster, and better-performing semiconductors. Samsung, Taiwan Semi, and Intel are some of its largest customers.
After a tumultuous couple of years and more uncertainty ahead, LRCX remains the second-biggest semiconductor capital equipment company, according to Bank of America Global Research. Its unique industry position should allow the firm to weather economic uncertainty due to less cyclical exposure compared to its peers. Improved pricing in the chip space and loosening supply chains are potential tailwinds.
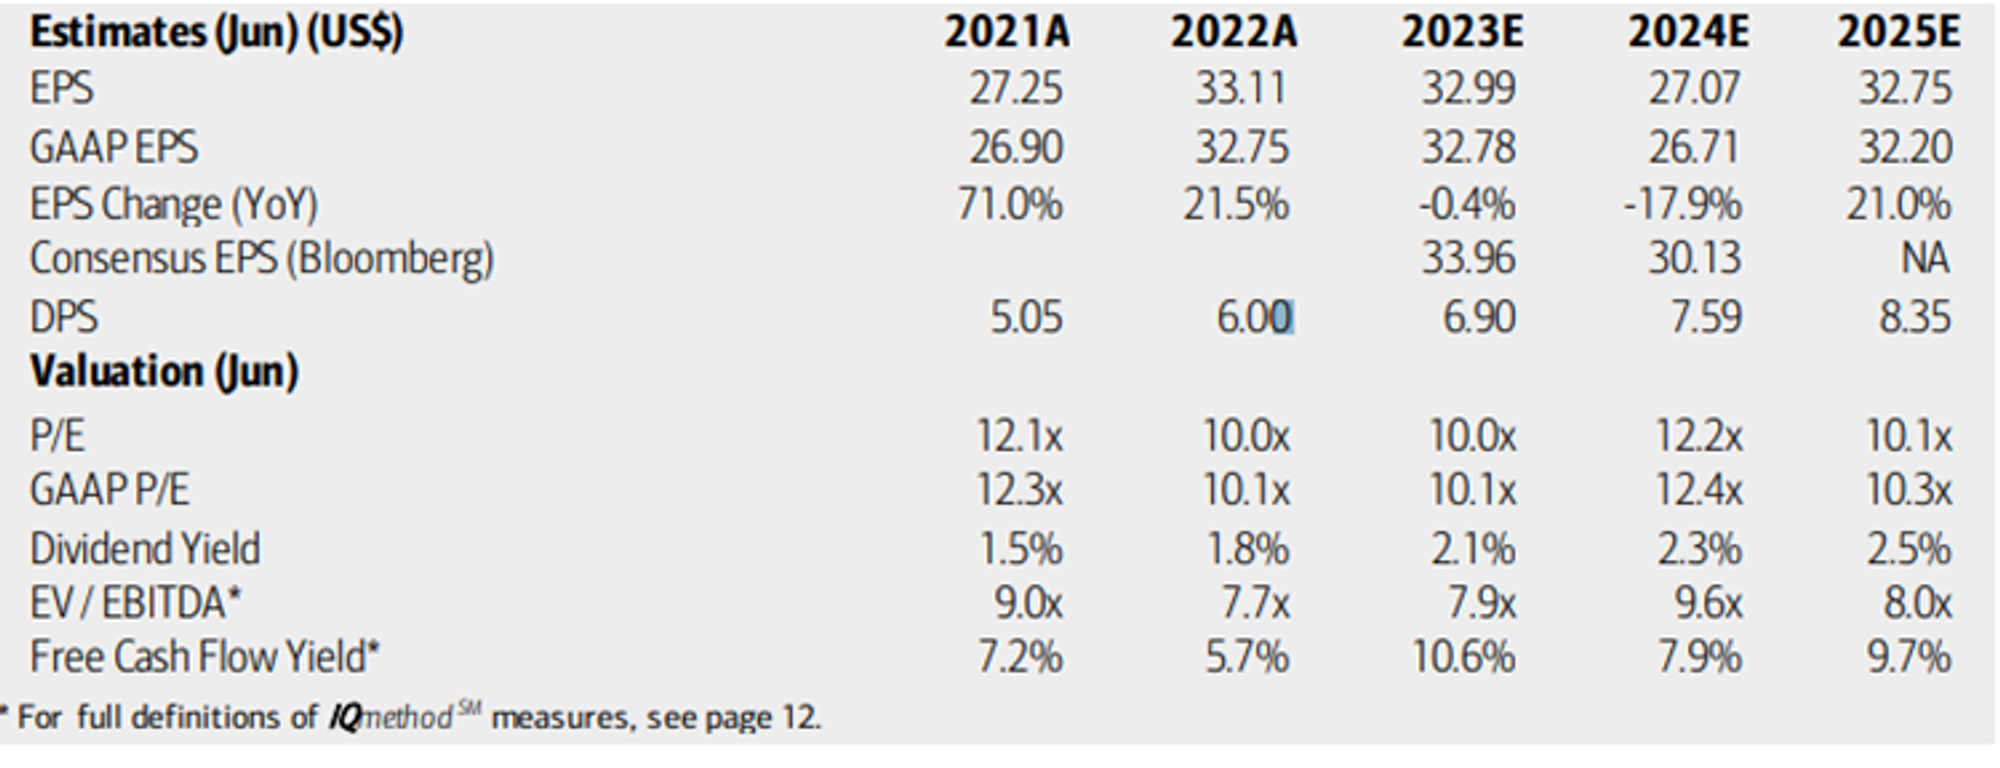
On valuation, earnings growth is seen as being difficult in the next two years before a 2025 rebound in forecast per-share profits. Dividends, meanwhile, are expected to grow in the coming years. With forward operating and GAAP P/Es in the low teens and a below-market EV/EBITDA multiple, the stock appears to have priced in a lot of negativity. Finally, LRCX boasts a strong 10% free cash flow yield using 2023 estimates. Overall, with shares almost 40% off the high from almost a year ago, there appears to be value in LRCX.
LRCX: A Dismal Profit Outlook, But Shares Attractively Priced
Source: BofA Global Research
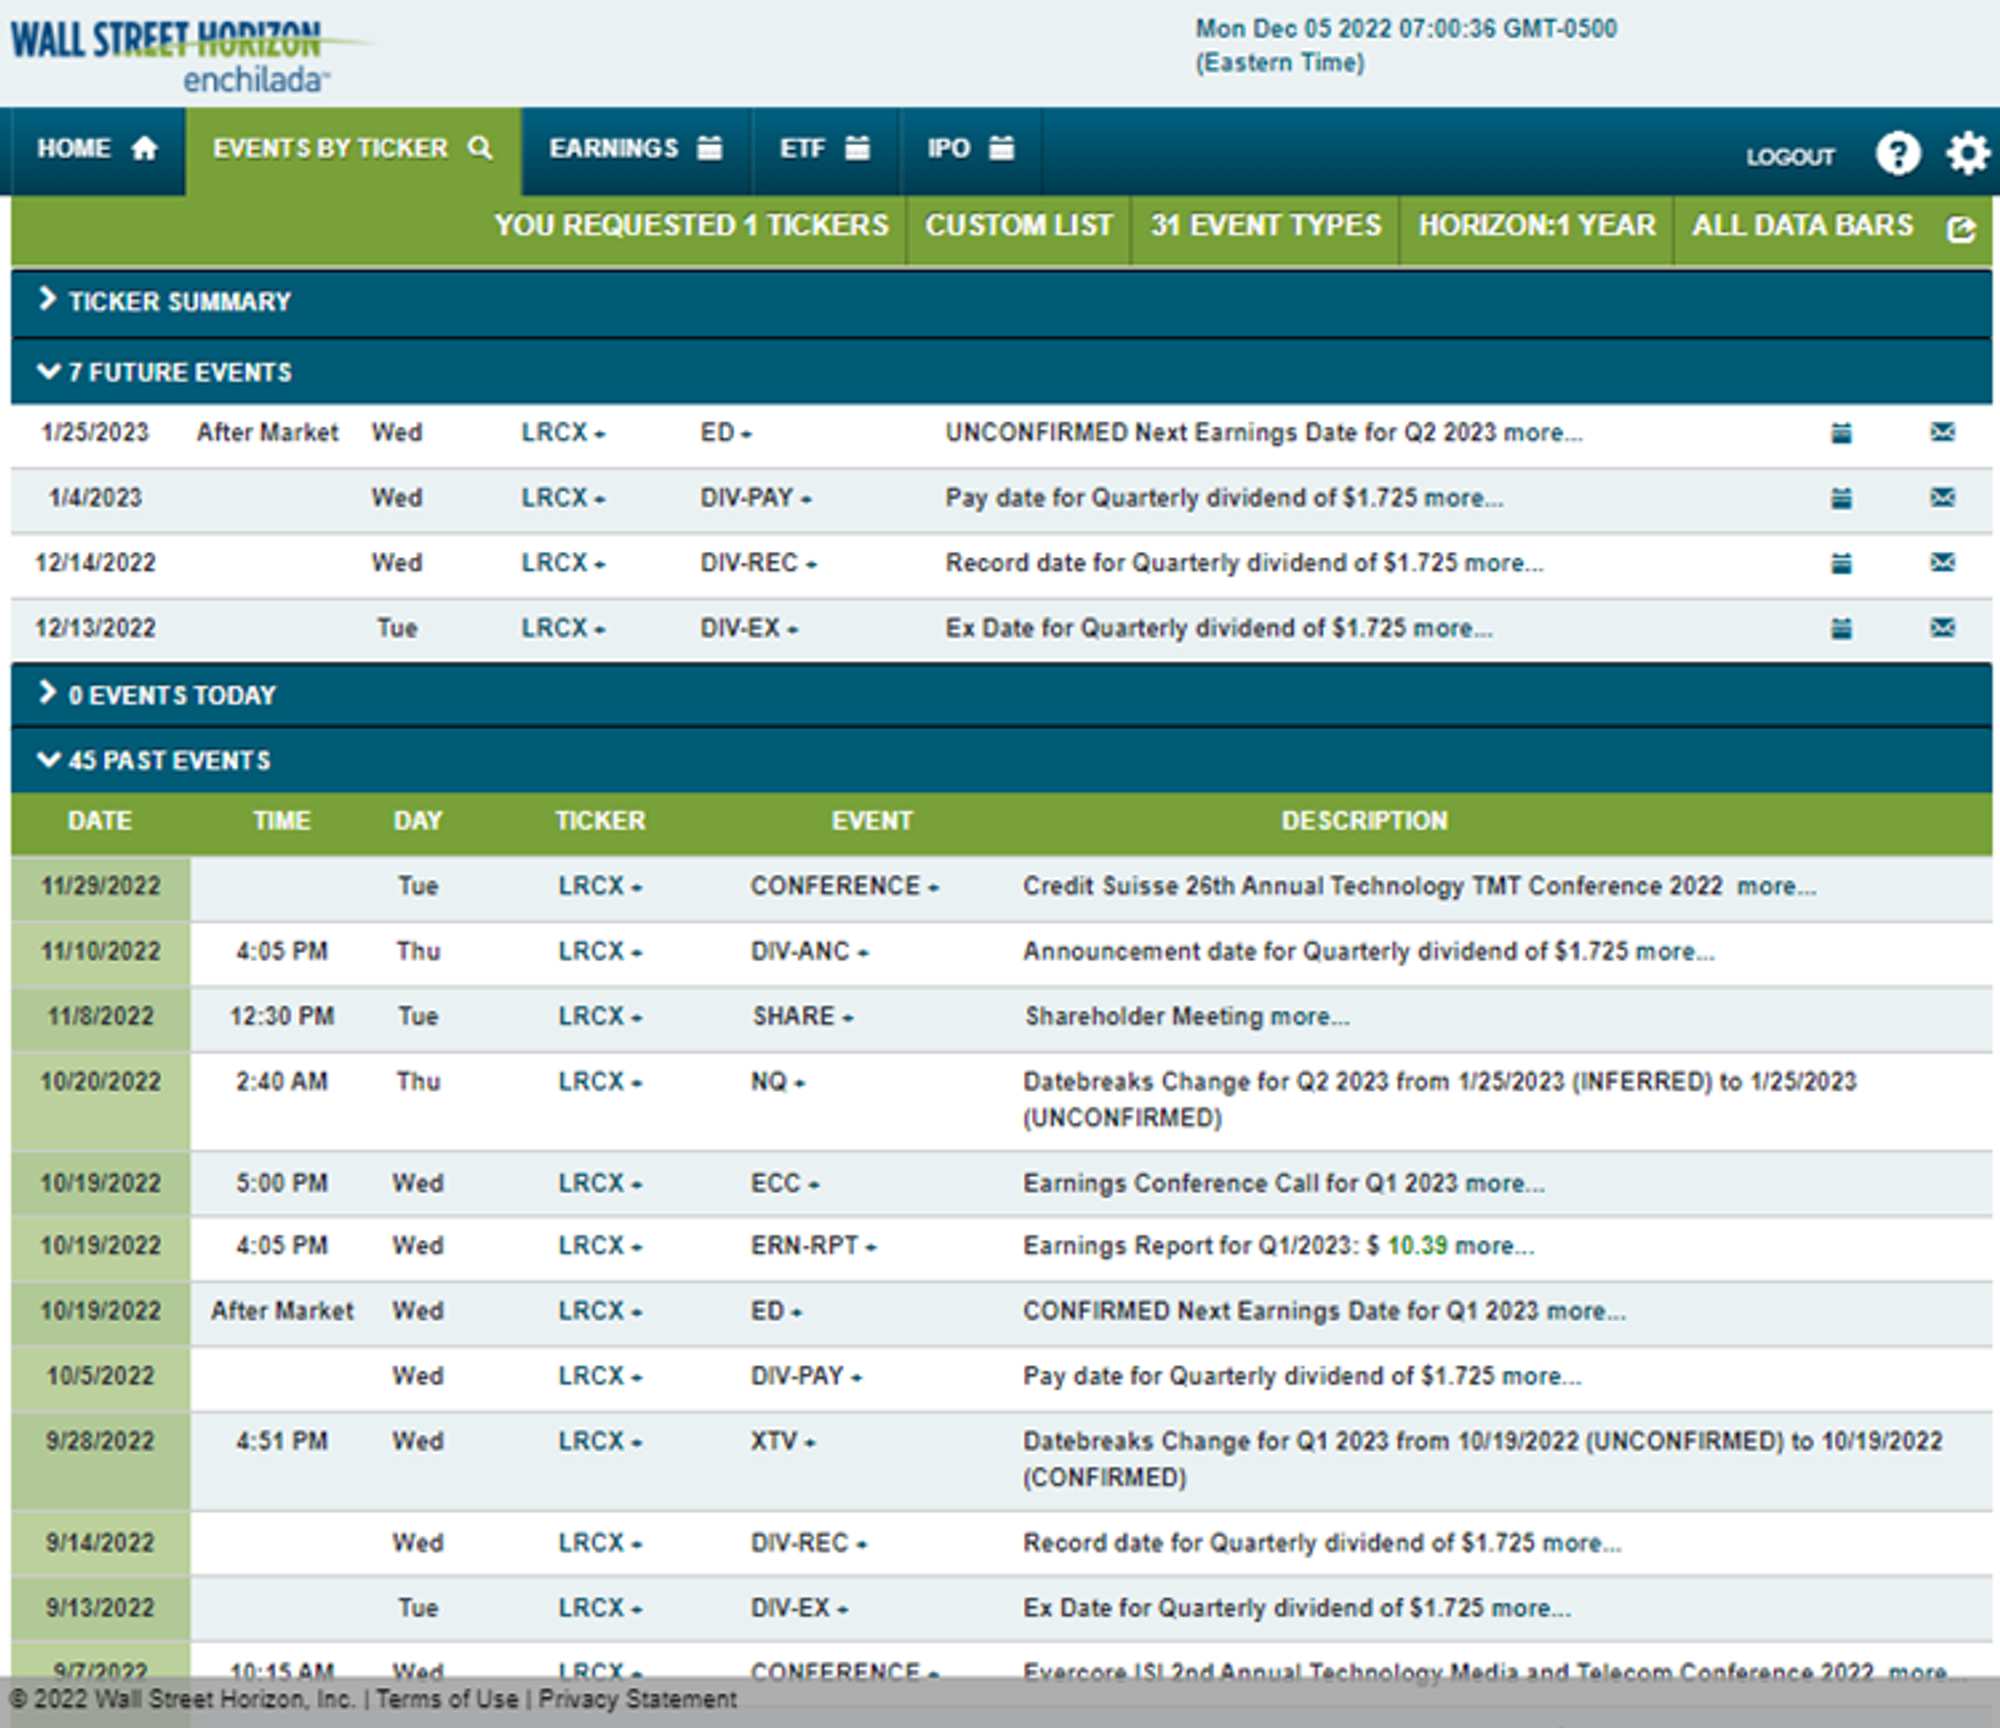
Looking ahead, there are no major volatility catalysts in the coming two weeks. The next earnings date is unconfirmed for Wednesday, January 25 AMC.
Corporate Event Calendar
Source: Wall Street Horizon
The Technical Take
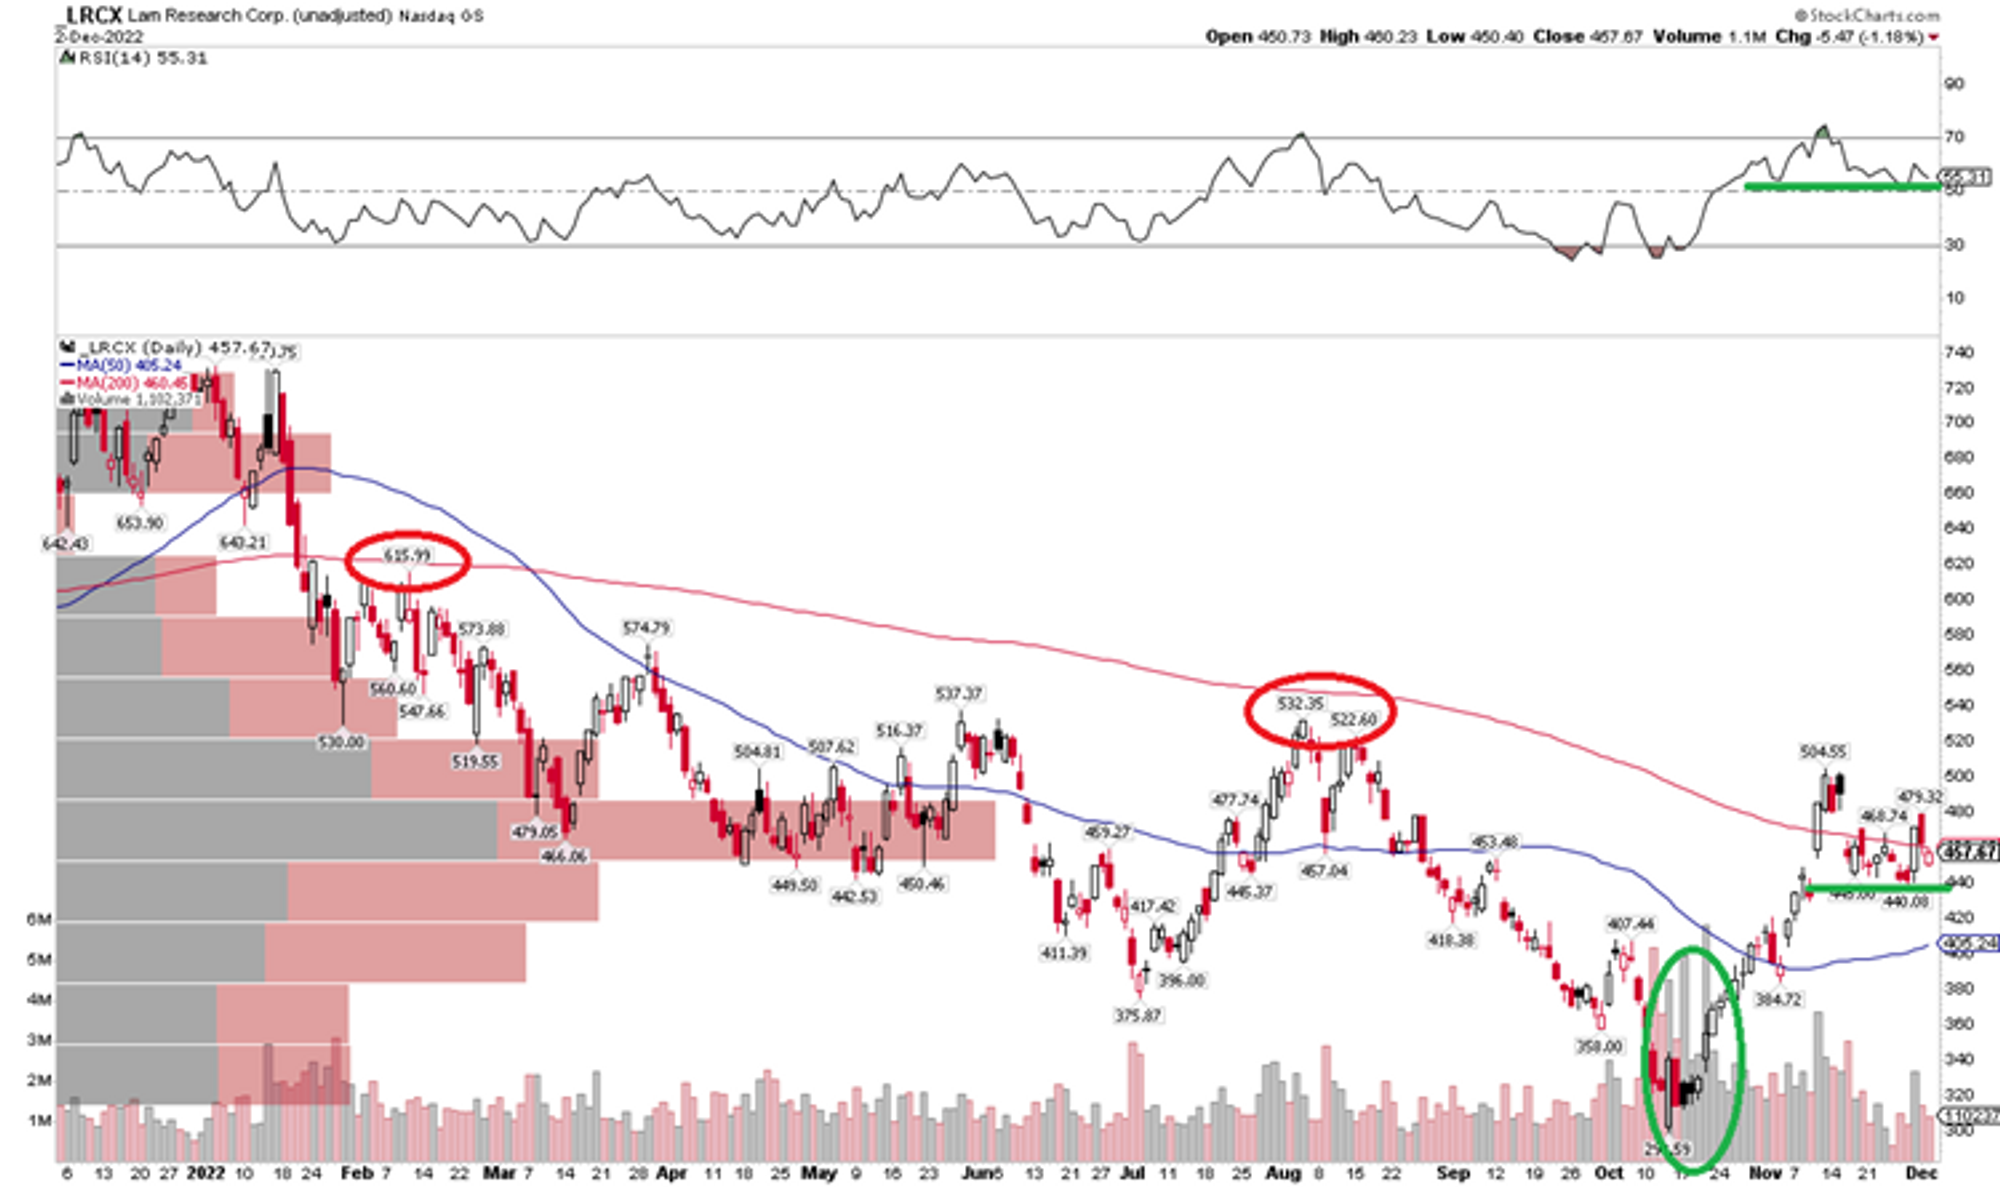
LRCX has recently rallied to near its declining 200-day moving average. Shares poked above that important trend indicator last month, but then wavered back below it on light volume recently. Notice in the chart below that the stock has found some near-term support near $440 – there is a mid-November gap there that was filled and successfully defended in recent days.
Also, the stock featured a major winning streak during the back half of October around and following its earnings report on the 19th of that month. The share price surge off the $300 level came on impressive volume. All told, the rally was nearly 70% to the mid-November peak, and the current consolidation, which has the hallmarks of a bull flag, should promote the chance of more consolidation above the high strike put outlined in the trade idea.
LRCX: Near-Term Support Near $440, Bull Flag?
Source: Stockcharts.com
The Bottom Line
Lam Research shares are taking a breather after a monster rally off the October low. The corrective pattern comes on low volume with support at $440. Options traders can play this trend with a short put spread using the $415 and $420 strikes expiring December 16.
Disclaimer:
The opinions and ideas presented herein are for informational and educational purposes only and should not be construed to represent trading or investment advice tailored to your investment objectives. You should not rely solely on any content herein and we strongly encourage you to discuss any trades or investments with your broker or investment adviser, prior to execution. None of the information contained herein constitutes a recommendation that any particular security, portfolio, transaction, or investment strategy is suitable for any specific person. Option trading and investing involves risk and is not suitable for all investors.
All opinions are based upon information and systems considered reliable, but we do not warrant the completeness or accuracy, and such information should not be relied upon as such. We are under no obligation to update or correct any information herein. All statements and opinions are subject to change without notice.
Past performance is not indicative of future results. We do not, will not and cannot guarantee any specific outcome or profit. All traders and investors must be aware of the real risk of loss in following any strategy or investment discussed herein.
Owners, employees, directors, shareholders, officers, agents or representatives of ORATS may have interests or positions in securities of any company profiled herein. Specifically, such individuals or entities may buy or sell positions, and may or may not follow the information provided herein. Some or all of the positions may have been acquired prior to the publication of such information, and such positions may increase or decrease at any time. Any opinions expressed and/or information are statements of judgment as of the date of publication only.
Day trading, short term trading, options trading, and futures trading are extremely risky undertakings. They generally are not appropriate for someone with limited capital, little or no trading experience, and/ or a low tolerance for risk. Never execute a trade unless you can afford to and are prepared to lose your entire investment. In addition, certain trades may result in a loss greater than your entire investment. Always perform your own due diligence and, as appropriate, make informed decisions with the help of a licensed financial professional.
Commissions, fees and other costs associated with investing or trading may vary from broker to broker. All investors and traders are advised to speak with their stock broker or investment adviser about these costs. Be aware that certain trades that may be profitable for some may not be profitable for others, after taking into account these costs. In certain markets, investors and traders may not always be able to buy or sell a position at the price discussed, and consequently not be able to take advantage of certain trades discussed herein.
Be sure to read the OCCs Characteristics and Risks of Standardized Options to learn more about options trading.
Related Posts


