Trading
Thursday, July 9th 2026
Leveraged ETFs: You Cannot Escape the Market's Crash Premium
TQQQ and SQQQ realize nearly identical volatility, but SQQQ options trade richer because the Nasdaq-100 crash premium follows the same risk through the inverse fund’s call wing.
Summary
Leveraged ETFs exhibit a consistent crash premium where inverse funds like SQQQ cost more than their bullish counterparts such as TQQQ, despite similar realized volatility; this premium stems from structural factors and option skew, remains evident across multiple leveraged pairs, and is most pronounced during market downturns, highlighting that the higher implied volatility in bear funds is not due to greater risk but to the market’s crash premium.
July 9, 2028
By Matt Amberson
TQQQ and SQQQ track the same index at three times leverage in opposite directions, so they deliver the same realized volatility: 86.61% and 86.65% at Wednesday's close, both near 3x QQQ's 29.06%. Their options do not cost the same. SQQQ's 30-day implied vol settled at 77.03% against TQQQ's 72.49%, and the bear fund has been the pricier of the two on 97.3% of the 3,461 settled sessions since 2011, with the mean gap positive in every calendar year. That premium is structural, and it is not payment for the bear fund being riskier.
A minus-3x fund's daily return is the plus-3x fund's with the sign flipped, so to first order a 20-day realized-vol window on one lands where the other's does.
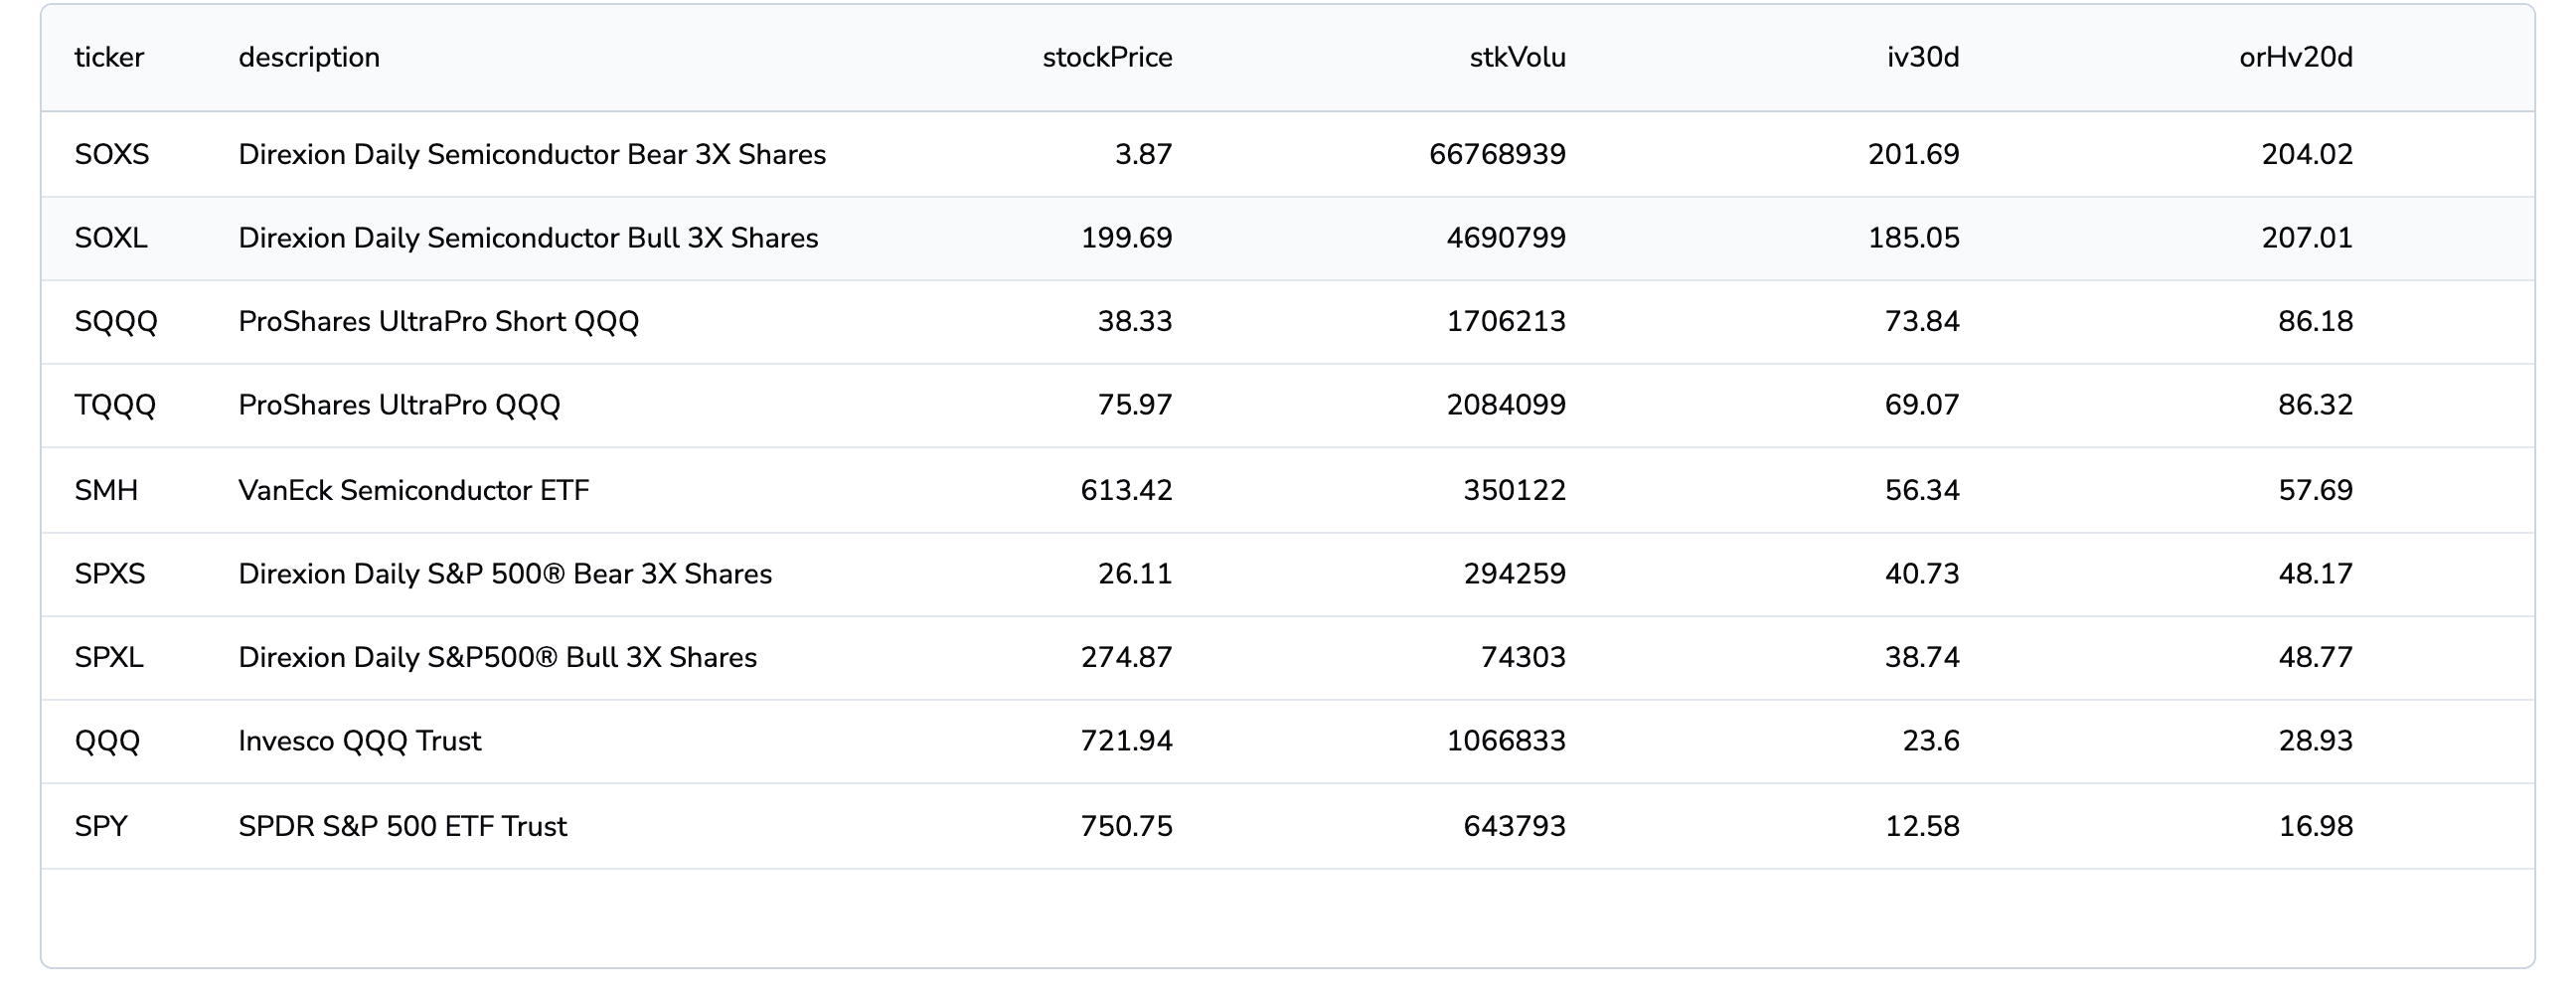
An ORATS Stock Scanner table of nine funds sorted by 30-day implied vol descending, with columns ticker, description, stockPrice, stkVolu, iv30d and orHv20d: SOXS 201.69 and 204.02, SOXL 185.05 and 207.01, SQQQ 73.84 and 86.18, TQQQ 69.07 and 86.32, SMH 56.34 and 57.69, SPXS 40.73 and 48.17, SPXL 38.74 and 48.77, QQQ 23.6 and 28.93, SPY 12.58 and 16.98.
Every bear fund sits directly above its bull twin, while orHv20d shows the pair realizing within about 3 vol points of each other. This shot and the two chains below are Thursday's live session, a few points under the settled Wednesday figures the statistics use. Source: ORATS Stock Scanner (live, July 9).
The bear fund's calls are index puts in disguise
Every SQQQ call is a bet that the Nasdaq-100 falls, whatever its strike. So the index's crash premium, the thing that makes QQQ puts cost more than its calls, lands on the call side of the bear fund's surface. SQQQ's 25-delta call printed 90.37% implied vol on Wednesday against TQQQ's 25-delta put at 82.91%, and the surface flips sign: slope runs +5.52 on QQQ and +4.91 on TQQQ, then goes to -3.42 on SQQQ. That flip held on 99.6% of sessions.
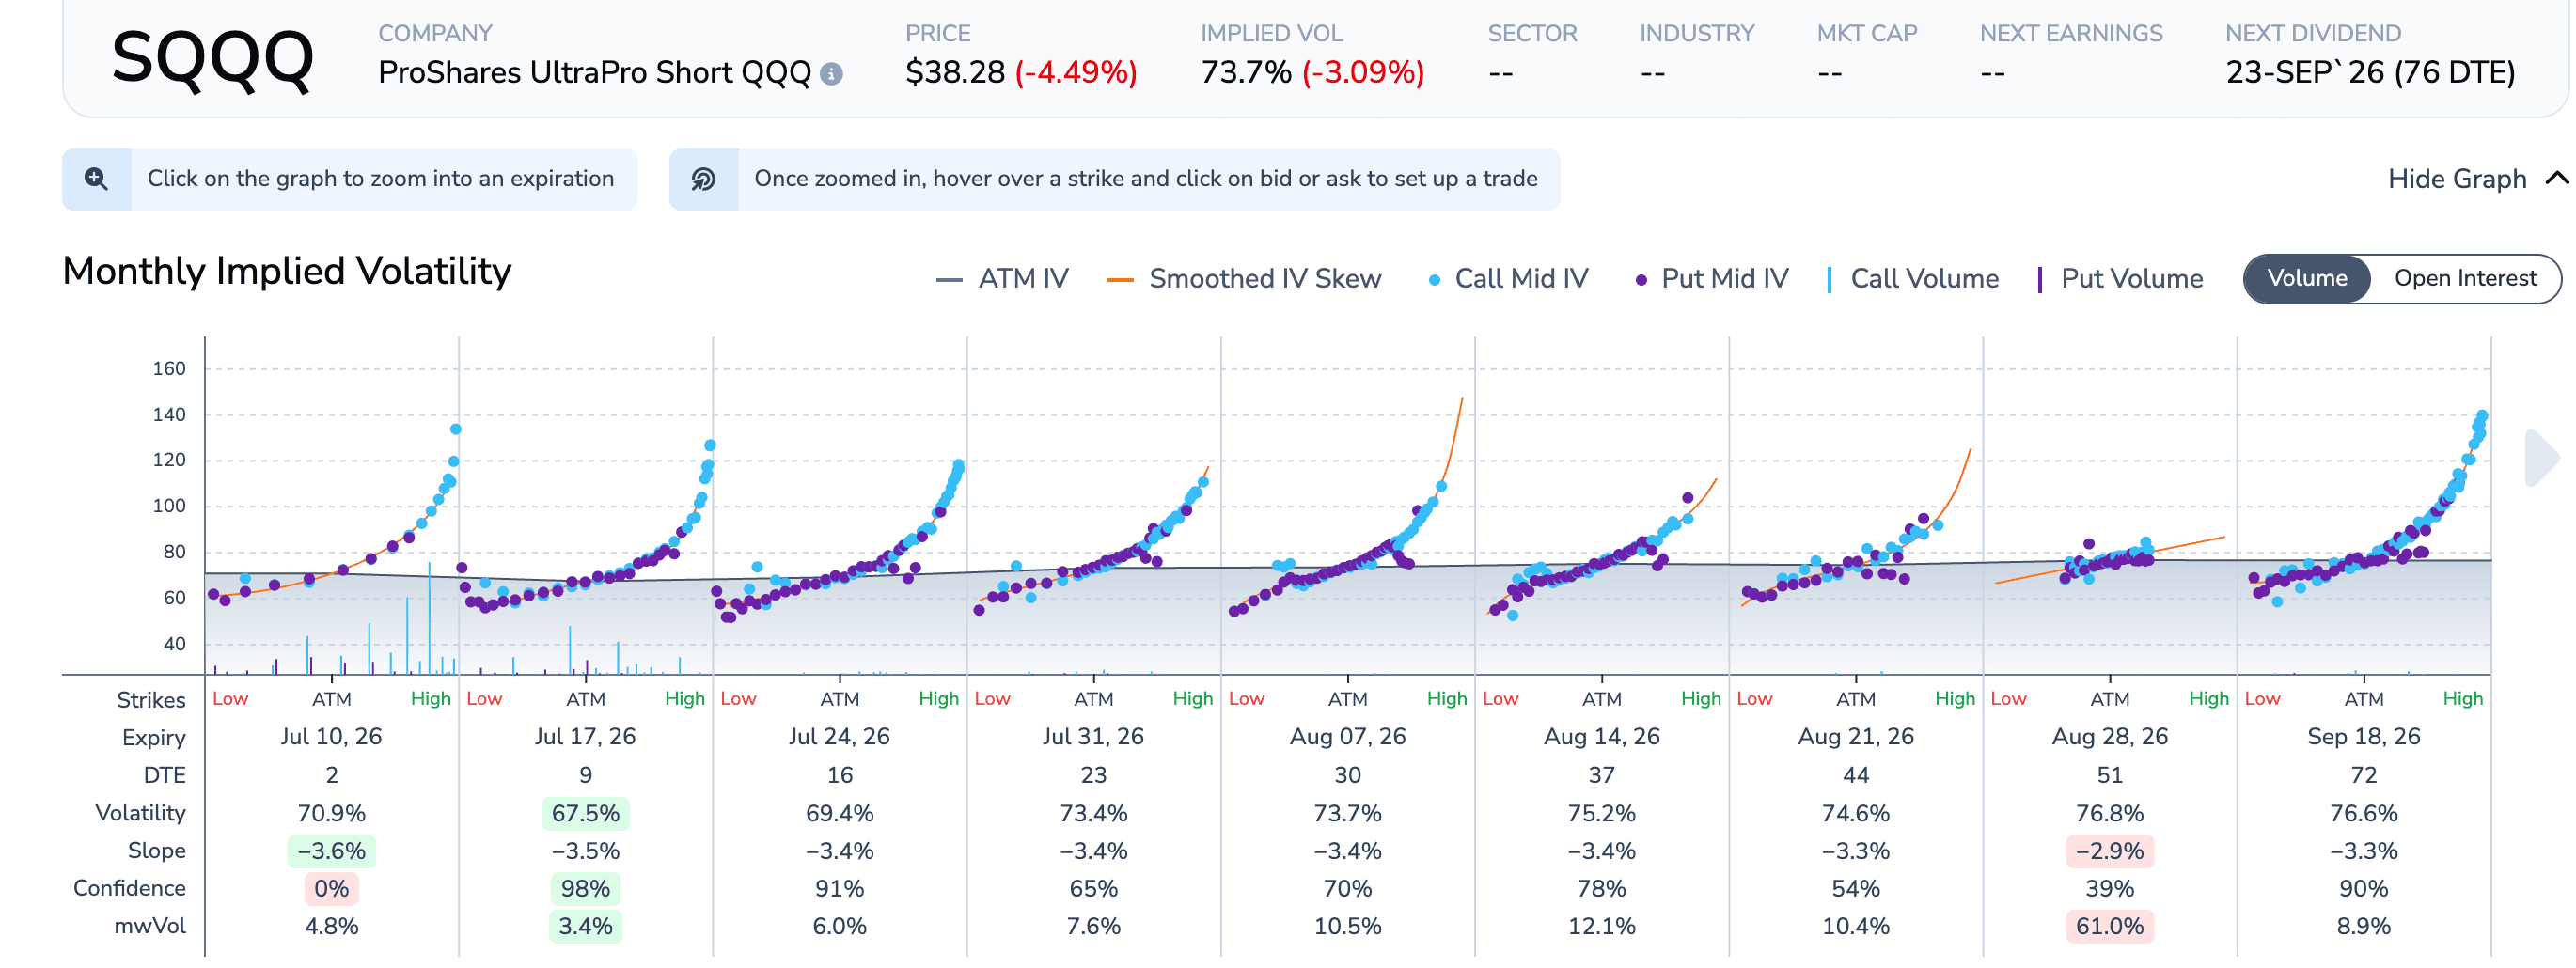
The ORATS Options Chain Monthly Implied Volatility panel for SQQQ, showing nine expiry smiles in which the cyan call mid-IV dots rise steeply above 120 on the high-strike side while put mid-IV dots stay near 60 to 80, with the table below listing slope as negative on every expiry.
SQQQ's smile climbs into the call wing, and slope prints negative on all nine listed expiries. Source: ORATS Options Chain (live, July 9).
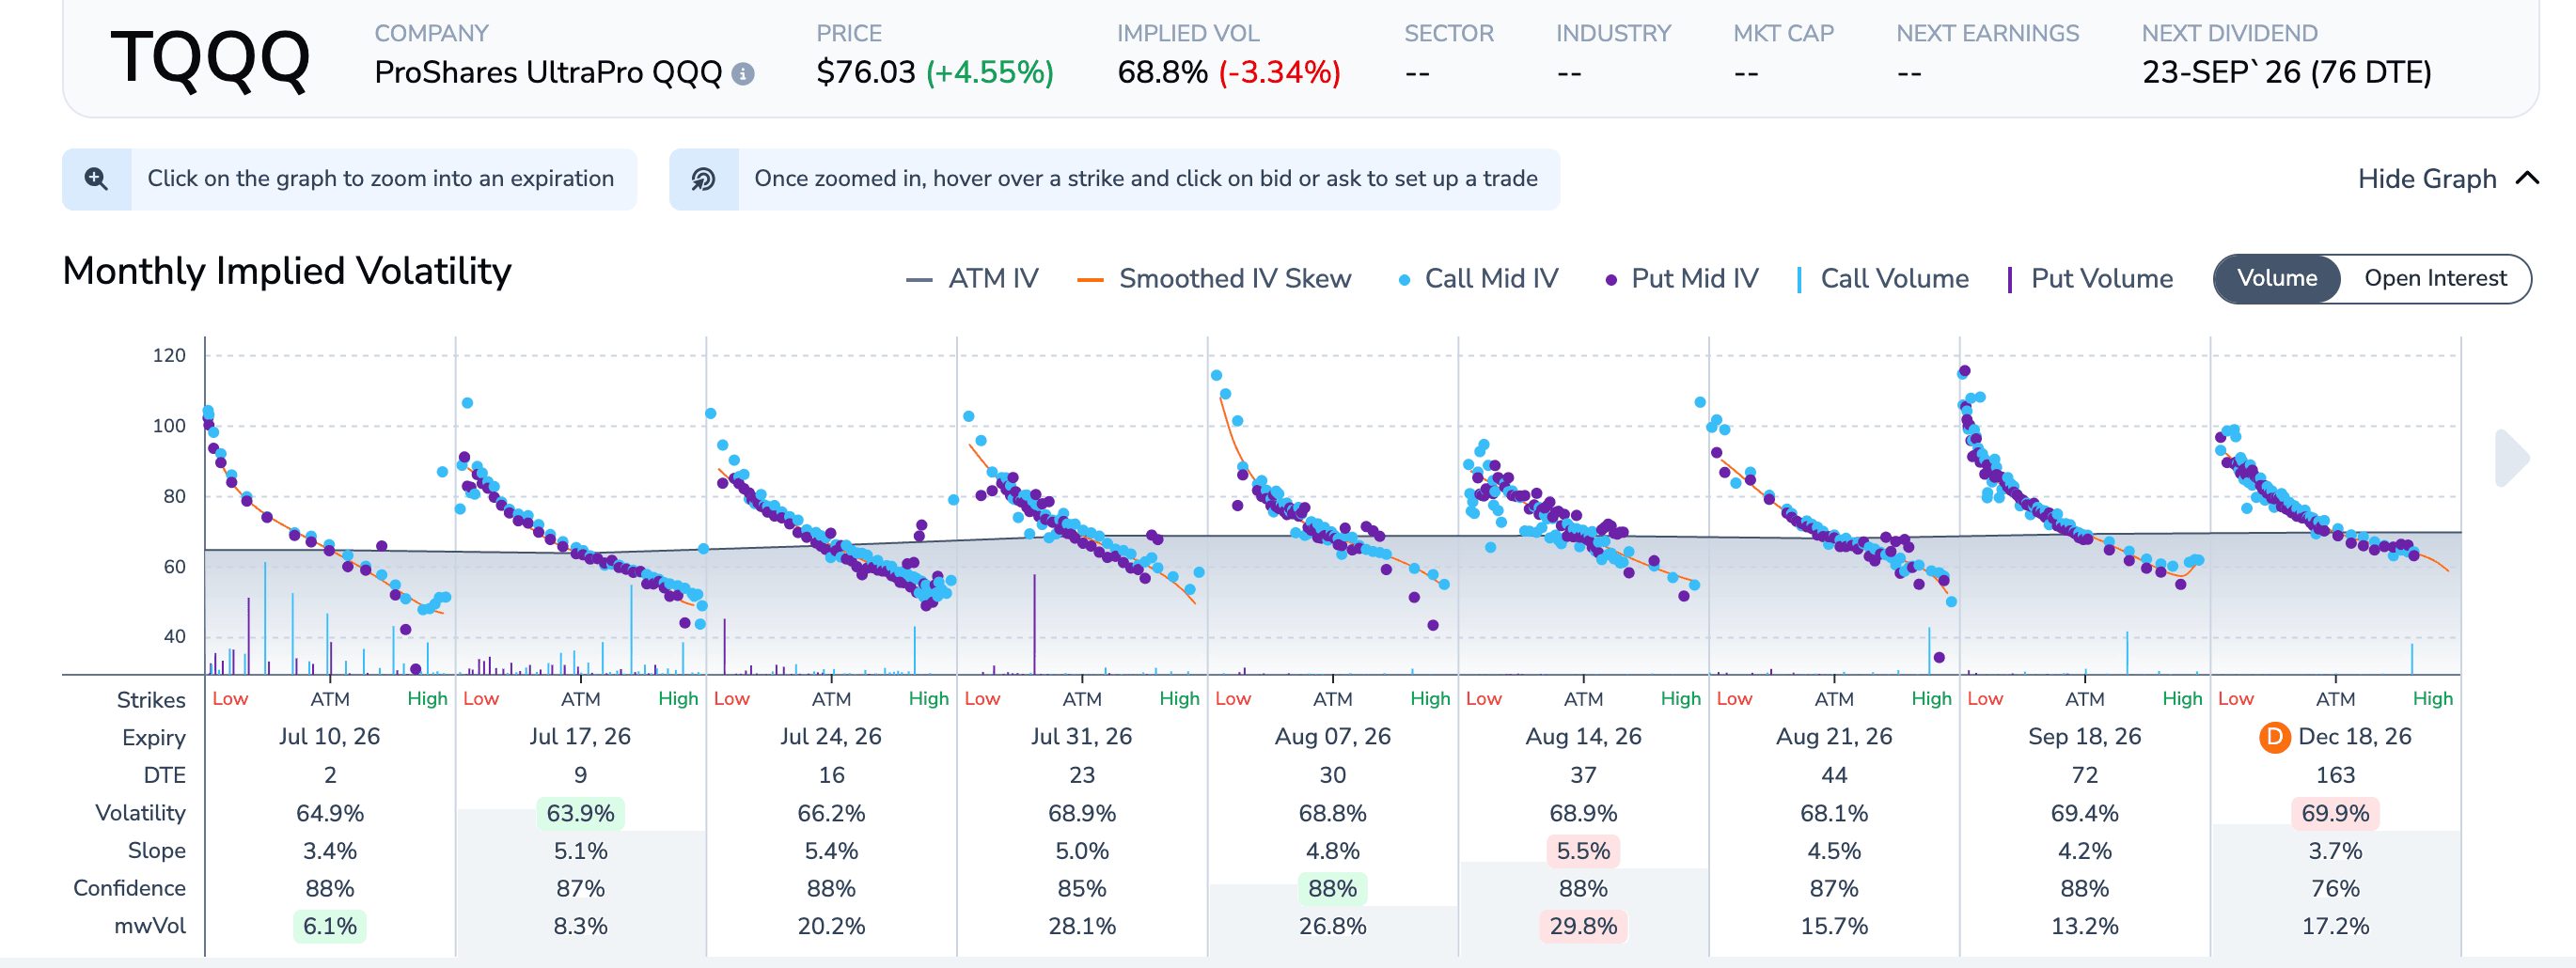
The ORATS Options Chain Monthly Implied Volatility panel for TQQQ, showing nine expiry smiles that fall from left to right, from near 100 on the low-strike side down to about 50 on the high-strike side, with the table below listing slope as positive on every expiry.
TQQQ, same index, same minute: the ordinary equity put skew, positive slope on every expiry, and 68.8% implied vol against the bear fund's 73.7%. Source: ORATS Options Chain (live, July 9).
Isn't the bear fund simply riskier when the market breaks?
Realized volatility says no. Bucket every session by QQQ's own trailing 20-day return and the bear premium peaks at 11.33 vol points in the worst decile, where the bear fund realized 1.54 points less volatility than the bull fund. In windows where QQQ fell more than 10%, the options charged 16.60 points while realized ran 4.32 the other way.
Daily compounding is convex against whichever fund is losing, so when the index drops it is TQQQ's log returns that go extreme, not SQQQ's.
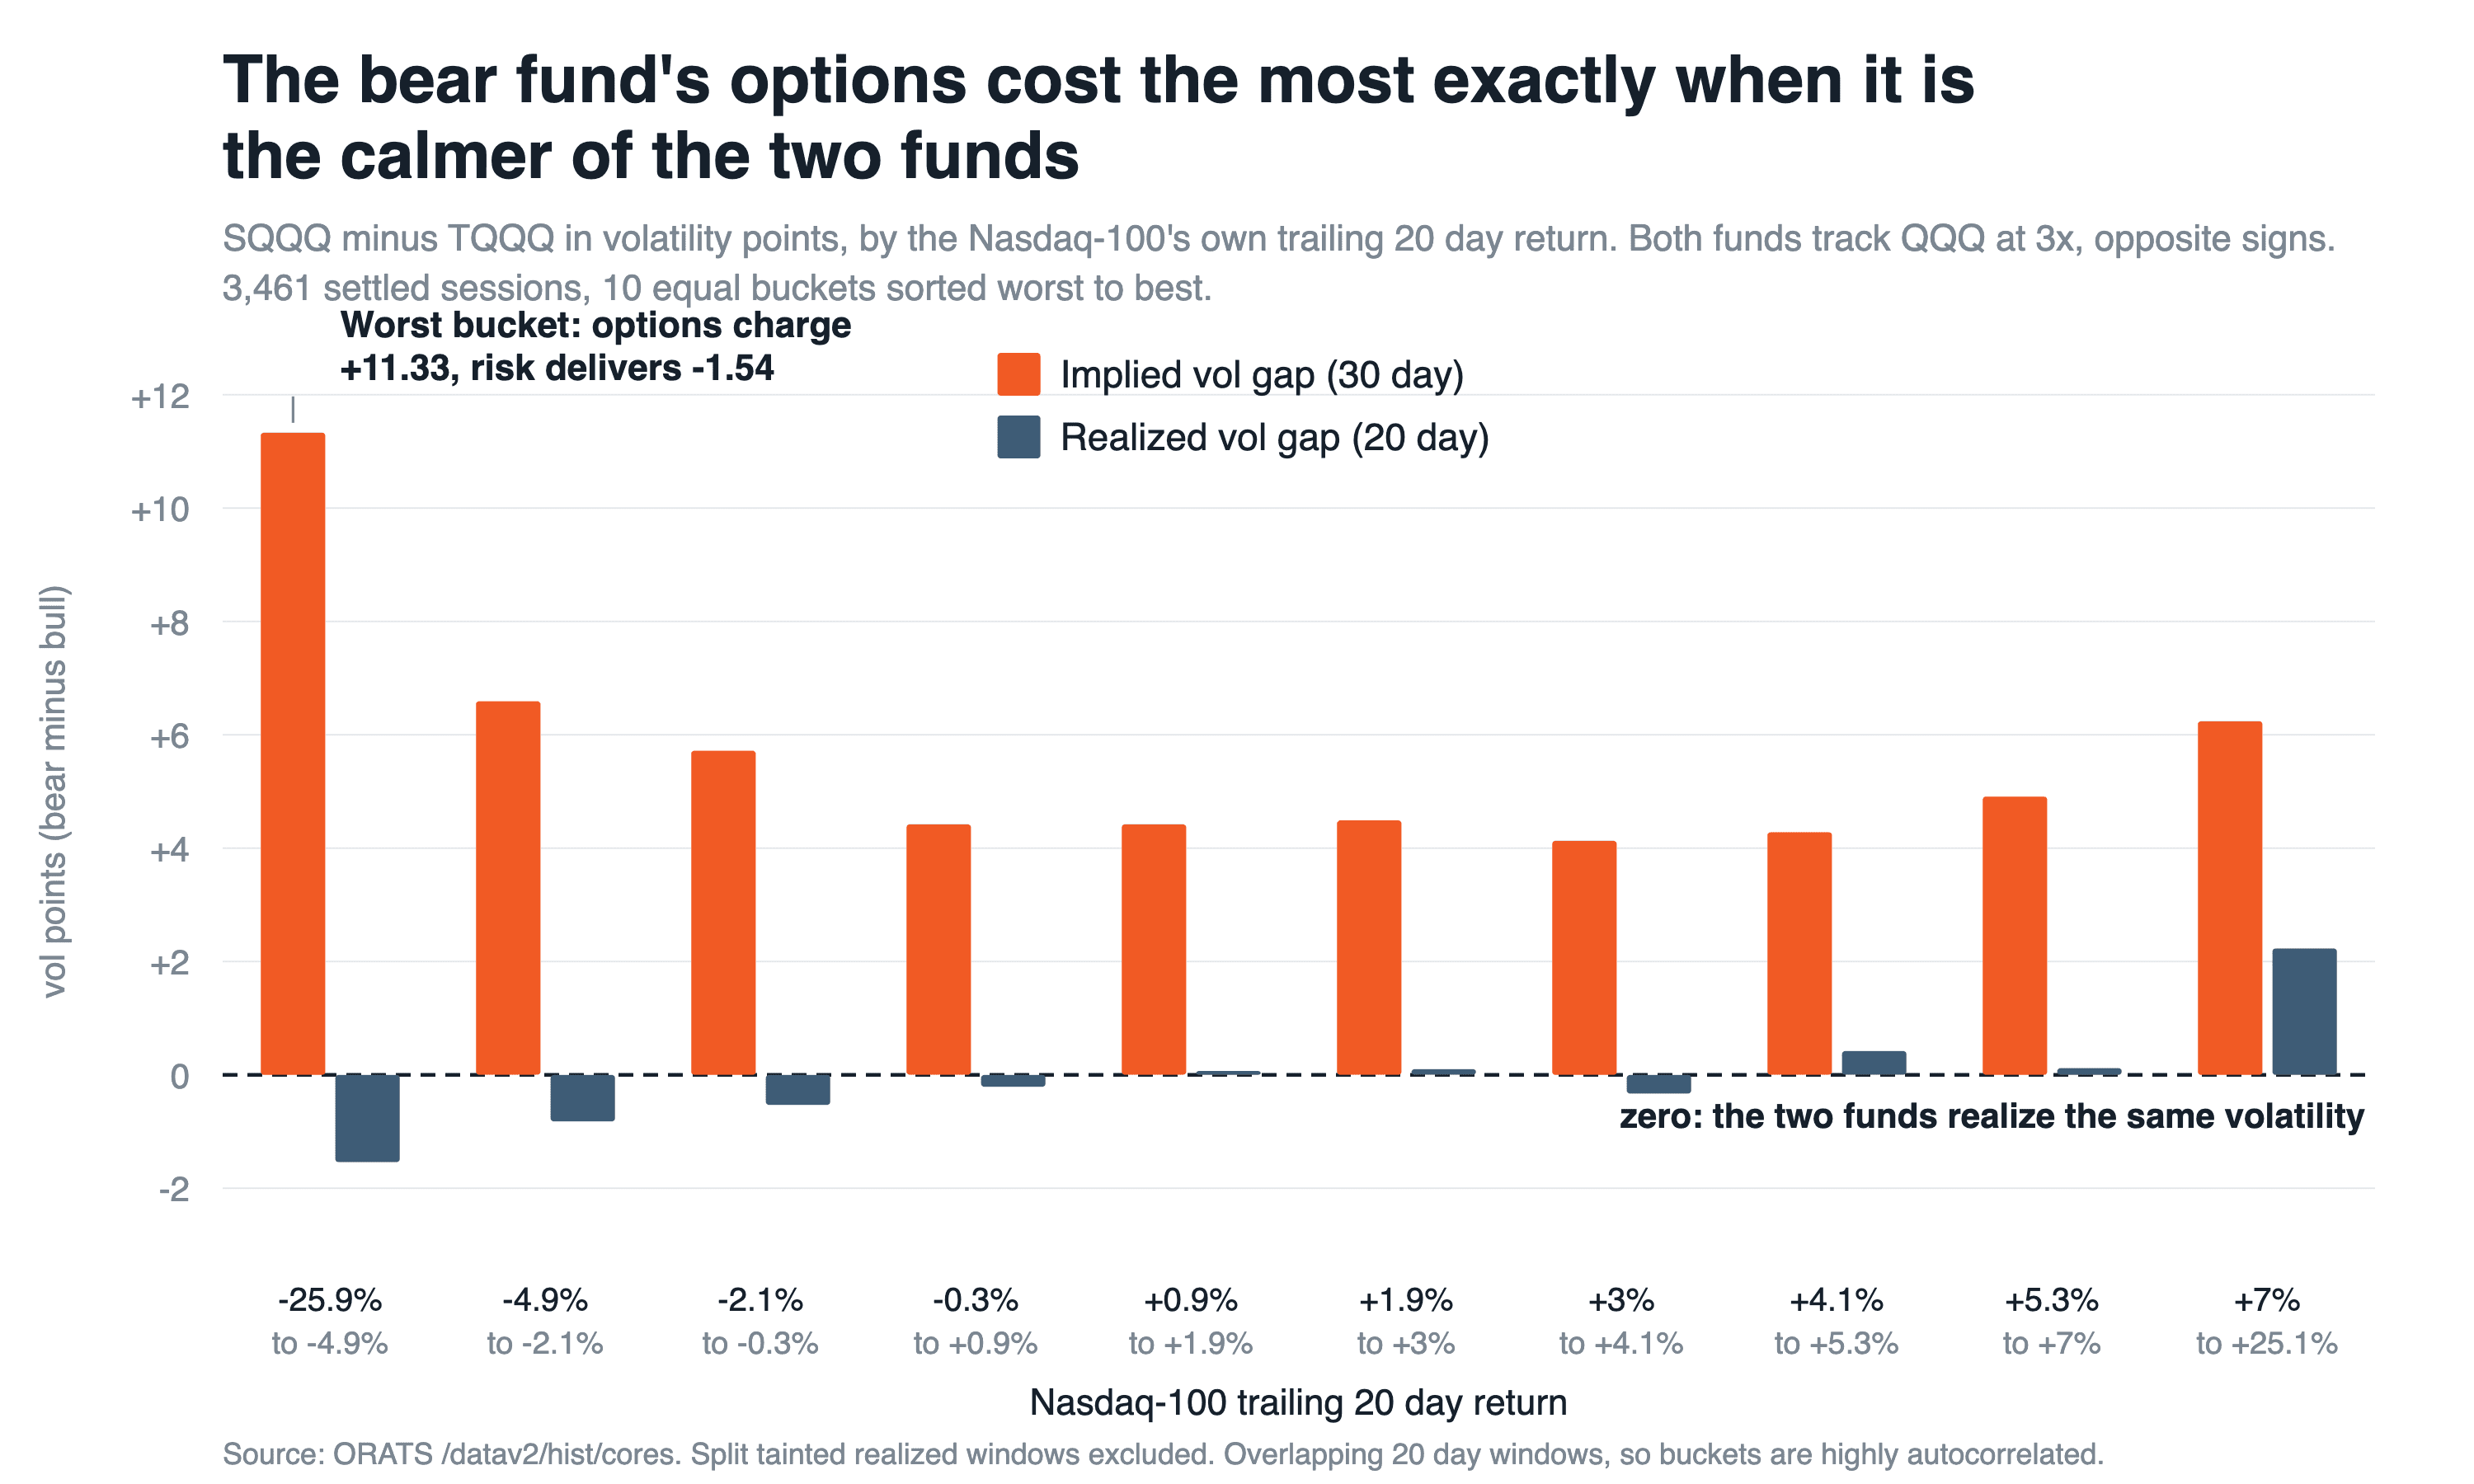
A grouped bar chart of SQQQ minus TQQQ in volatility points across ten buckets of the Nasdaq-100's trailing 20-day return, worst to best. The orange implied vol gap bar is positive in all ten buckets, peaking at 11.33 in the worst bucket, while the slate realized vol gap bar hugs zero and dips to minus 1.54 there.
The implied premium is widest exactly where the realized gap runs negative. Source: ORATS /datav2/hist/cores.
All seven leveraged pairs charge the same premium
All seven pairs carried the same sign Wednesday: SOXS 209.27% against SOXL 187.37%, TZA 74.35% against TNA 61.21%. The QQQ, semiconductor and small-cap pairs are the liquid ones; the S&P, financials, gold-miner and biotech pairs each carry a leg under 4,000 contracts a day, so read those as directionally consistent, not precise.
Before filing this as free money, look at what you would be selling: a crash premium that belongs to the index. Short it in the bear fund and you hold the same tail you would carry short QQQ puts, at three times the index's volatility. Buying an inverse ETF's calls because index puts feel expensive just buys that skew through a different ticker. TQQQ's 72.49% sits below 3x QQQ's implied 74.28%; SQQQ's 77.03% sits above it.
The buckets use overlapping 20-day windows, so they are heavily autocorrelated; base rates matter more than any point estimate. I dropped every realized window spanning one of the pair's sixteen splits; an unadjusted close poisons ORATS's own trailing vol.
Load the pair into the ORATS Stock Scanner with iv30d and orHv20d as display columns, then open each Options Chain and watch the slope flip.
$TQQQ $SQQQ $QQQ $SOXL $SOXS $TNA $TZA
#LeveragedETFs #Volatility #Skew #OptionsTrading #InverseETFs #RiskPremium
Disclaimer:
The opinions and ideas presented herein are for informational and educational purposes only and should not be construed to represent trading or investment advice tailored to your investment objectives. You should not rely solely on any content herein and we strongly encourage you to discuss any trades or investments with your broker or investment adviser, prior to execution. None of the information contained herein constitutes a recommendation that any particular security, portfolio, transaction, or investment strategy is suitable for any specific person. Option trading and investing involves risk and is not suitable for all investors.
All opinions are based upon information and systems considered reliable, but we do not warrant the completeness or accuracy, and such information should not be relied upon as such. We are under no obligation to update or correct any information herein. All statements and opinions are subject to change without notice.
Past performance is not indicative of future results. We do not, will not and cannot guarantee any specific outcome or profit. All traders and investors must be aware of the real risk of loss in following any strategy or investment discussed herein.
Owners, employees, directors, shareholders, officers, agents or representatives of ORATS may have interests or positions in securities of any company profiled herein. Specifically, such individuals or entities may buy or sell positions, and may or may not follow the information provided herein. Some or all of the positions may have been acquired prior to the publication of such information, and such positions may increase or decrease at any time. Any opinions expressed and/or information are statements of judgment as of the date of publication only.
Day trading, short term trading, options trading, and futures trading are extremely risky undertakings. They generally are not appropriate for someone with limited capital, little or no trading experience, and/ or a low tolerance for risk. Never execute a trade unless you can afford to and are prepared to lose your entire investment. In addition, certain trades may result in a loss greater than your entire investment. Always perform your own due diligence and, as appropriate, make informed decisions with the help of a licensed financial professional.
Commissions, fees and other costs associated with investing or trading may vary from broker to broker. All investors and traders are advised to speak with their stock broker or investment adviser about these costs. Be aware that certain trades that may be profitable for some may not be profitable for others, after taking into account these costs. In certain markets, investors and traders may not always be able to buy or sell a position at the price discussed, and consequently not be able to take advantage of certain trades discussed herein.
Be sure to read the OCCs Characteristics and Risks of Standardized Options to learn more about options trading.
Related Posts