Trading
Monday, June 15th 2026
Natural Gas: Don't Mistake the Summer Lull for Cheap Volatility
UNG vol is near the bottom of its one-year range, but the calendar and term structure tell a very different story.
Summary
Natural gas volatility is at a one‑year low, with 30‑day implied volatility around 43%—the second percentile of its range—making it appear cheap only when viewed against a twelve‑month window, not its seasonal context; June typically sees the lowest median realized volatility (~37.5%) while winter months spike near 64%, and forward vol for the October‑January period is about 70%, indicating that current implied levels are slightly rich relative to both realized and forecasted seasonality.
By Tyler Cheves
Natural gas options just hit a one-year low. UNG's 30-day implied volatility sits near 43%, the 2nd percentile of its range, and it isn't only the ETF: the leveraged funds BOIL and KOLD are at their own floors too, and the gas producer EQT trades a full two standard deviations below its one-year average. Sort an option screen by lowest IV rank and the gas complex floats to the top, flashing cheap. That reading is a seasonal artifact, and selling it as cheap vol is a trap.
Gas is a heating fuel, so its violent moves come out of winter cold, a polar vortex or a deep freeze, while summer is when it tends to sit still. Over the last decade June and the late-summer months have typically been the calmest, a 37.5% June median, with January and December the wildest, around 60 to 64%. The spread is wide, though: a hot June still realizes near 58%.
A trailing one-year percentile misleads here because the prior twelve months always contain a winter spike that lifts the top of the range, so a June reading lands in the low single digits by construction.
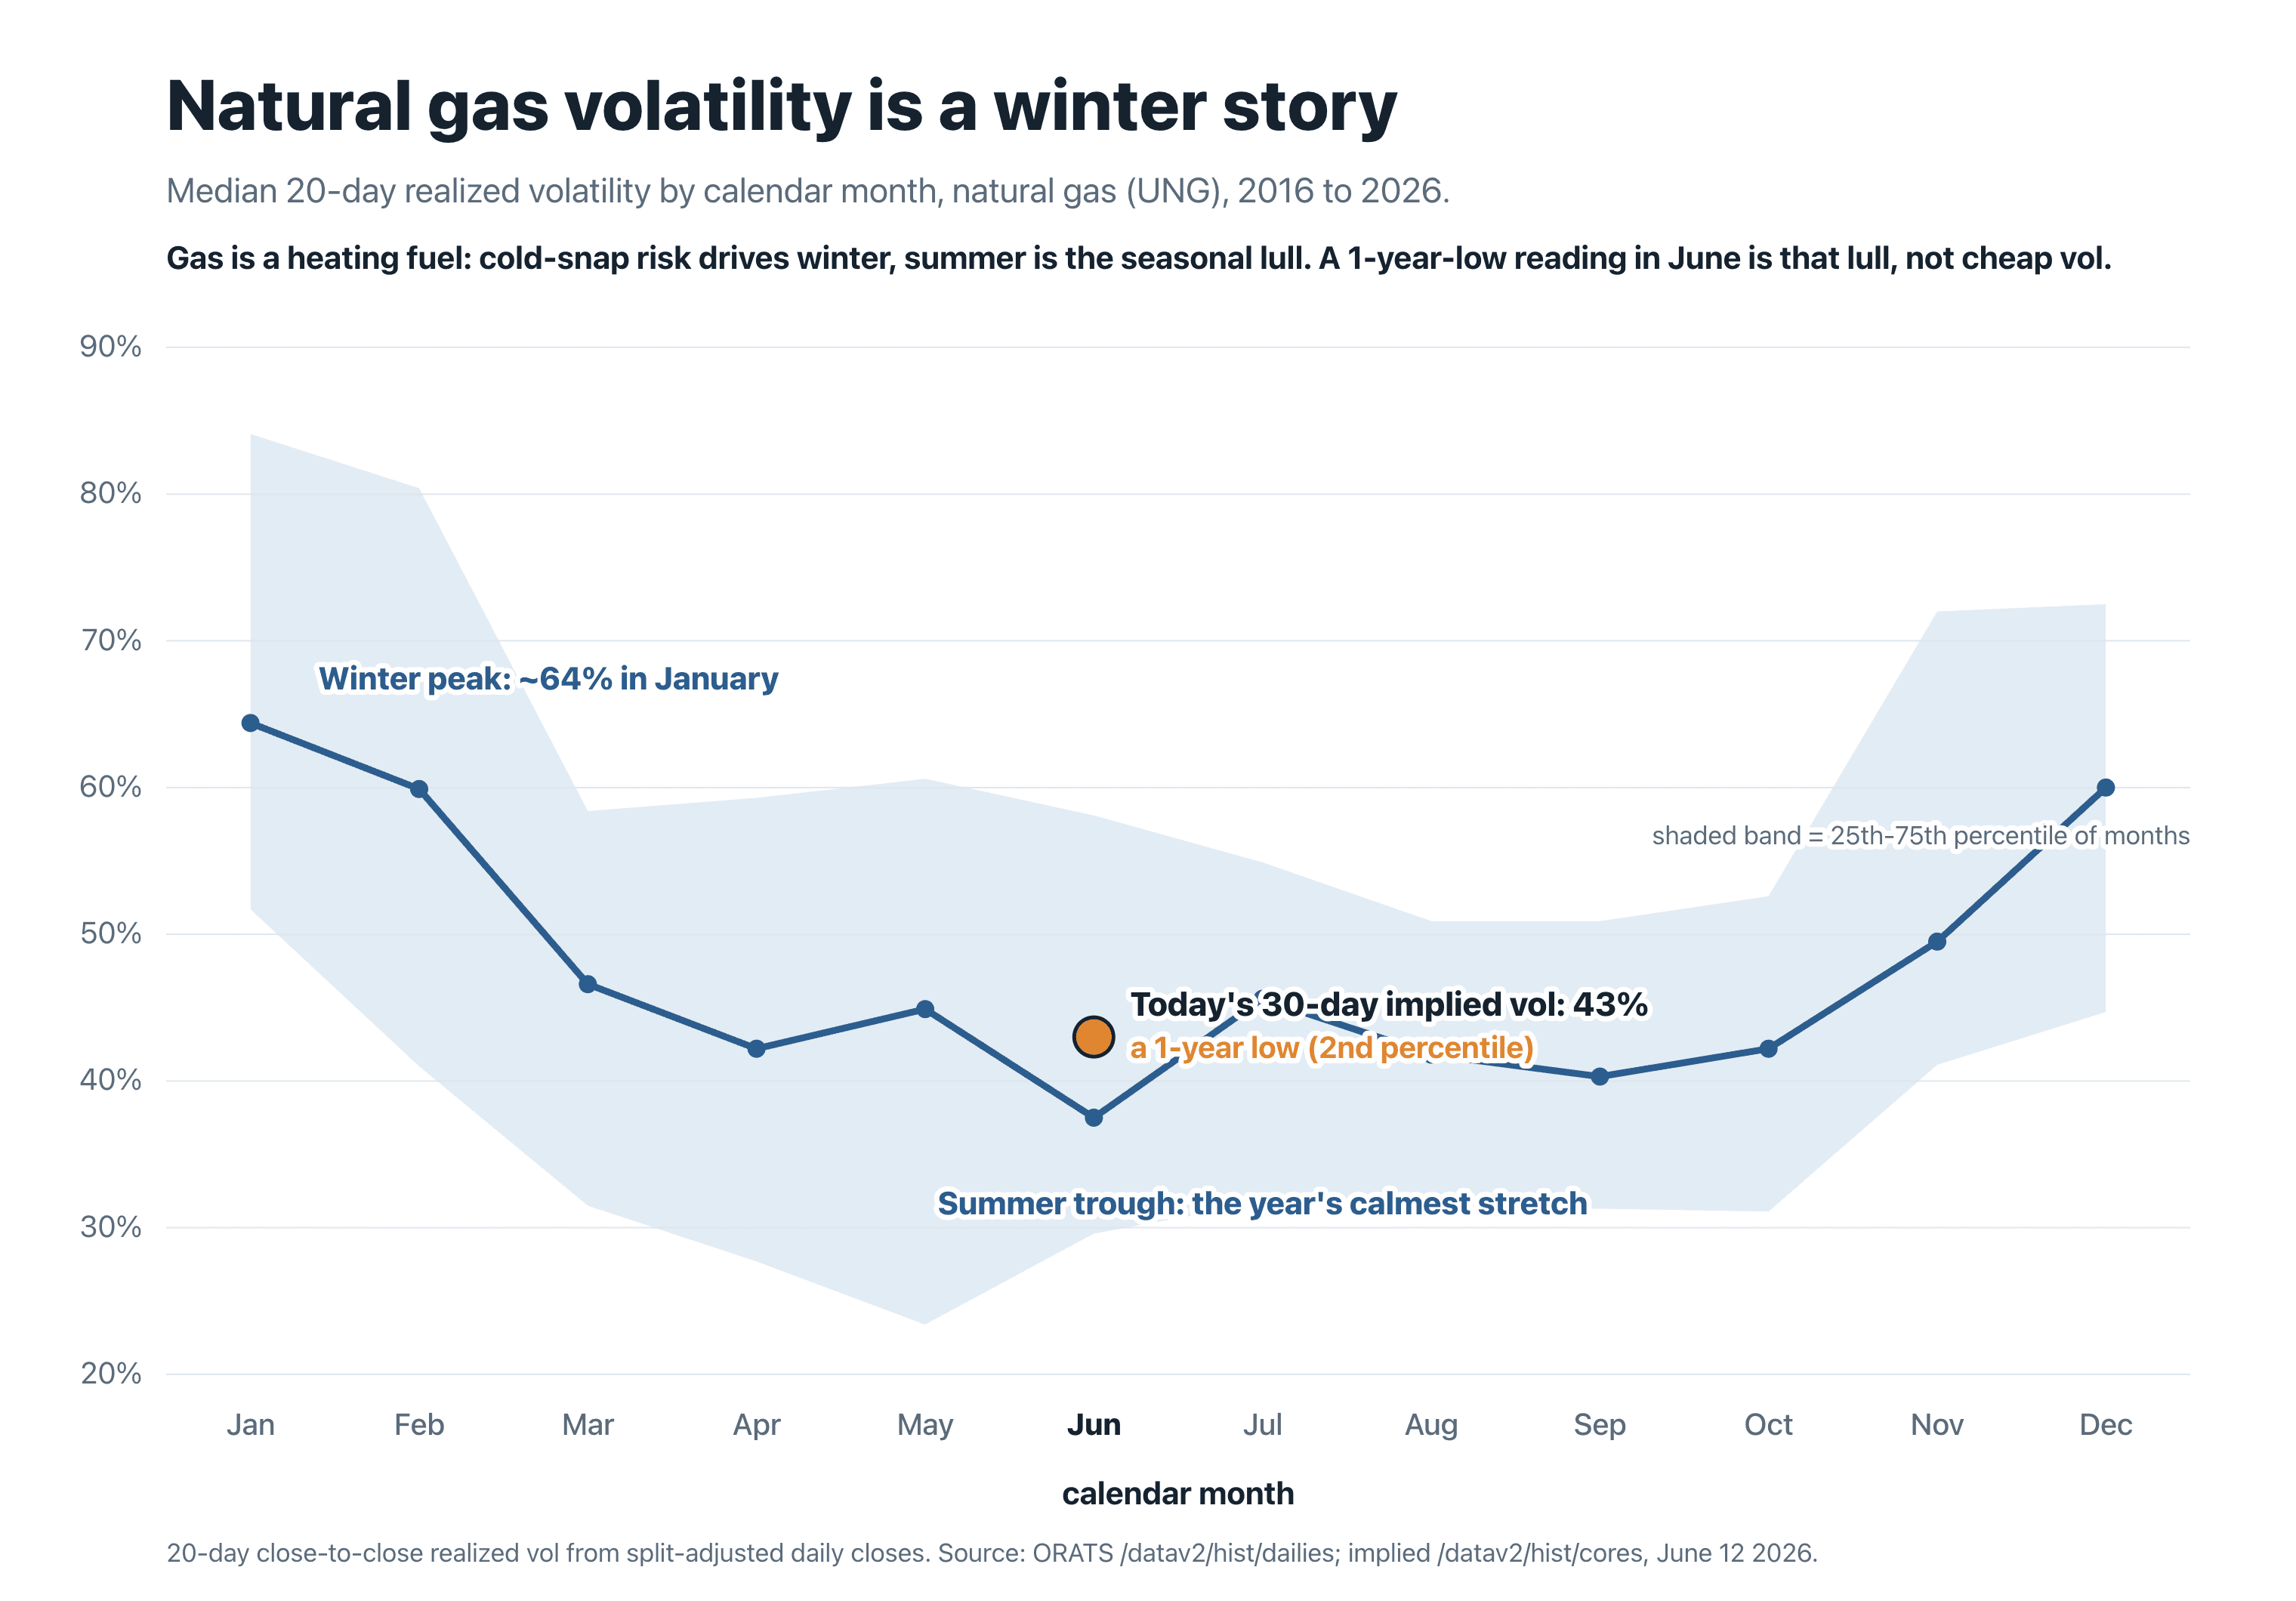
Median realized volatility by month for natural gas, 2016 to 2026: a winter peak near 64% in January and a summer trough, with June the calmest month at 37.5% and today's 43% implied sitting just above it.
Median 20-day realized volatility by month for natural gas (UNG), 2016 to 2026. June is the calmest month by median (37.5%); winter peaks near 64% in January. Today's 43% implied sits in the seasonal trough. Source: ORATS /datav2/hist/dailies.
The US-Iran framework deal that reopened the Strait of Hormuz sent crude to about $80 on Monday and pulled the geopolitical premium out of oil's volatility. Gas trades on domestic weather and storage, not Hormuz, so its low can read like the same risk-off crush. But gas was already at its one-year low into Friday's close, before the weekend deal, weeks into its own summer lull.
UNG's at-the-money implied vol climbs from about 41% at the nearest listed expiry to roughly 60% by the January 2027 expiry, and the forward vol priced for the October-to-January window is about 70%, well above the roughly 55% gas has realized across those same months. The market is pricing the winter recovery the front-month percentile can't see. It runs steeper than a calm year would, too, because last winter was violent: gas realized near 150% in February, so the trailing window that floors the percentile also lifts the forward.
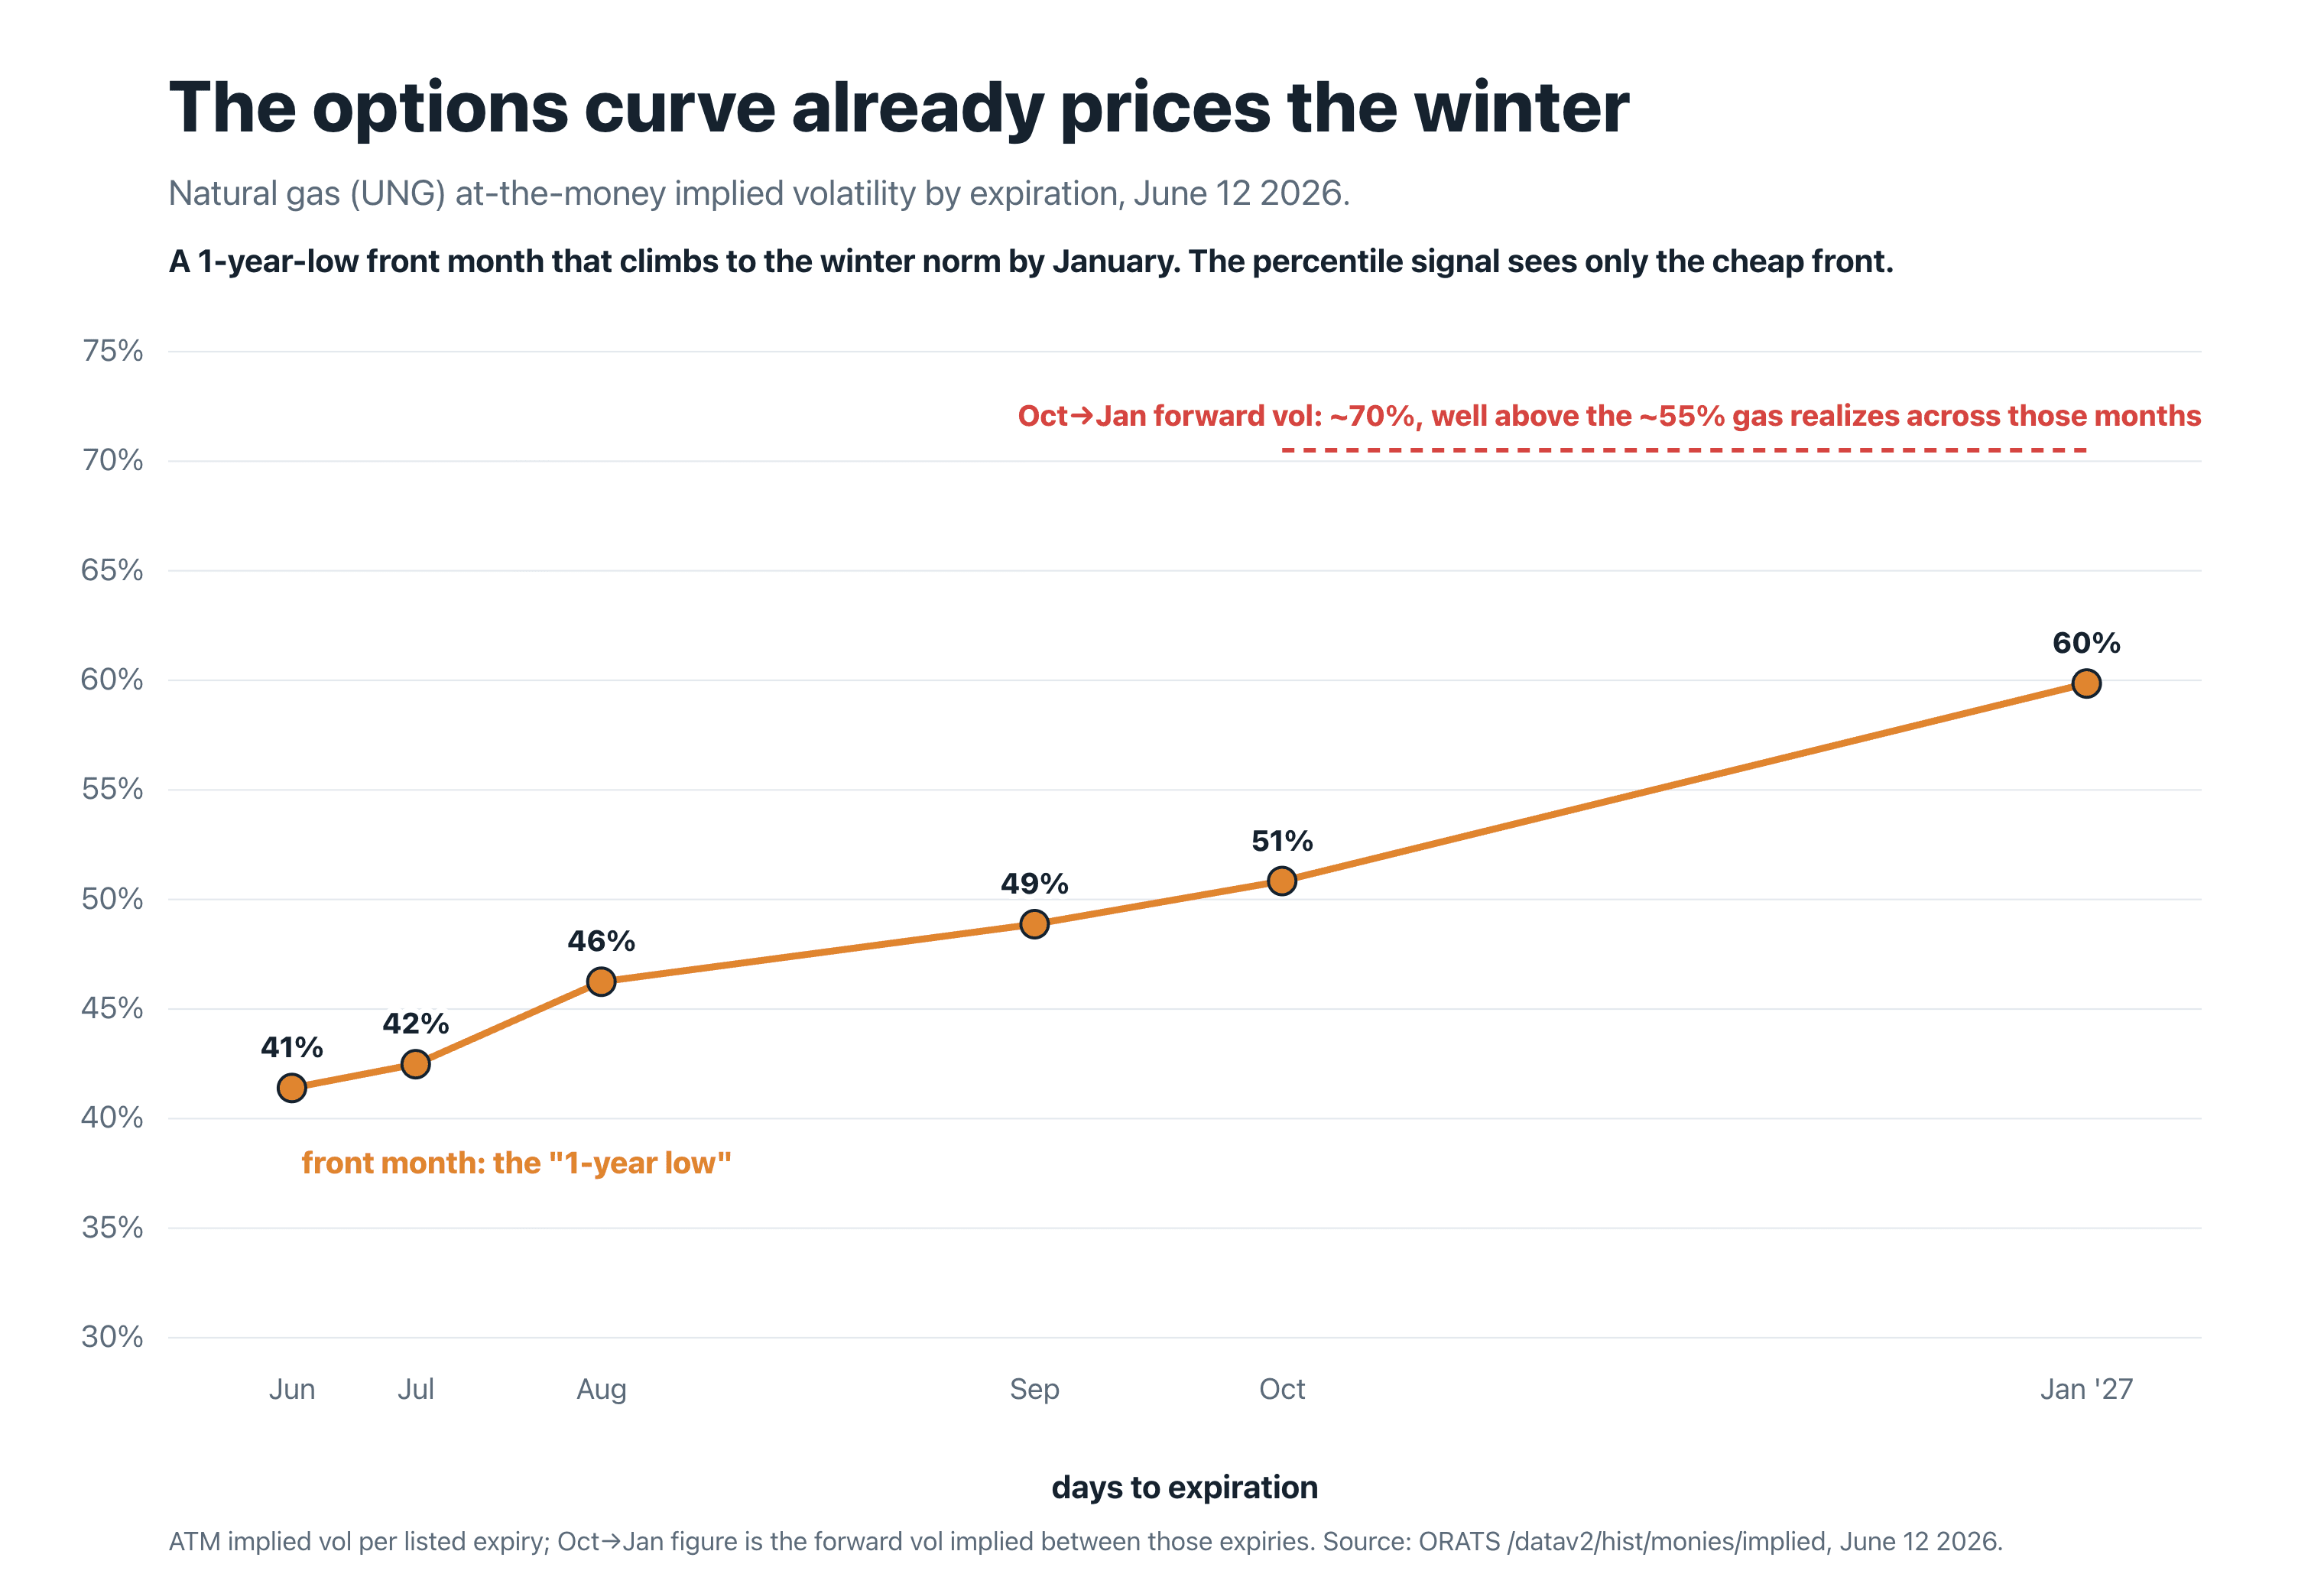
Natural gas implied volatility by expiration: a one-year-low front month near 41% rising to about 60% by January, with the October-to-January forward priced near 70%.
UNG at-the-money implied vol by expiration, June 12 2026. A one-year-low front month near 41% climbing to about 60% by January; the October-to-January forward is about 70%, well above the roughly 55% gas has realized across those months. Source: ORATS /datav2/hist/monies/implied.
Is 43% Implied Actually Cheap for June?
On the same close-to-close basis the seasonality uses, gas is realizing about 44% now, near the June mean and above its 37.5% median, with the ORATS one-month forward forecast around 41%. Implied at 43% sits on top of realized and slightly rich to the forecast. It is not cheap.
Read Implied Against Its Season, Not a One-Year Range
Any IV-rank or percentile screen sorts seasonal troughs to the top and calls them cheap: natural gas in summer, grains after harvest, anything with a calendar. The fix is to read implied against its own season and its term structure, not a twelve-month range that blends summer and winter into one number. None of this makes summer risk-free, a Gulf hurricane near an LNG terminal or a heat dome can still light gas up, but the base rate is calm.
Pull UNG into the Trade Builder, stretch the IV history to a year, and watch the front month sit at its floor while the ATM curve ramps into winter. Read the term structure and the seasonal median, and a 2nd-percentile reading stops looking like a sale.
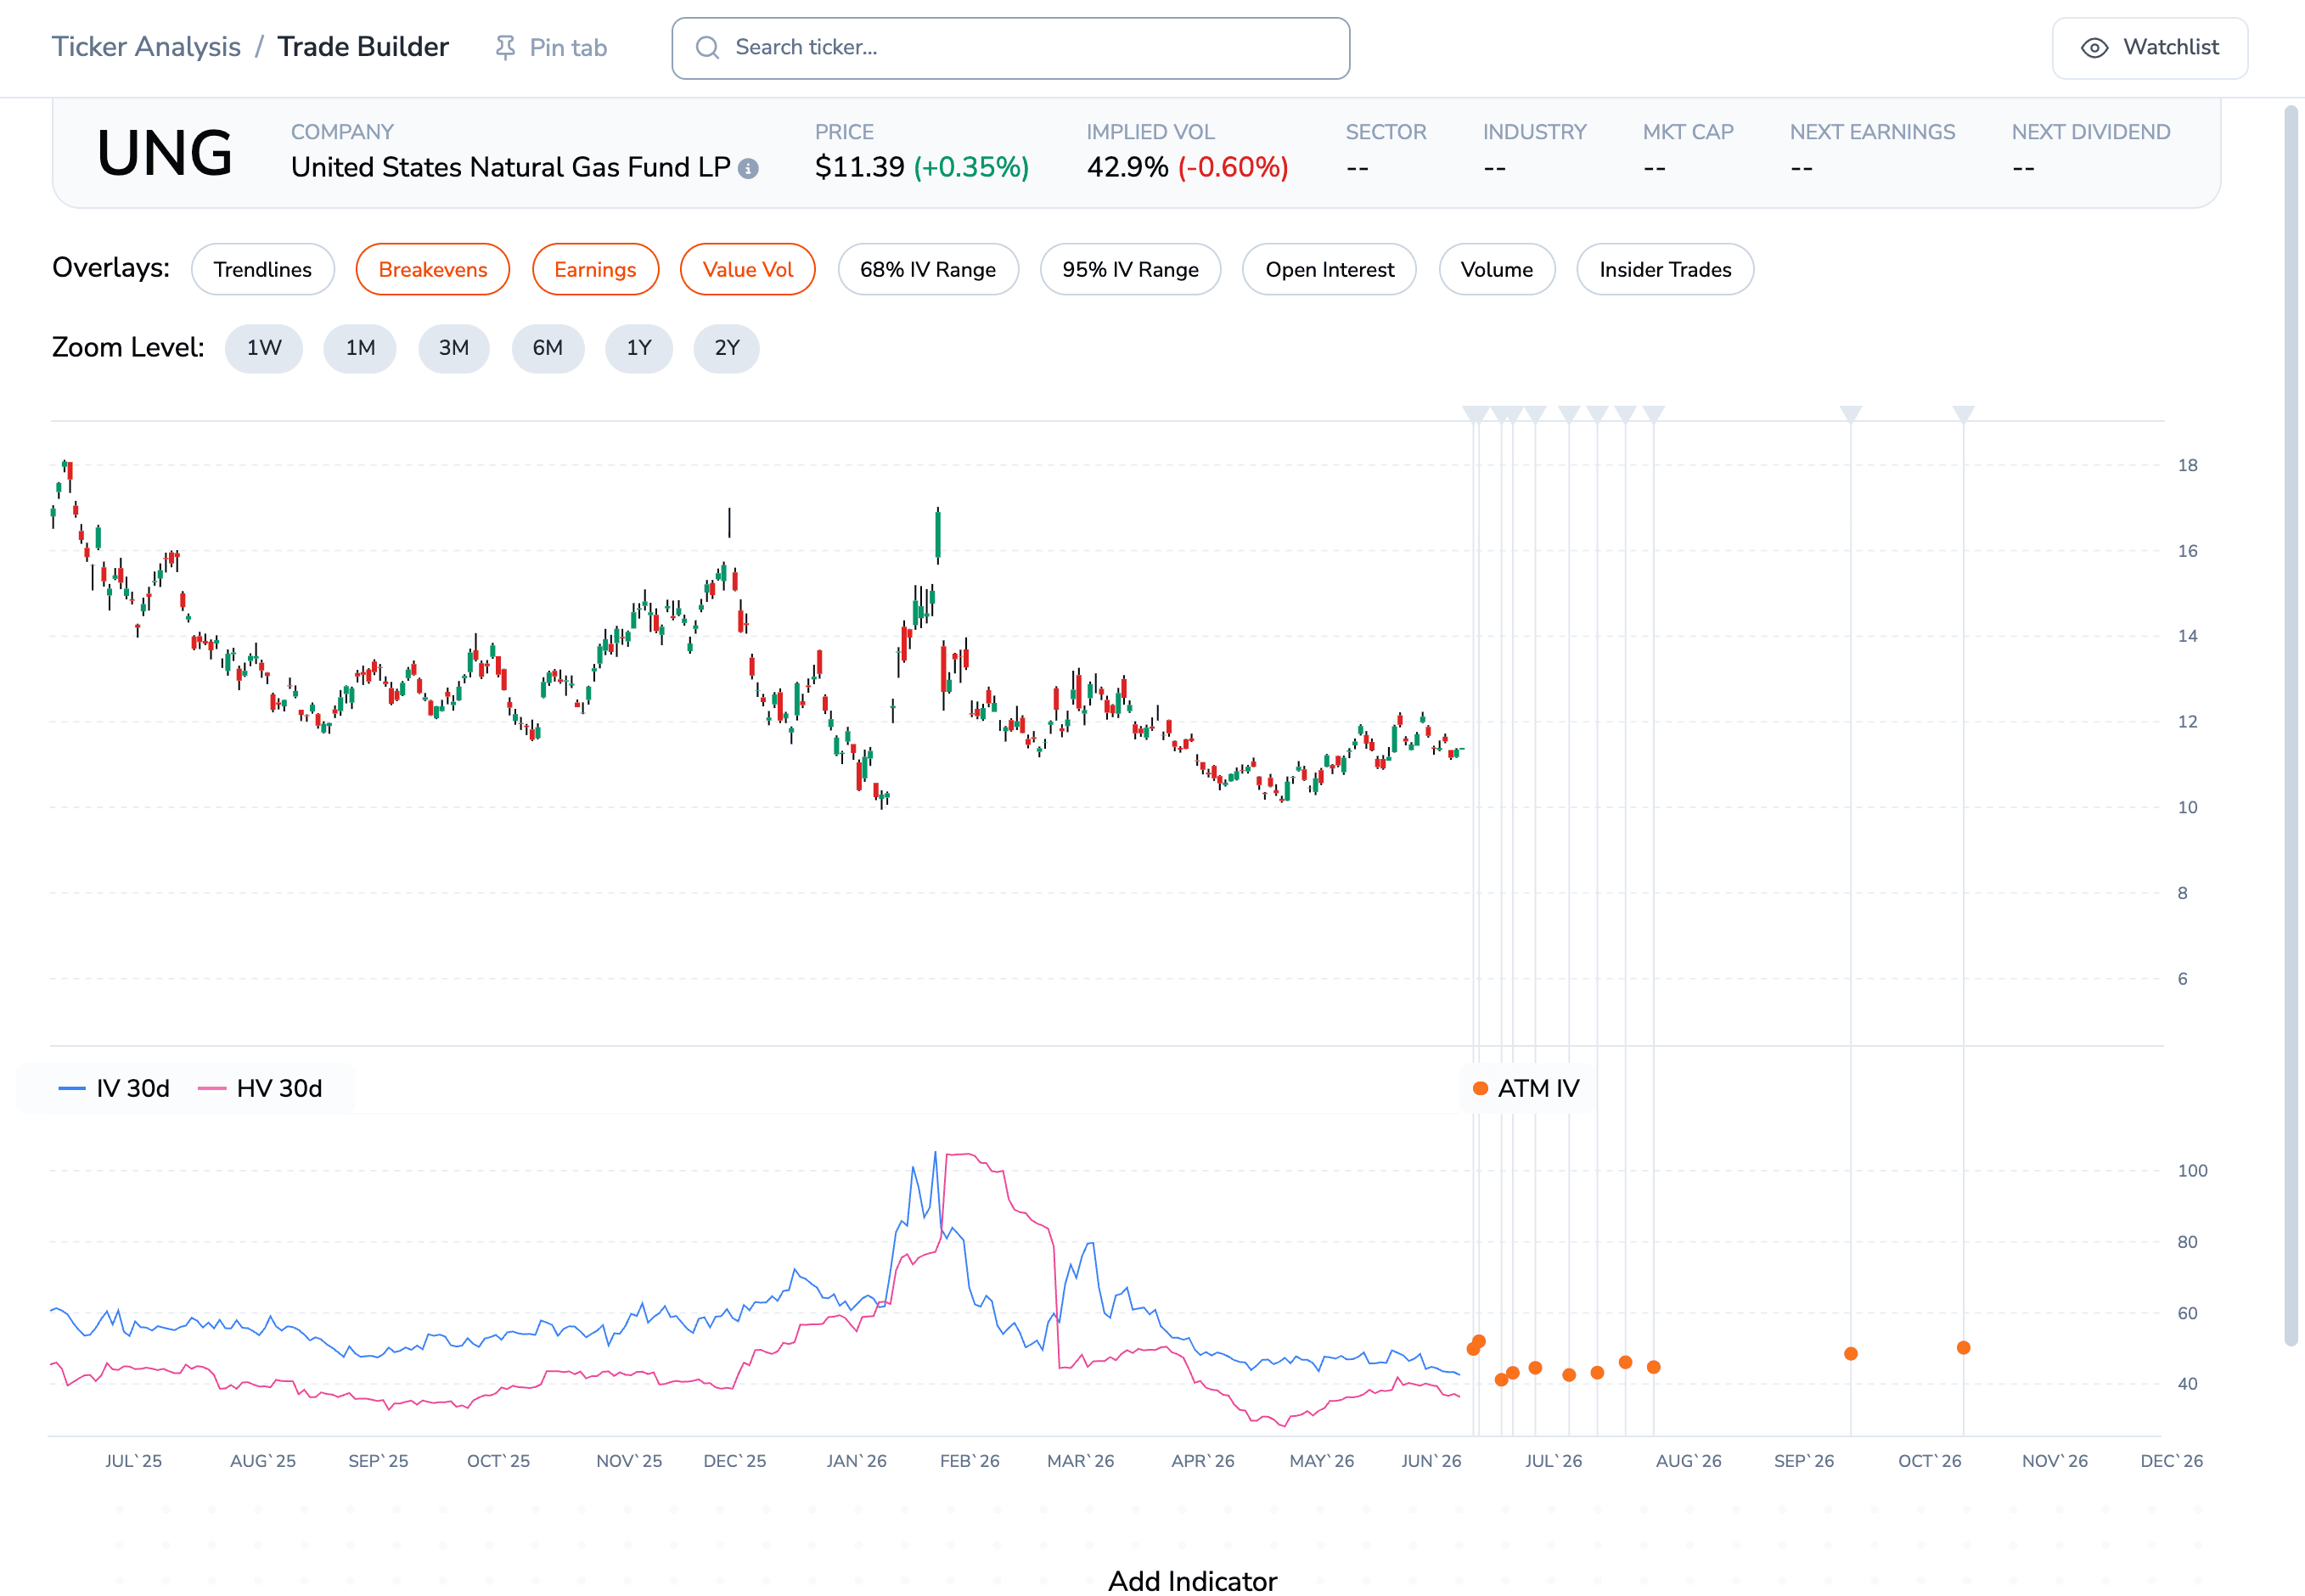
UNG in the ORATS Trade Builder, one-year view: 30-day implied vol spiked near 100% in the winter cold snap and has drained to the bottom of its range, with the ATM curve rising into next winter.
UNG in the ORATS Trade Builder, one-year view. IV 30d spiked near 100% in the winter cold snap and has drained to the bottom of its range; the ATM IV scatter rises into next winter.
Disclaimer:
The opinions and ideas presented herein are for informational and educational purposes only and should not be construed to represent trading or investment advice tailored to your investment objectives. You should not rely solely on any content herein and we strongly encourage you to discuss any trades or investments with your broker or investment adviser, prior to execution. None of the information contained herein constitutes a recommendation that any particular security, portfolio, transaction, or investment strategy is suitable for any specific person. Option trading and investing involves risk and is not suitable for all investors.
All opinions are based upon information and systems considered reliable, but we do not warrant the completeness or accuracy, and such information should not be relied upon as such. We are under no obligation to update or correct any information herein. All statements and opinions are subject to change without notice.
Past performance is not indicative of future results. We do not, will not and cannot guarantee any specific outcome or profit. All traders and investors must be aware of the real risk of loss in following any strategy or investment discussed herein.
Owners, employees, directors, shareholders, officers, agents or representatives of ORATS may have interests or positions in securities of any company profiled herein. Specifically, such individuals or entities may buy or sell positions, and may or may not follow the information provided herein. Some or all of the positions may have been acquired prior to the publication of such information, and such positions may increase or decrease at any time. Any opinions expressed and/or information are statements of judgment as of the date of publication only.
Day trading, short term trading, options trading, and futures trading are extremely risky undertakings. They generally are not appropriate for someone with limited capital, little or no trading experience, and/ or a low tolerance for risk. Never execute a trade unless you can afford to and are prepared to lose your entire investment. In addition, certain trades may result in a loss greater than your entire investment. Always perform your own due diligence and, as appropriate, make informed decisions with the help of a licensed financial professional.
Commissions, fees and other costs associated with investing or trading may vary from broker to broker. All investors and traders are advised to speak with their stock broker or investment adviser about these costs. Be aware that certain trades that may be profitable for some may not be profitable for others, after taking into account these costs. In certain markets, investors and traders may not always be able to buy or sell a position at the price discussed, and consequently not be able to take advantage of certain trades discussed herein.
Be sure to read the OCCs Characteristics and Risks of Standardized Options to learn more about options trading.
Related Posts


