Earnings
Friday, August 6th 2021
How much will a stock move after earnings?
Learn how implied volatility can reveal the market's expected stock price move after earnings – using ORATS historical options data and proprietary indicators.
Summary
ORATS offers tools to analyze and trade implied volatility, which can reveal the market's expected stock price move after earnings. The Earn Move Report provides a forecast of stock price movement, while the Ex-Earnings Volatility metric calculates the portion of implied volatility attributable to earnings. ORATS also offers a Data API and Wheel web platform to further analyze this data and backtest options strategies.
Earnings season presents a challenging but lucrative opportunity for options traders. Stock investors are also keenly interested in earnings as this time provides a glimpse into the past and future performance of their asset. For any particular stock, the immediate post-earnings move can swing the price decidedly lower or higher, depending on the market’s reaction to the earnings report. Options prices hold a key to understanding the market's expectation of the magnitude of the move in stock price after the earnings announcement.
This uncertainty over direction and magnitude creates a gradual rise in implied volatility for several weeks prior to the earnings date, up until immediately after earnings when it sharply declines back to its normal levels. ORATS has built its data platform around analyzing this kind of implied volatility and how it affects options prices. With several products including the Earn Move Report, Data API, and Wheel web platform, ORATS offers many ways to analyze and trade implied volatility.
Earn Move Report
We provide a rigorous assessment of stock price moves before and after earnings. Our reports detailing these moves are emailed to subscribers on a daily basis. Let’s look at the Implied Earnings Moves report, where we apply a proprietary technique of isolating and normalizing straddle premiums to forecast stock price movement.
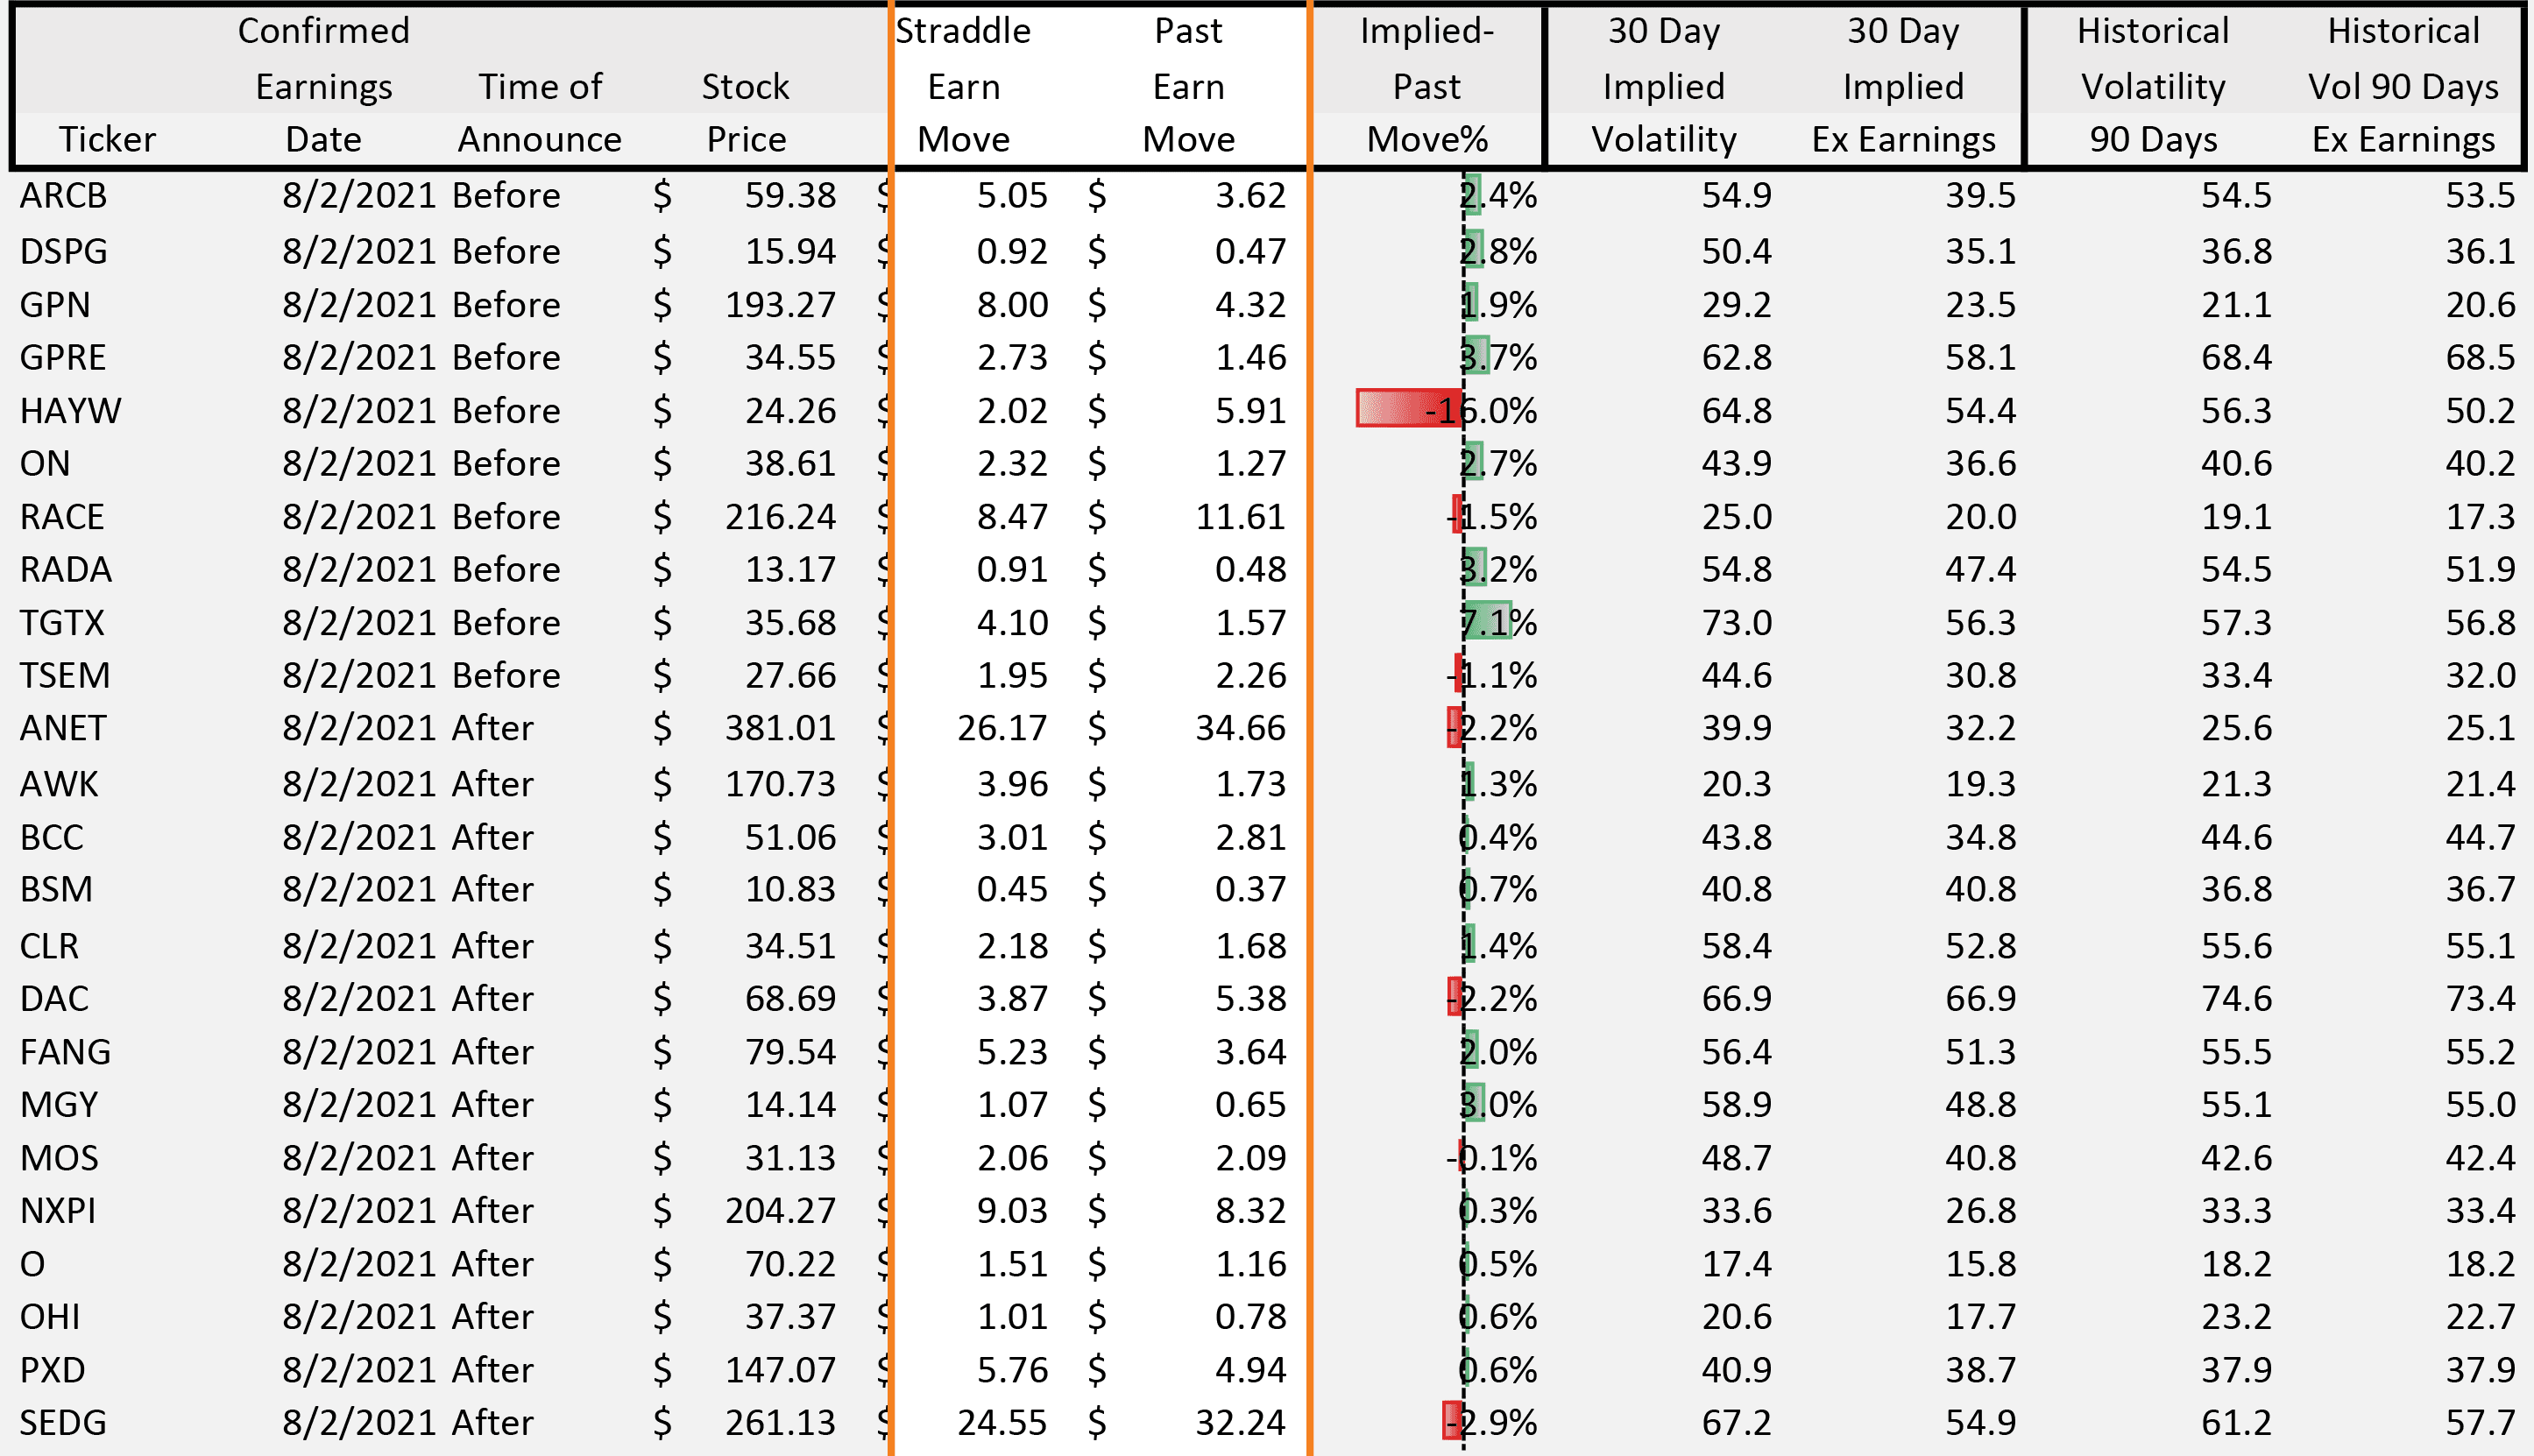
The Straddle Earn Move column is ORATS' extraction of how much the options market expects the stock price to move immediately following earnings. We derive this value using options straddle prices adjusted for the expected value of the straddle after earnings using a proprietary distribution of post-earnings expected values.
The Past Earn Move column is the average % move of the stock price over the last 12 quarters of earnings. This gives perspective to our forecast relative to the historical price movement.
Ex-Earnings Volatility
One of the most challenging aspects of analyzing volatility is determining what portion of it is coming from earnings. We know that implied volatility gradually increases in the weeks preceding earnings – but by exactly how much? ORATS has discovered a way to accurately calculate this metric, and we include it in the 30 Day Implied Ex Earnings and Historical Vol 90 Days Ex Earnings columns in the report.
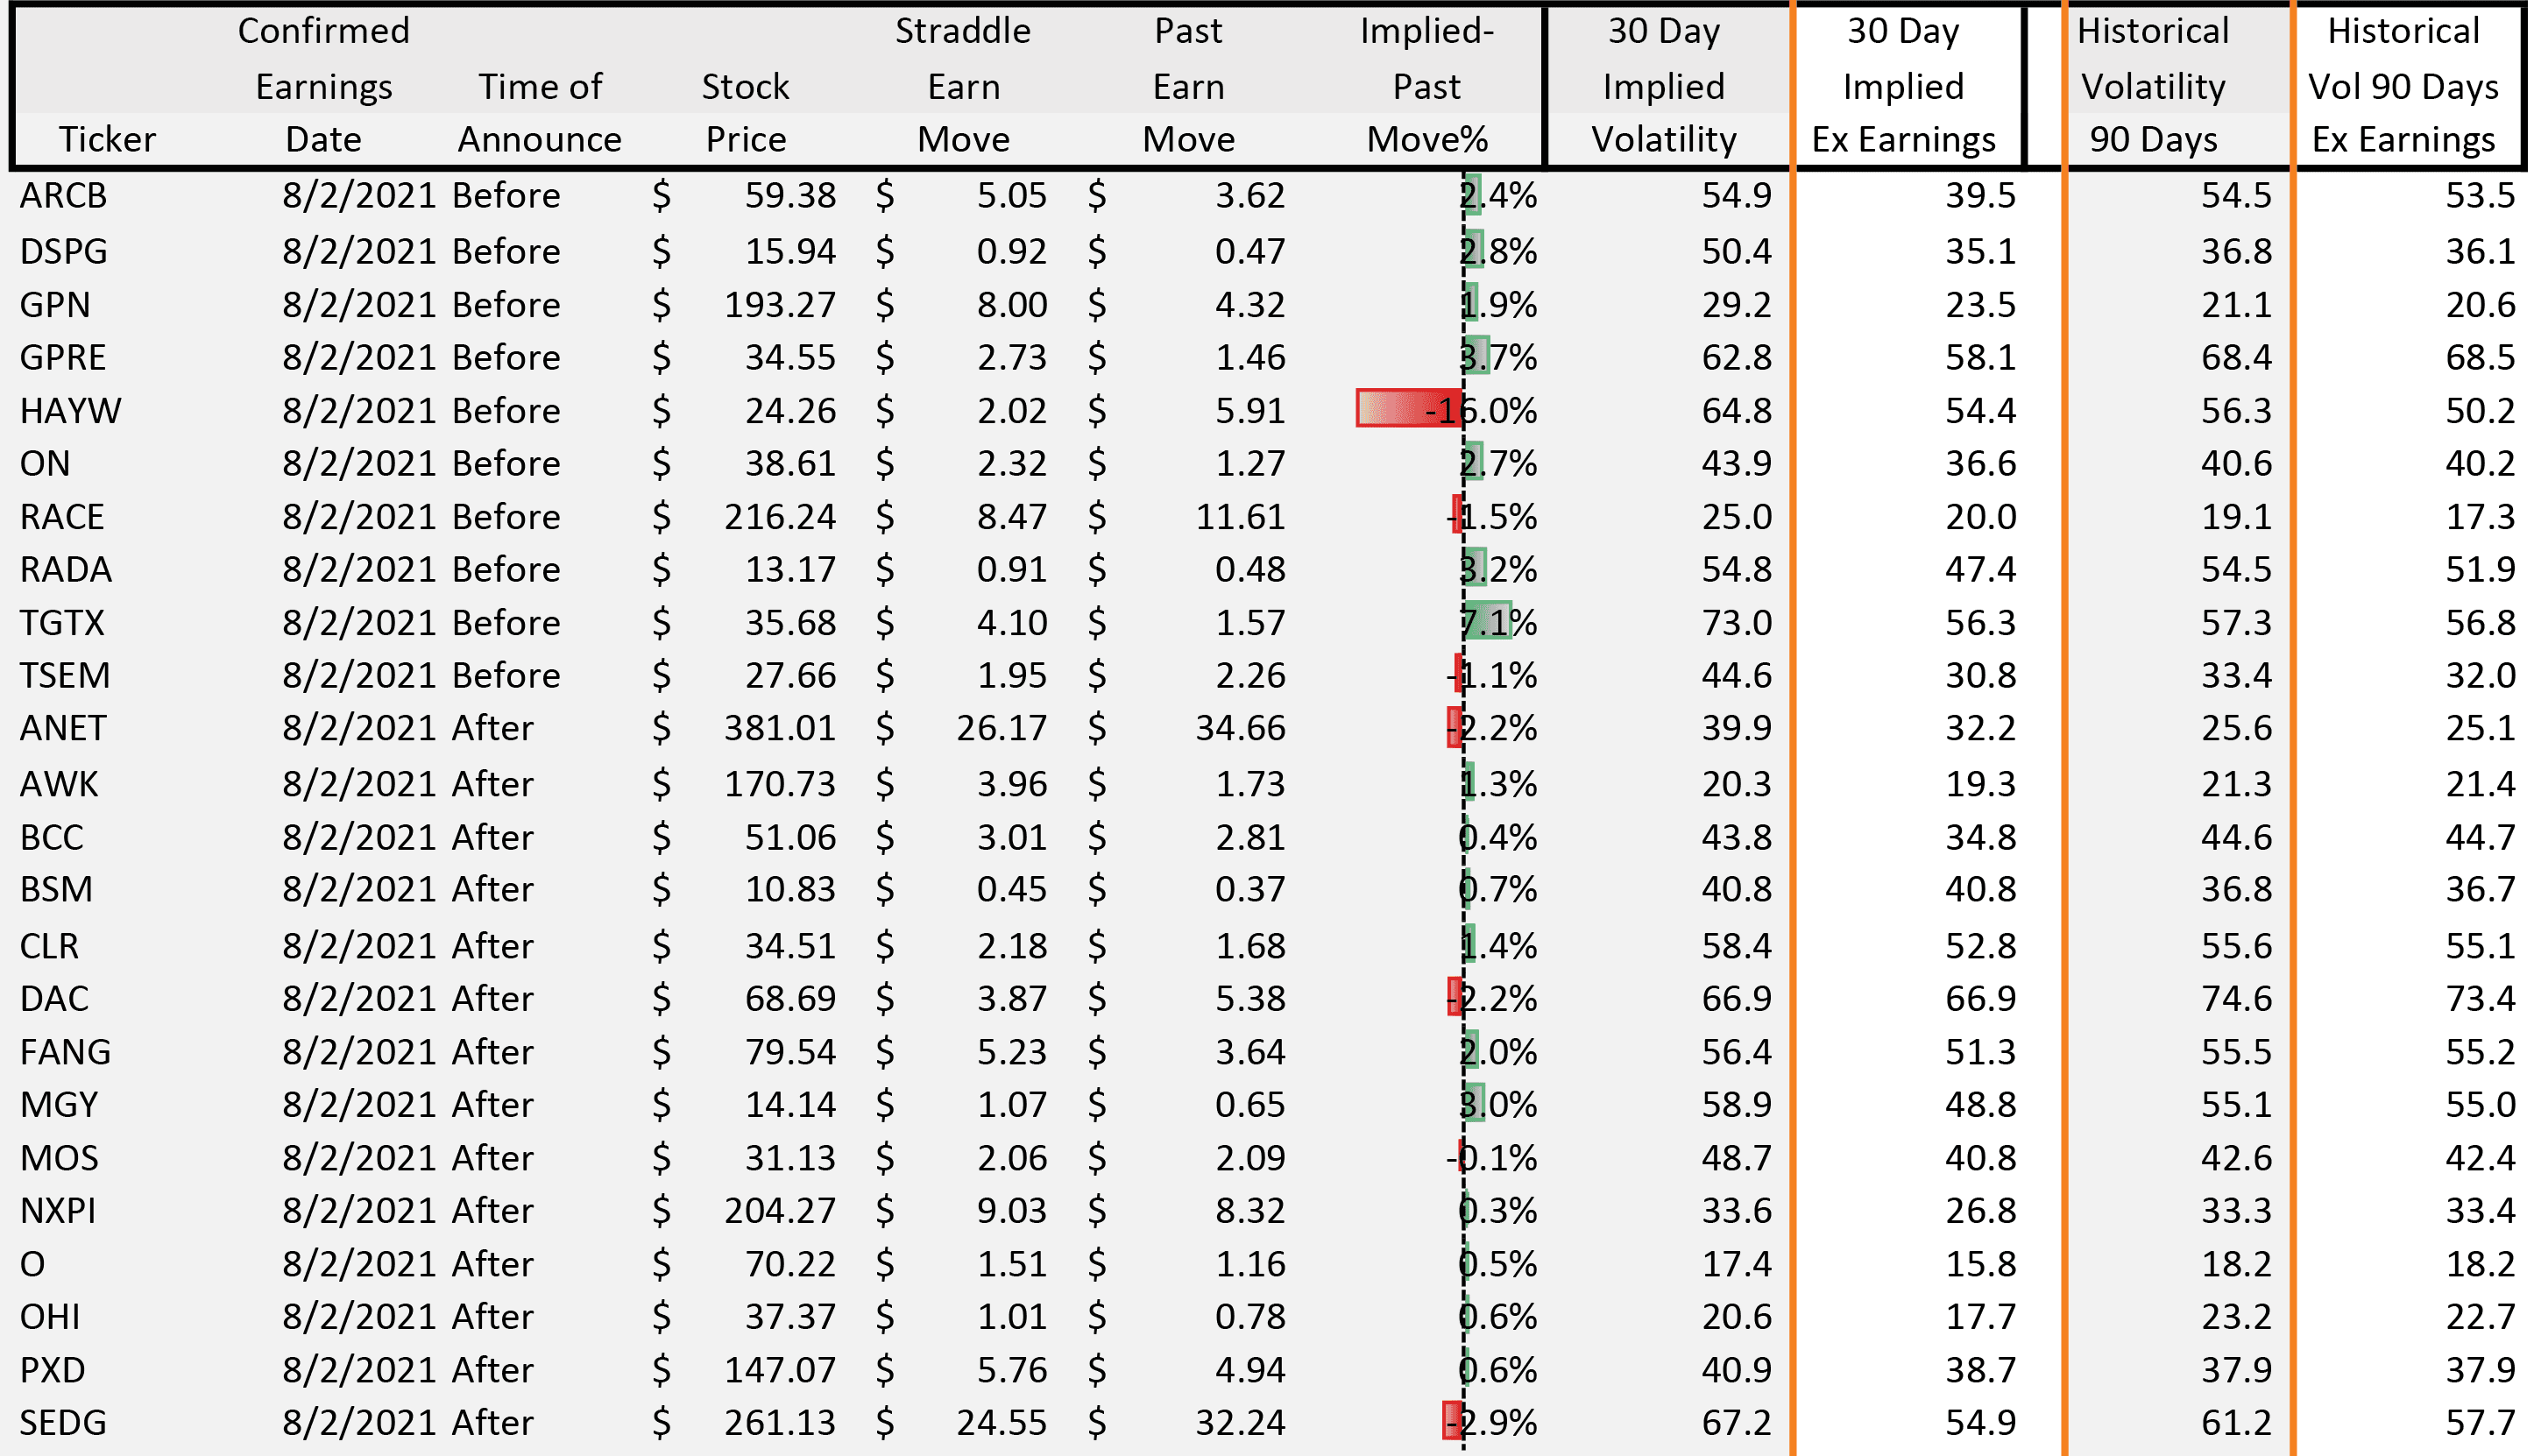
Let’s look at the first stock – ARCB – as an example. The weighted average of the surrounding expiration IVs is 54.9%, but when we take out the earnings effect, we get a lower value of 39.5%. This means that the implied volatility attributable to earnings for this stock is around 15% at the 30-day maturity. There are a few steps we take to calculate this value:
1. Calculate how many earnings dates come before each expiration. For example, an option expiring 9 months from now will have approximately 3 earnings dates within that time frame.
2. Add an extra amount of volatility based on a formula and strip that amount out until each expiration ex earnings' implied volatilities line up on a rational term structure relationship.
3. Present monthly and constant maturity readings to derive the portion of the implied volatility that is attributable to earnings.
Piecing It All Together
We’ve covered how ORATS uses options data to forecast earnings moves and derive ex-earnings implied volatility. We can use the ORATS Data API and Wheel web platform of tools to further analyze this data.
Data API
ORATS offers hundreds of proprietary indicators that utilize implied volatility and its relation to earnings. By extracting the amount of implied volatility attributable to earnings, traders can better study the historical movement of the stock and compare it to its peers.
In the data API, there is the implied earnings move communicated as a percentage for the upcoming move after earnings. There are also implied volatility readings that incorporate the expectation of earnings moves. For example, the ivSpyRatio indicator utilizes the ex-earnings implied volatility of the stock, which has earnings to SPY which does not directly have earnings. You can learn more about this indicator in the video below:
To receive the latest indicator breakdowns, subscribe to our blog or YouTube channel.
Learn about our Data API: https://orats.com/data-api/
Wheel Web Platform
ORATS offers an online toolkit designed to help you backtest, scan, and trade options strategies based on historical data and proprietary indicators. For example, you can backtest earnings trades by identifying when a straddle is undervalued.
Learn about our Wheel web platform: https://orats.com/wheel/
The ORATS Earn Move Report was recently used in conjunction with this article on MarketWatch: https://www.marketwatch.com/story/amazon-stock-falls-ahead-of-earnings-report-with-options-traders-not-expecting-too-much-action-after-results-2021-07-29
Disclaimer:
The opinions and ideas presented herein are for informational and educational purposes only and should not be construed to represent trading or investment advice tailored to your investment objectives. You should not rely solely on any content herein and we strongly encourage you to discuss any trades or investments with your broker or investment adviser, prior to execution. None of the information contained herein constitutes a recommendation that any particular security, portfolio, transaction, or investment strategy is suitable for any specific person. Option trading and investing involves risk and is not suitable for all investors.
All opinions are based upon information and systems considered reliable, but we do not warrant the completeness or accuracy, and such information should not be relied upon as such. We are under no obligation to update or correct any information herein. All statements and opinions are subject to change without notice.
Past performance is not indicative of future results. We do not, will not and cannot guarantee any specific outcome or profit. All traders and investors must be aware of the real risk of loss in following any strategy or investment discussed herein.
Owners, employees, directors, shareholders, officers, agents or representatives of ORATS may have interests or positions in securities of any company profiled herein. Specifically, such individuals or entities may buy or sell positions, and may or may not follow the information provided herein. Some or all of the positions may have been acquired prior to the publication of such information, and such positions may increase or decrease at any time. Any opinions expressed and/or information are statements of judgment as of the date of publication only.
Day trading, short term trading, options trading, and futures trading are extremely risky undertakings. They generally are not appropriate for someone with limited capital, little or no trading experience, and/ or a low tolerance for risk. Never execute a trade unless you can afford to and are prepared to lose your entire investment. In addition, certain trades may result in a loss greater than your entire investment. Always perform your own due diligence and, as appropriate, make informed decisions with the help of a licensed financial professional.
Commissions, fees and other costs associated with investing or trading may vary from broker to broker. All investors and traders are advised to speak with their stock broker or investment adviser about these costs. Be aware that certain trades that may be profitable for some may not be profitable for others, after taking into account these costs. In certain markets, investors and traders may not always be able to buy or sell a position at the price discussed, and consequently not be able to take advantage of certain trades discussed herein.
Be sure to read the OCCs Characteristics and Risks of Standardized Options to learn more about options trading.
Related Posts