Indicators
Wednesday, July 1st 2026
The S&P 500 Is Calm Because Its Giants Won't Move Together
The S&P 500’s biggest stocks are still pricing large individual moves, but the index is pricing very little togetherness, leaving correlation near the cheap end of the past two years.
Summary
The S&P 500 appears calm because its nine largest tech and AI mega‑caps are trading with much higher individual volatility than the index, creating a low correlation and a low index‑to‑mega‑cap volatility ratio (~0.35), near the cheap end of the past two years; this gap persists despite earnings and suggests the market is pricing the giants to move independently, leaving the index quiet but vulnerable to a re‑coupling shock that could quickly raise index volatility.
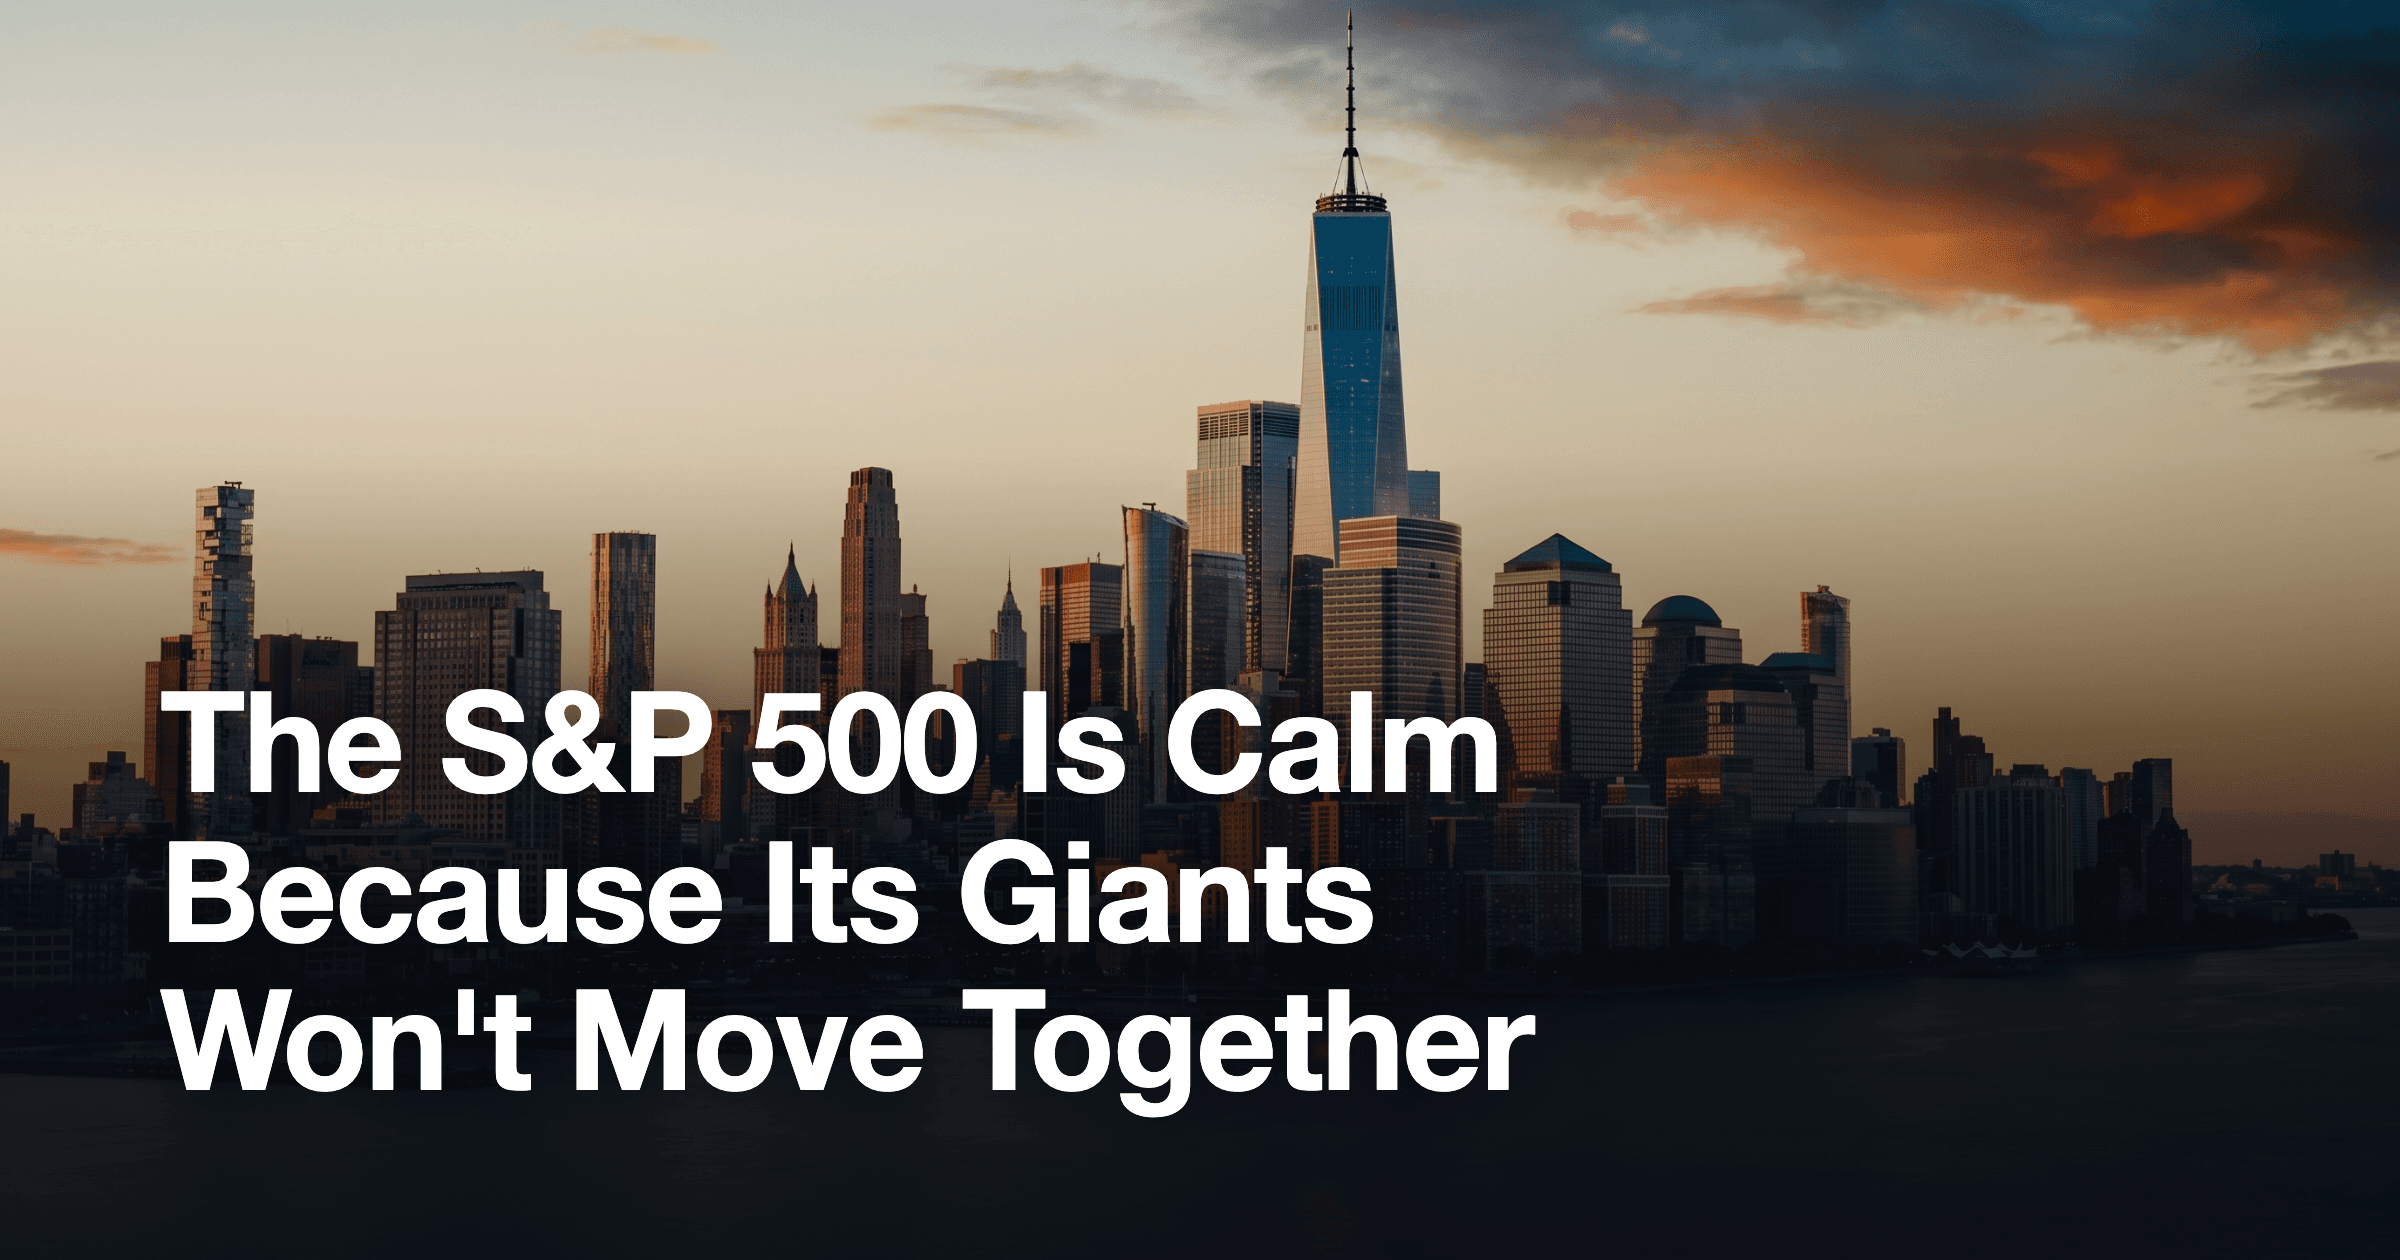
The S&P 500 Is Calm Because Its Giants Won't Move Together
July 1, 2026
By Matt Amberson
On Monday the Dow closed above 52,000 for the first time and Alphabet traded its opening session as a member, the kind of day that looks like every big stock pulling the same way. The options market is pricing the opposite. At Monday's close the S&P 500's 30-day at-the-money implied vol was 14% (VIX, which loads the index's richly bid downside puts, closed at 18.4), while its nine largest tech and AI holdings averaged 40% on a cap-weighted basis. The index trades at barely a third of its own engine, a ratio of 0.35 that sits around the 20th percentile of the last two years. At the money, the market is paying up for these giants to move on their own and almost nothing for them to move together.
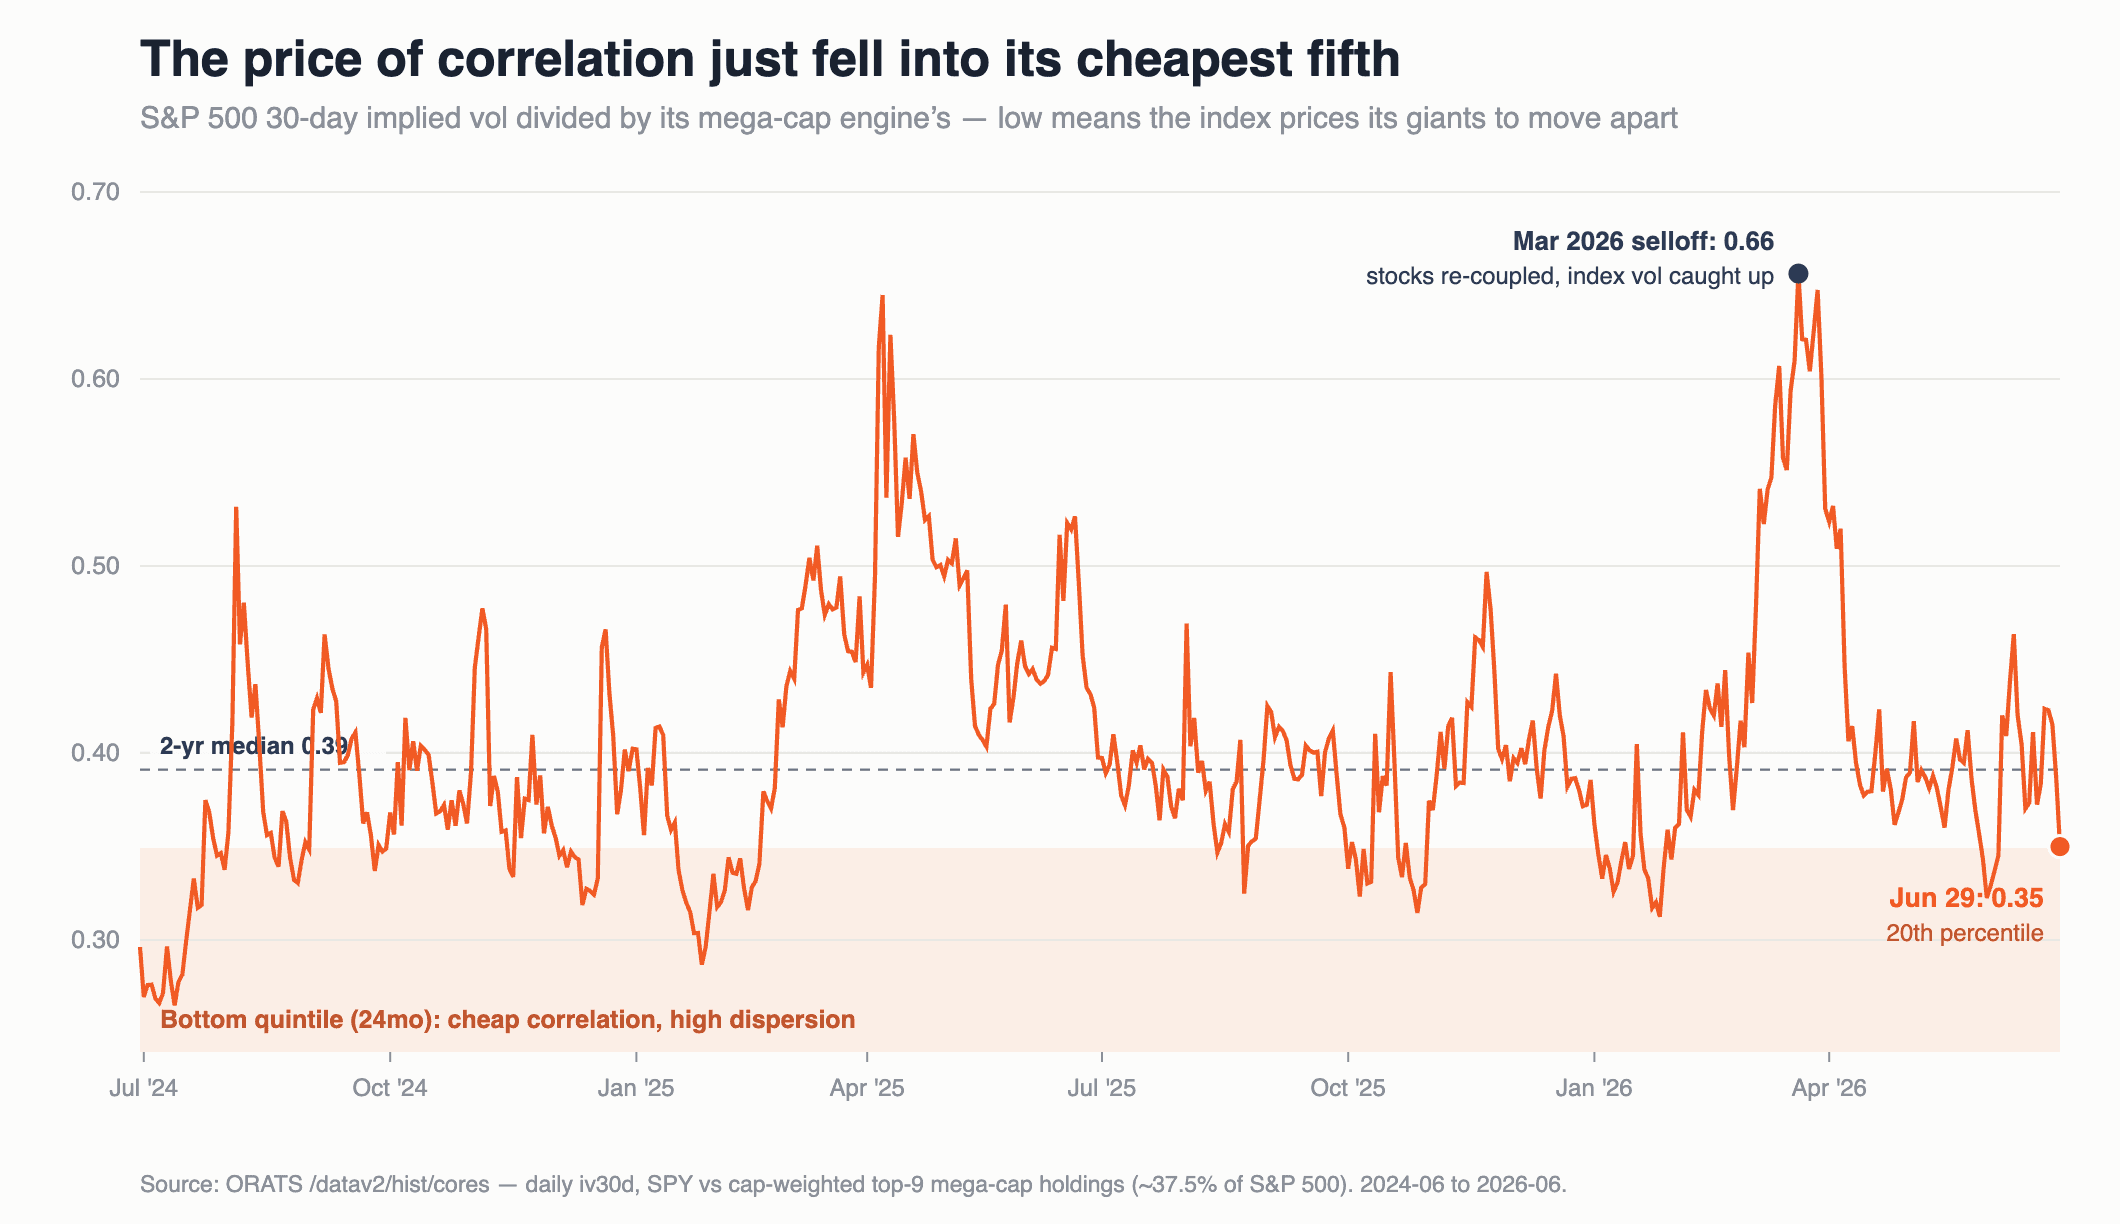
The price of correlation: SPY 30-day implied vol divided by its mega-cap engine's, at 0.35 on June 29, around the 20th percentile of two years. When stocks re-coupled in March 2026 it hit 0.66.
Index vol is the price of togetherness
A basket only swings as hard as its members when they move in sync. When they scatter, the swings cancel and the index goes quiet while the components stay loud. So the gap between single-name and index vol is the live price of how together the giants trade, and it's near the low end of the AI era.
Apple sits at 27% implied vol, Nvidia and Amazon at 37%, Microsoft and Meta near 40%, Broadcom and Tesla in the high 40s, Micron at a remarkable 94%. The S&P 500 they anchor: 14%.
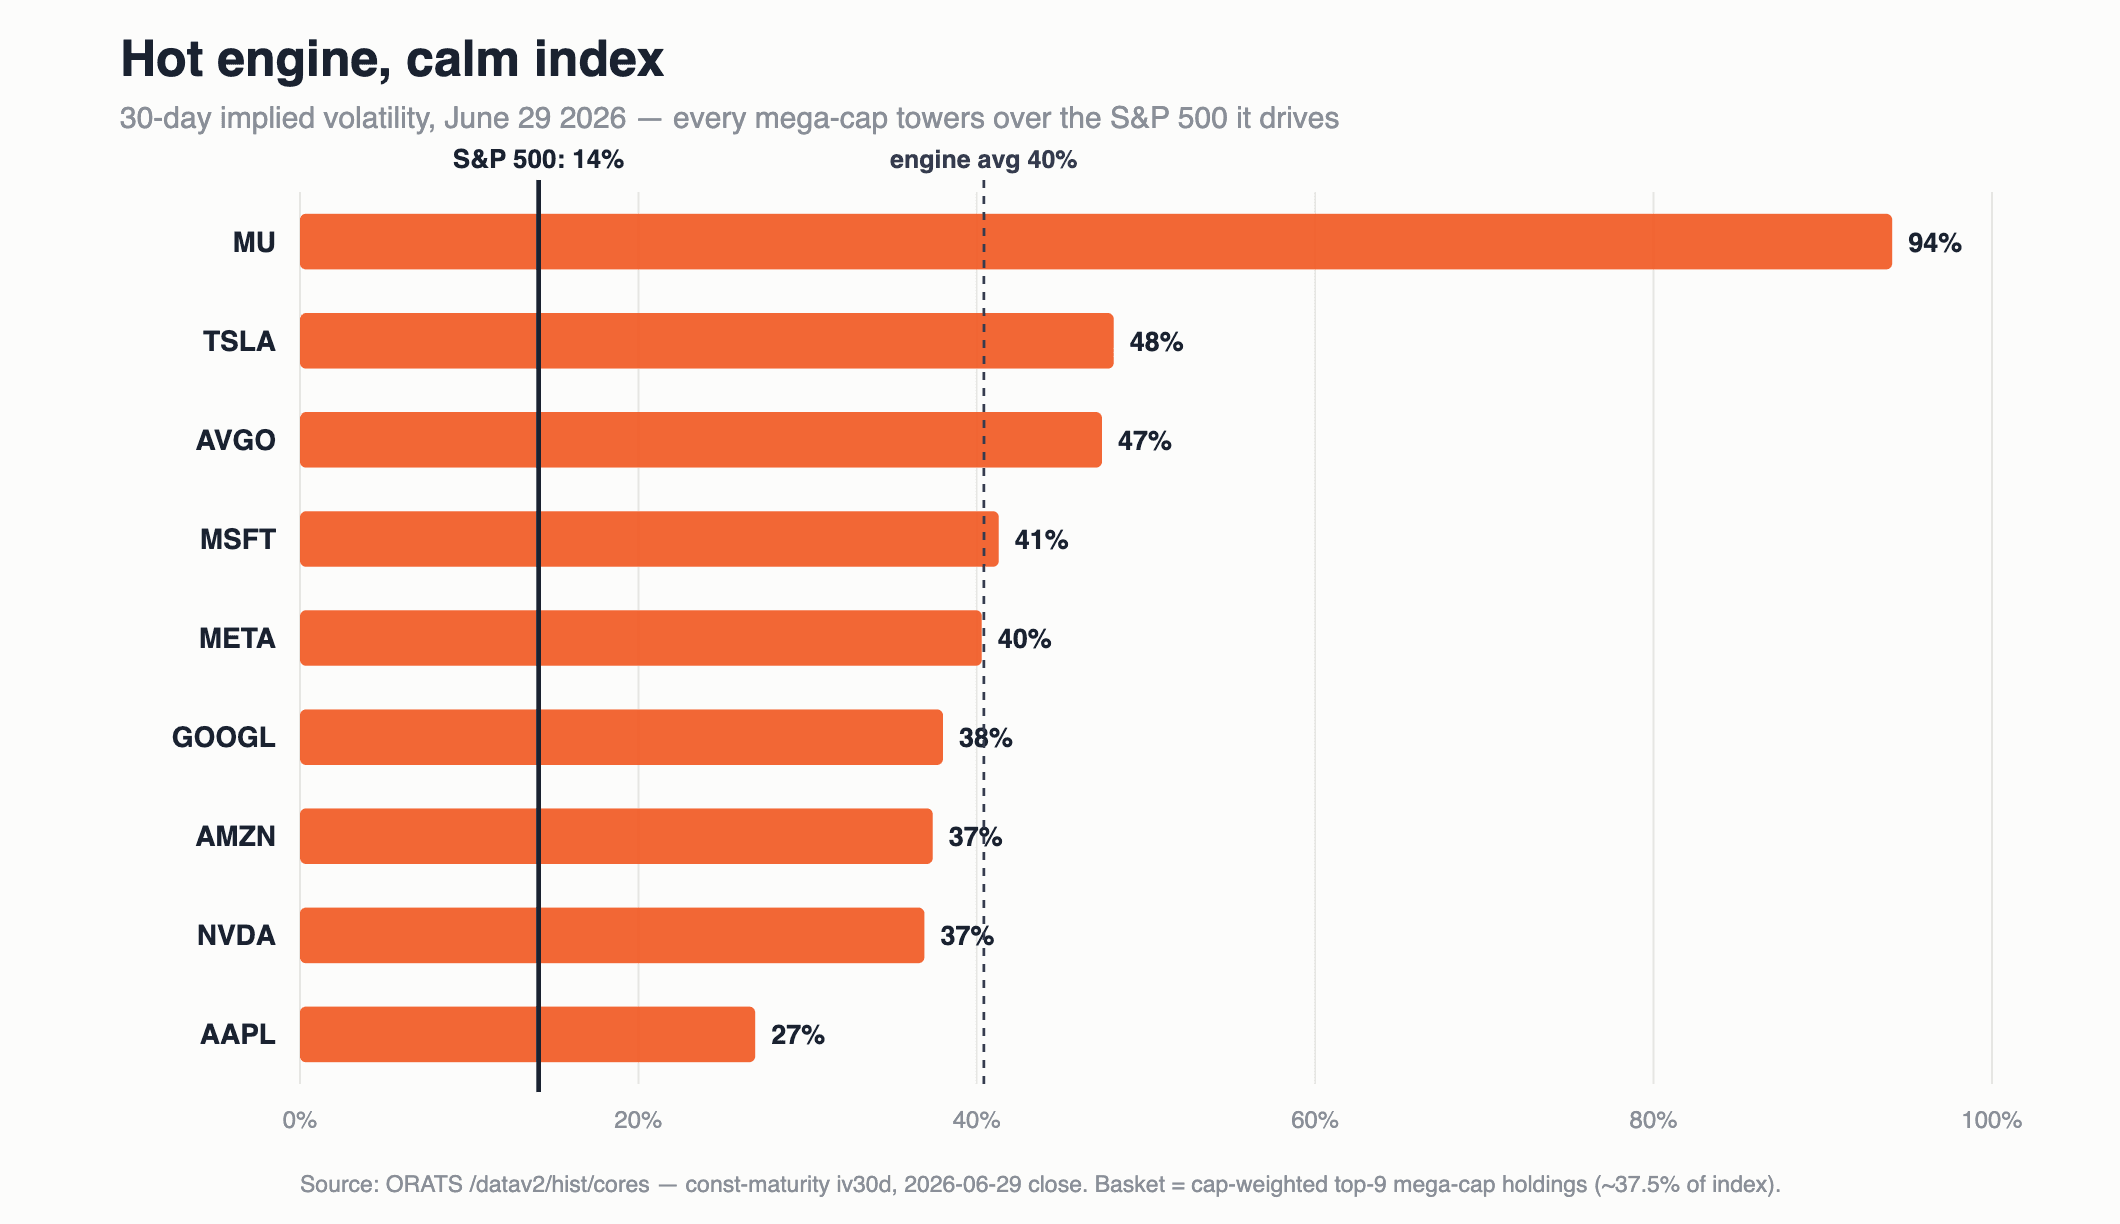
30-day implied vol on June 29. Every one of the nine largest tech and AI holdings towers over the 14% index, averaging 40% cap-weighted.
Pull any one live: Alphabet, fresh into the Dow, carries 37% in Trade Builder, nearly triple the broad index.
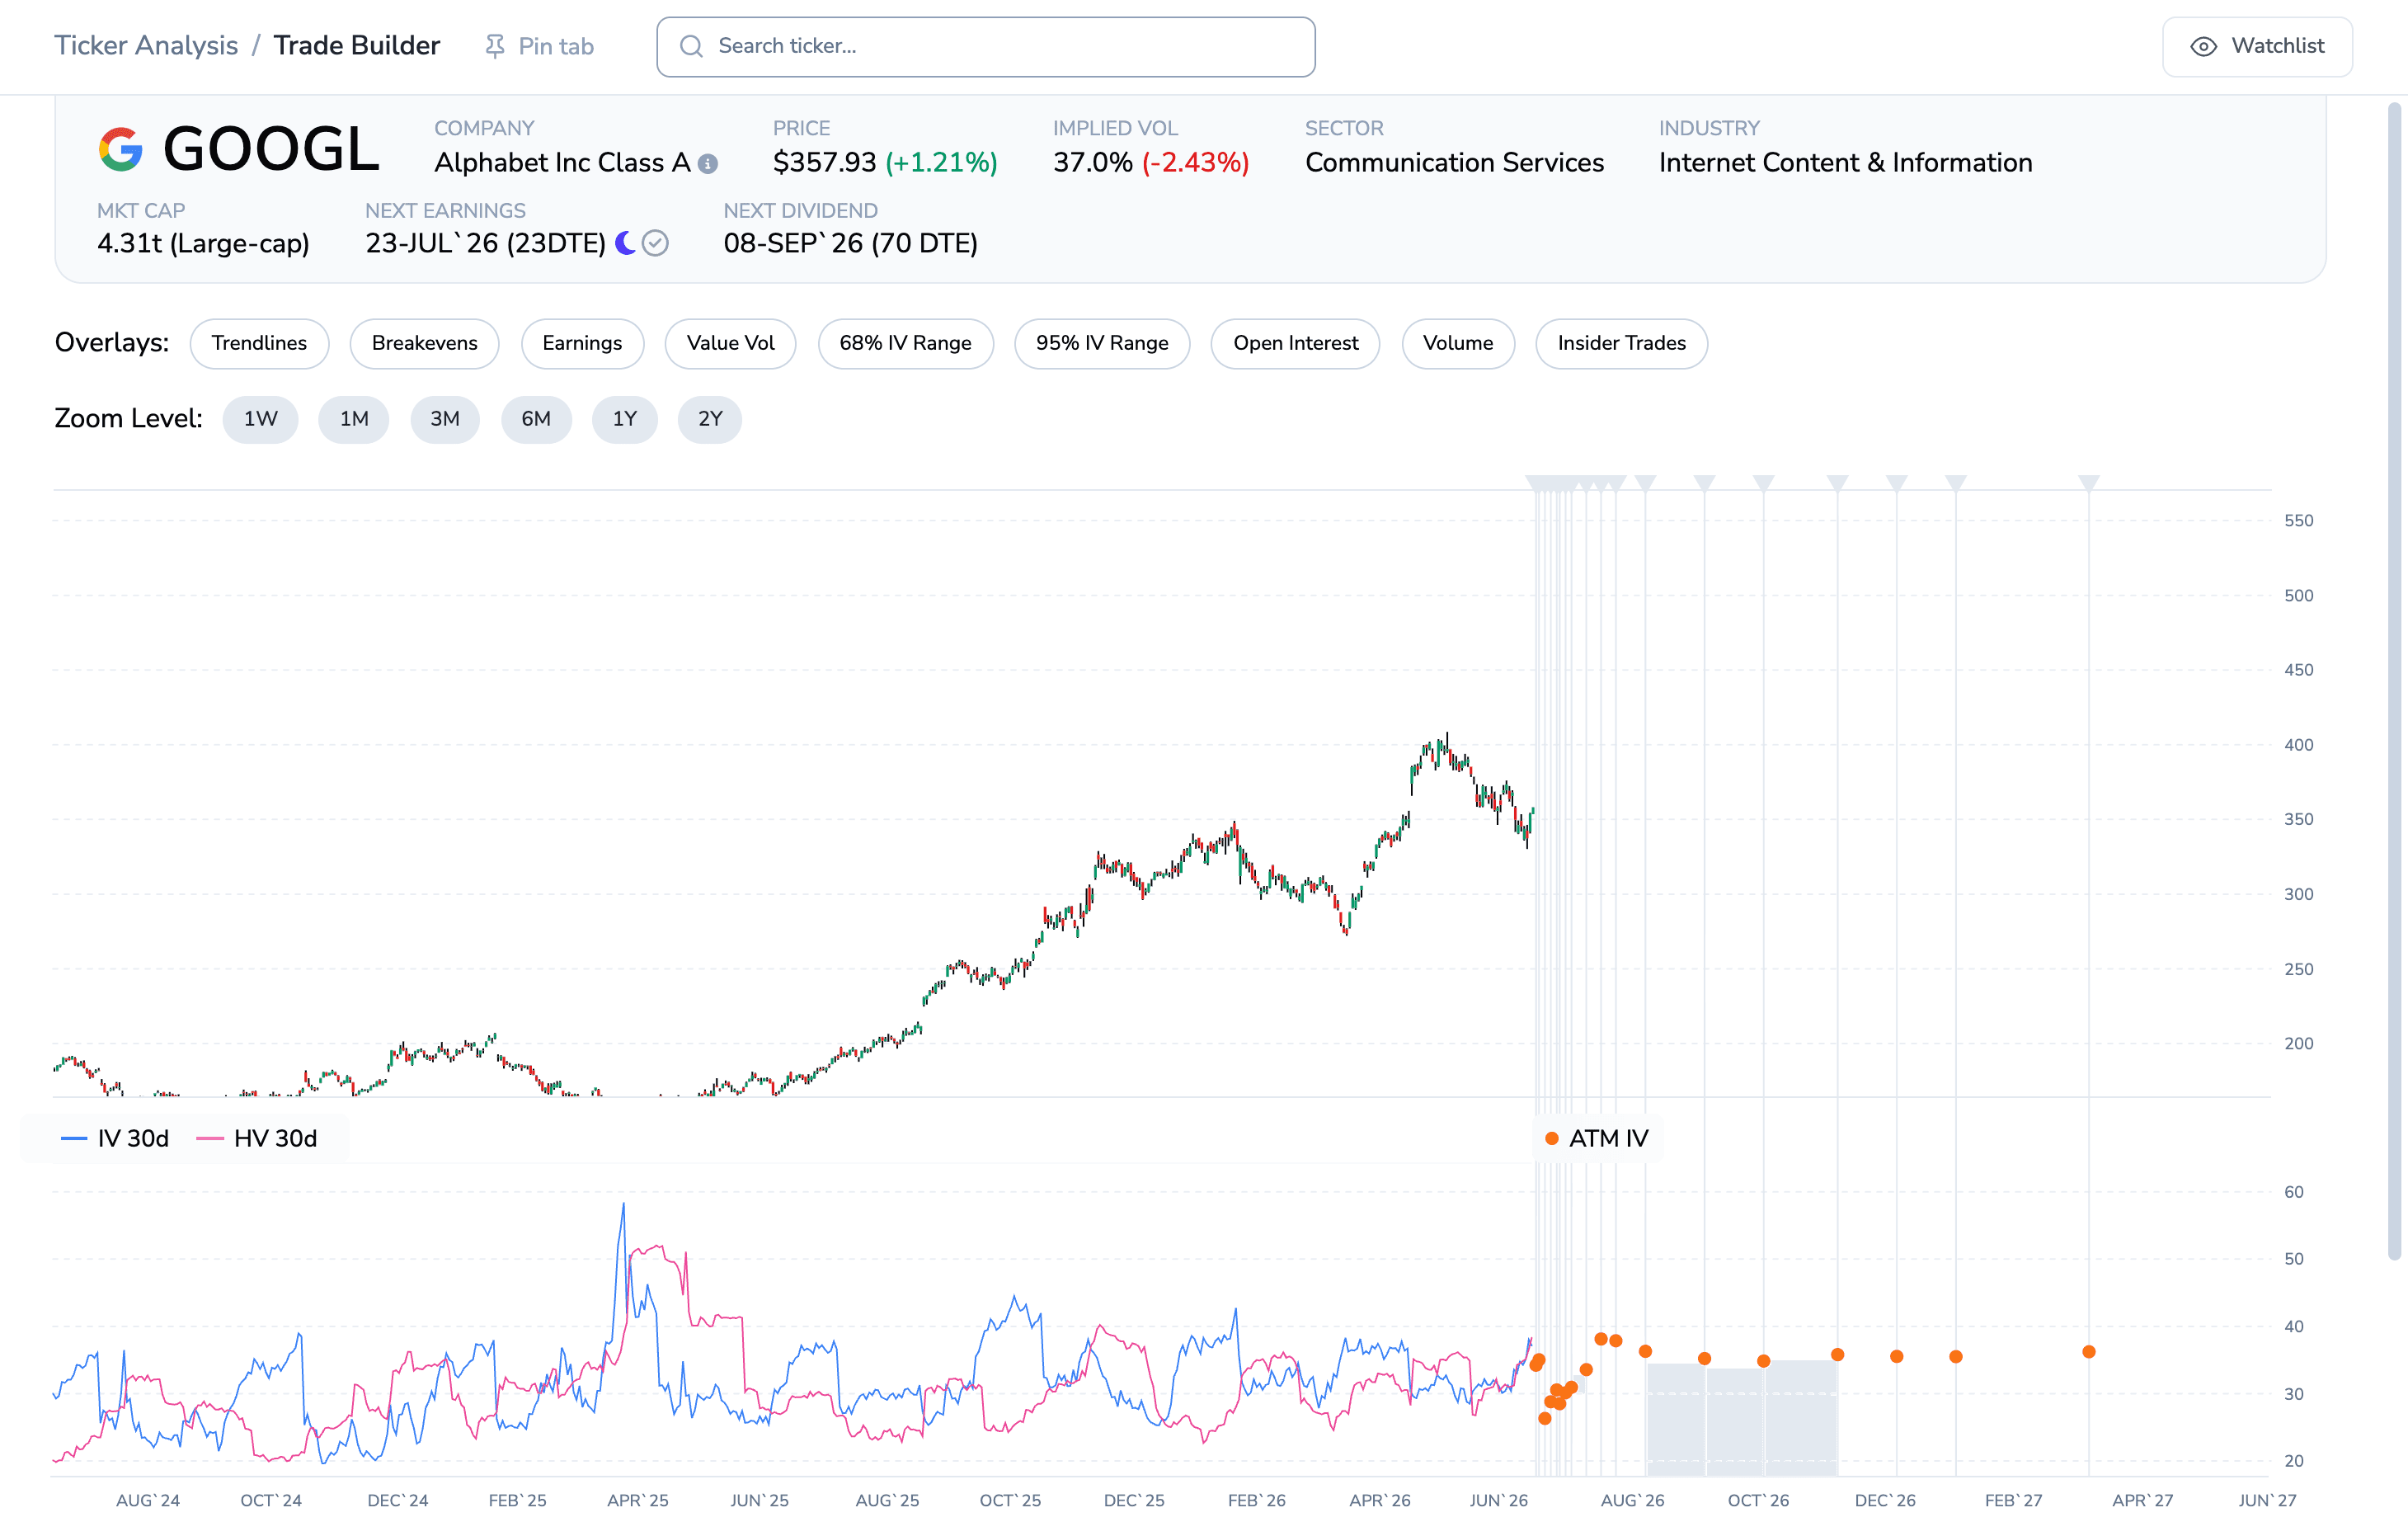
Alphabet, fresh into the Dow this week, carries 37% implied vol in Trade Builder, nearly three times the ~13% on the S&P 500 it also anchors.
Strip out earnings and it holds
The obvious objection is the July earnings cluster, since Alphabet, Microsoft, Amazon and Meta all report inside the window. Strip every earnings event out and the engine still averages 38% against the index's 14%, a ratio of 0.37. Three of the nine names, Nvidia, Broadcom and Micron, carry no earnings in the window at all. Earnings season is not what's keeping the index quiet.
Why it sits here, and what moves it
Part of this is just the resting state of the AI cycle. Index vol gets sold by overwriters, structured products and vol-control funds, while component vol stays bid on single-name AI-call demand. That has held the gap wide for much of two years, so the catalyst that closes it matters more than the level.
When the names last re-coupled, in the March 2026 selloff, this ratio hit 0.66, nearly double today's 0.35, as index vol raced to catch its components.
By ORATS's own ~17% vol forecast, the 14% at-the-money is the cheap, model-positive expression. The risk is that realized keeps tracking the low 14% print while correlation stays pinned, so you fund theta with little edge until a re-coupling shock pays off. That shock would not need higher single-name vol. If these nine move together again, the index re-rates on correlation alone, as it did in March.
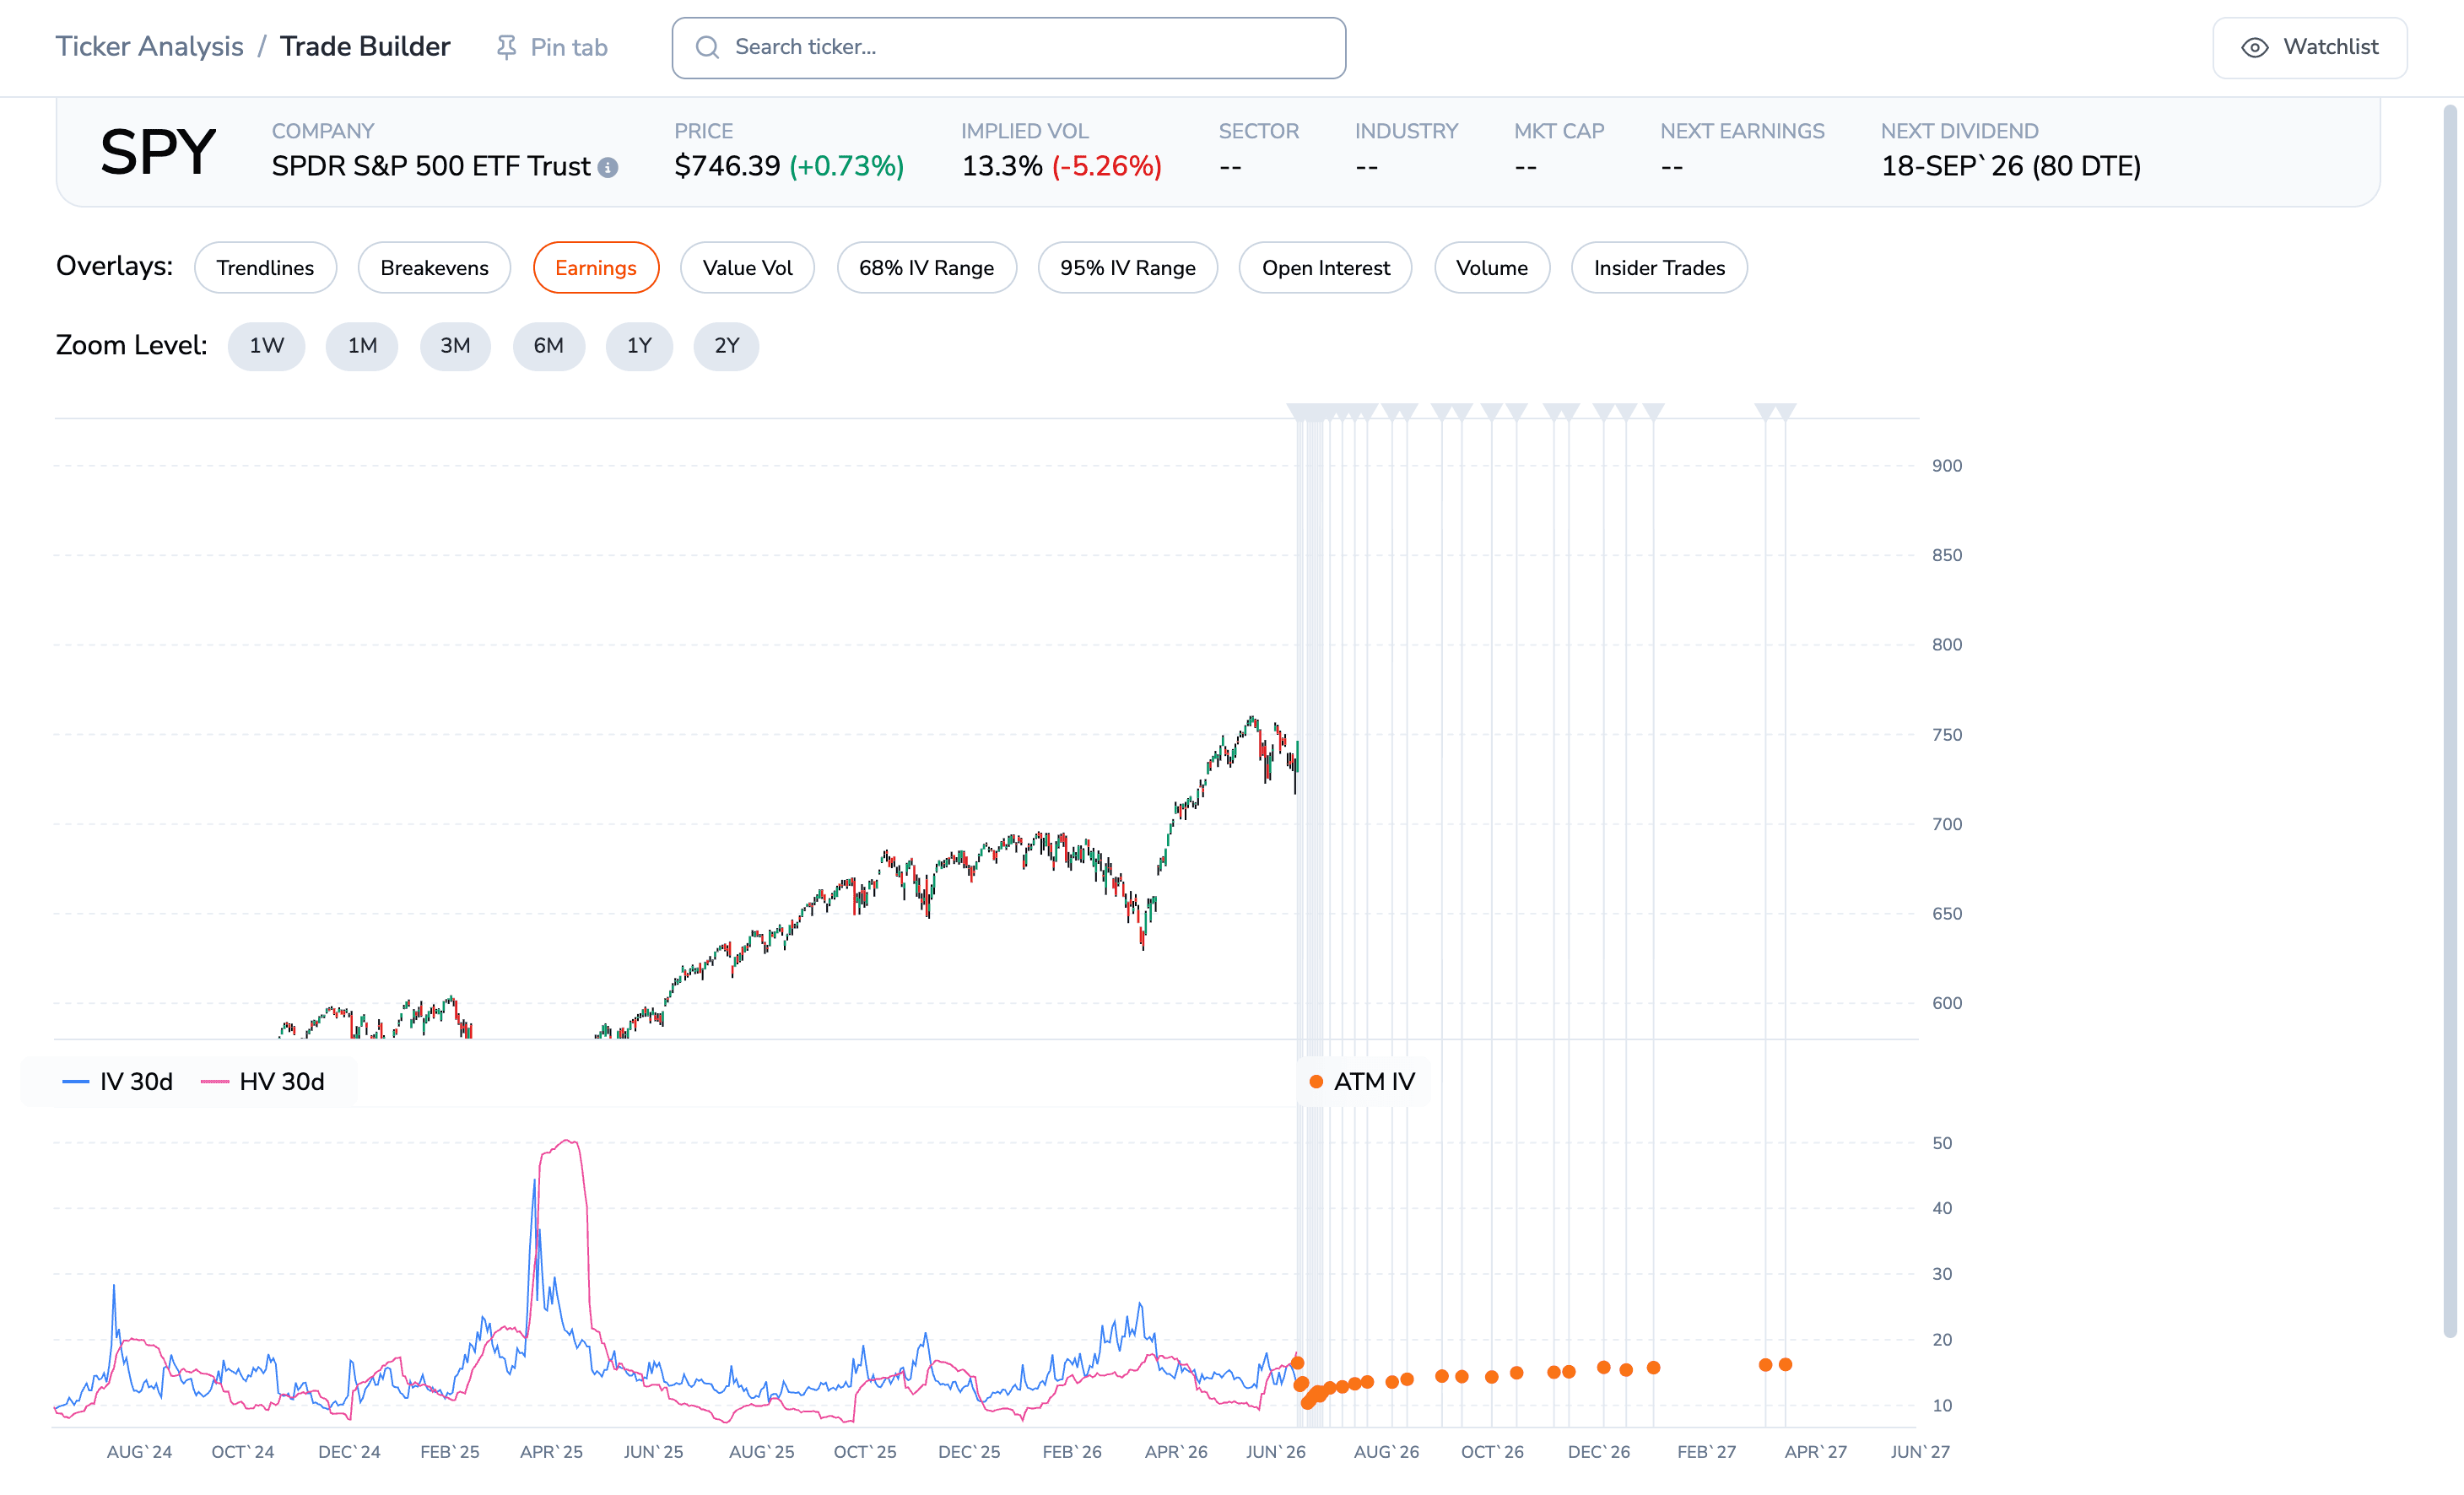
SPY's 30-day implied vol (blue) sits near the bottom of its two-year range, around 13% live, with the forward at-the-money curve in mild contango.
To run it yourself, pull any mega-cap in Trade Builder and read its live at-the-money IV against SPY's, or rebuild the ratio from api.orats.io/datav2/hist/cores across the names and the index. The quietest part of this rally is also its cheapest at the money, and the most exposed if the giants stop trading apart.
Disclaimer:
The opinions and ideas presented herein are for informational and educational purposes only and should not be construed to represent trading or investment advice tailored to your investment objectives. You should not rely solely on any content herein and we strongly encourage you to discuss any trades or investments with your broker or investment adviser, prior to execution. None of the information contained herein constitutes a recommendation that any particular security, portfolio, transaction, or investment strategy is suitable for any specific person. Option trading and investing involves risk and is not suitable for all investors.
All opinions are based upon information and systems considered reliable, but we do not warrant the completeness or accuracy, and such information should not be relied upon as such. We are under no obligation to update or correct any information herein. All statements and opinions are subject to change without notice.
Past performance is not indicative of future results. We do not, will not and cannot guarantee any specific outcome or profit. All traders and investors must be aware of the real risk of loss in following any strategy or investment discussed herein.
Owners, employees, directors, shareholders, officers, agents or representatives of ORATS may have interests or positions in securities of any company profiled herein. Specifically, such individuals or entities may buy or sell positions, and may or may not follow the information provided herein. Some or all of the positions may have been acquired prior to the publication of such information, and such positions may increase or decrease at any time. Any opinions expressed and/or information are statements of judgment as of the date of publication only.
Day trading, short term trading, options trading, and futures trading are extremely risky undertakings. They generally are not appropriate for someone with limited capital, little or no trading experience, and/ or a low tolerance for risk. Never execute a trade unless you can afford to and are prepared to lose your entire investment. In addition, certain trades may result in a loss greater than your entire investment. Always perform your own due diligence and, as appropriate, make informed decisions with the help of a licensed financial professional.
Commissions, fees and other costs associated with investing or trading may vary from broker to broker. All investors and traders are advised to speak with their stock broker or investment adviser about these costs. Be aware that certain trades that may be profitable for some may not be profitable for others, after taking into account these costs. In certain markets, investors and traders may not always be able to buy or sell a position at the price discussed, and consequently not be able to take advantage of certain trades discussed herein.
Be sure to read the OCCs Characteristics and Risks of Standardized Options to learn more about options trading.
Related Posts