Indicators
Thursday, February 19th 2026
What Is the True Value of an Option?
Understanding Structural, Statistical, and Forward Value in Options
Summary
Option valuation can be assessed through three perspectives: Structural Value (S%), which compares current pricing to today's market structure; Statistical Value (D%), which evaluates alignment with historical outcomes; and Forward Value (F%), which considers consistency with expected future volatility. Each measure provides different insights, and discrepancies among them can indicate market shifts. Understanding these benchmarks helps traders make informed decisions about whether an option is truly cheap or expensive.
Two traders look at the same option.
One calls it cheap. The other calls it expensive.
Same price. Opposite conclusions.
Who’s right?
Before you can decide whether an option has value, you have to define what you are comparing it to.
Without a reference point, words like “cheap” and “expensive” do not mean anything.
Most option pricing models attempt to estimate fair value. But fair value depends entirely on the benchmark you choose.
In options markets, there is no single true value. At ORATS, we frame option valuation using three distinct reference perspectives:
- S% (sPct) — StructuralD% (dPct) — StatisticalF% (fPct) — Forward-looking
Each answers a different question.
Structural Value: Is the Option Mispriced Relative to Today’s Market?
The first question is about internal consistency.
Raw implied volatility can be noisy. Wide bid-ask spreads, put-call parity deviations, and microstructure effects can distort the surface.
ORATS constructs a smoothed volatility surface using its proprietary SMV (Smoothed Market Value) process. SMV fits implied volatilities across strikes and expirations to produce a consistent, arbitrage-free surface reflecting the market’s underlying risk structure.
S% (Smoothed Edge) compares the current option quote to that cleaned surface.
- A positive S% indicates the option is trading cheap relative to the smoothed surface.
- A negative S% indicates it is trading rich relative to that structure.
This is not about history. It is not about forecasting. It is about whether the option is aligned with today’s market structure. That is structural value.
Statistical Value: Is the Option Misaligned with Historical Outcomes?
The second benchmark shifts from structure to behavior.
If implied volatility is pricing a certain level of risk, how does that compare to what the stock has actually delivered in the past?
This comparison is distributional.
Stocks do not move in neat averages. They have skew. They have fat tails. They have asymmetry.
D% (Distribution Edge) compares the market’s implied distribution to the stock’s historical distribution of realized outcomes.
This includes:
- The frequency of tail events
- The skew of returns
- How often realized moves exceeded implied expectations
- A positive D% indicates options are statistically cheap relative to historical outcomes.
- A negative D% indicates they are statistically rich.
That is statistical value.
Forward Value: Is the Option Consistent with Expected Volatility Conditions?
Markets evolve. Volatility regimes shift between low and high volatility periods. Earnings cycles and macro conditions change.
F% (Forecast Edge) compares current implied volatility to ORATS’ forward volatility estimate. That forecast incorporates multiple inputs, including historical realized volatility, term structure dynamics, and earnings-related adjustments.
- A positive F% indicates options are cheap relative to expected future volatility conditions.
- A negative F% indicates they are rich relative to forecast expectations.
That is expectation-relative value.
When the Edges Disagree
These three measures do not compete. They describe different definitions of value.
- S% asks whether the option is mispriced relative to today’s structure.
- D% asks whether it is misaligned with historical behavior.
- F% asks whether it is inconsistent with forward expectations.
Sometimes they align. Sometimes they conflict. When they conflict, that disagreement is information.
For example, an option may show:
- Positive D% (statistically cheap versus history)
- Negative F% (rich relative to forward forecast)
That may suggest the market is pricing in a regime shift not captured in historical distributions. The signal isn’t the number alone. It’s the context.
A Concrete Example
Consider a 30-day at-the-money put on XYZ trading at 28% implied volatility.
The three edge measures show:
- S% = +2% — slightly cheap relative to the smoothed surface
- D% = -3% — rich relative to the stock’s historical distribution
- F% = +1% — slightly cheap relative to forecast expectations
Three benchmarks. Three different answers. What does this combination suggest?
The positive S% indicates a minor structural discount relative to today’s surface. The negative D% suggests implied risk exceeds what historical outcomes would justify. The slightly positive F% implies forward expectations may support somewhat higher volatility.
The modest magnitudes suggest a market that is broadly fairly priced. Disagreement exists, but it is not extreme.
True value depends on which comparison you care about.
Summary of the Three Benchmarks
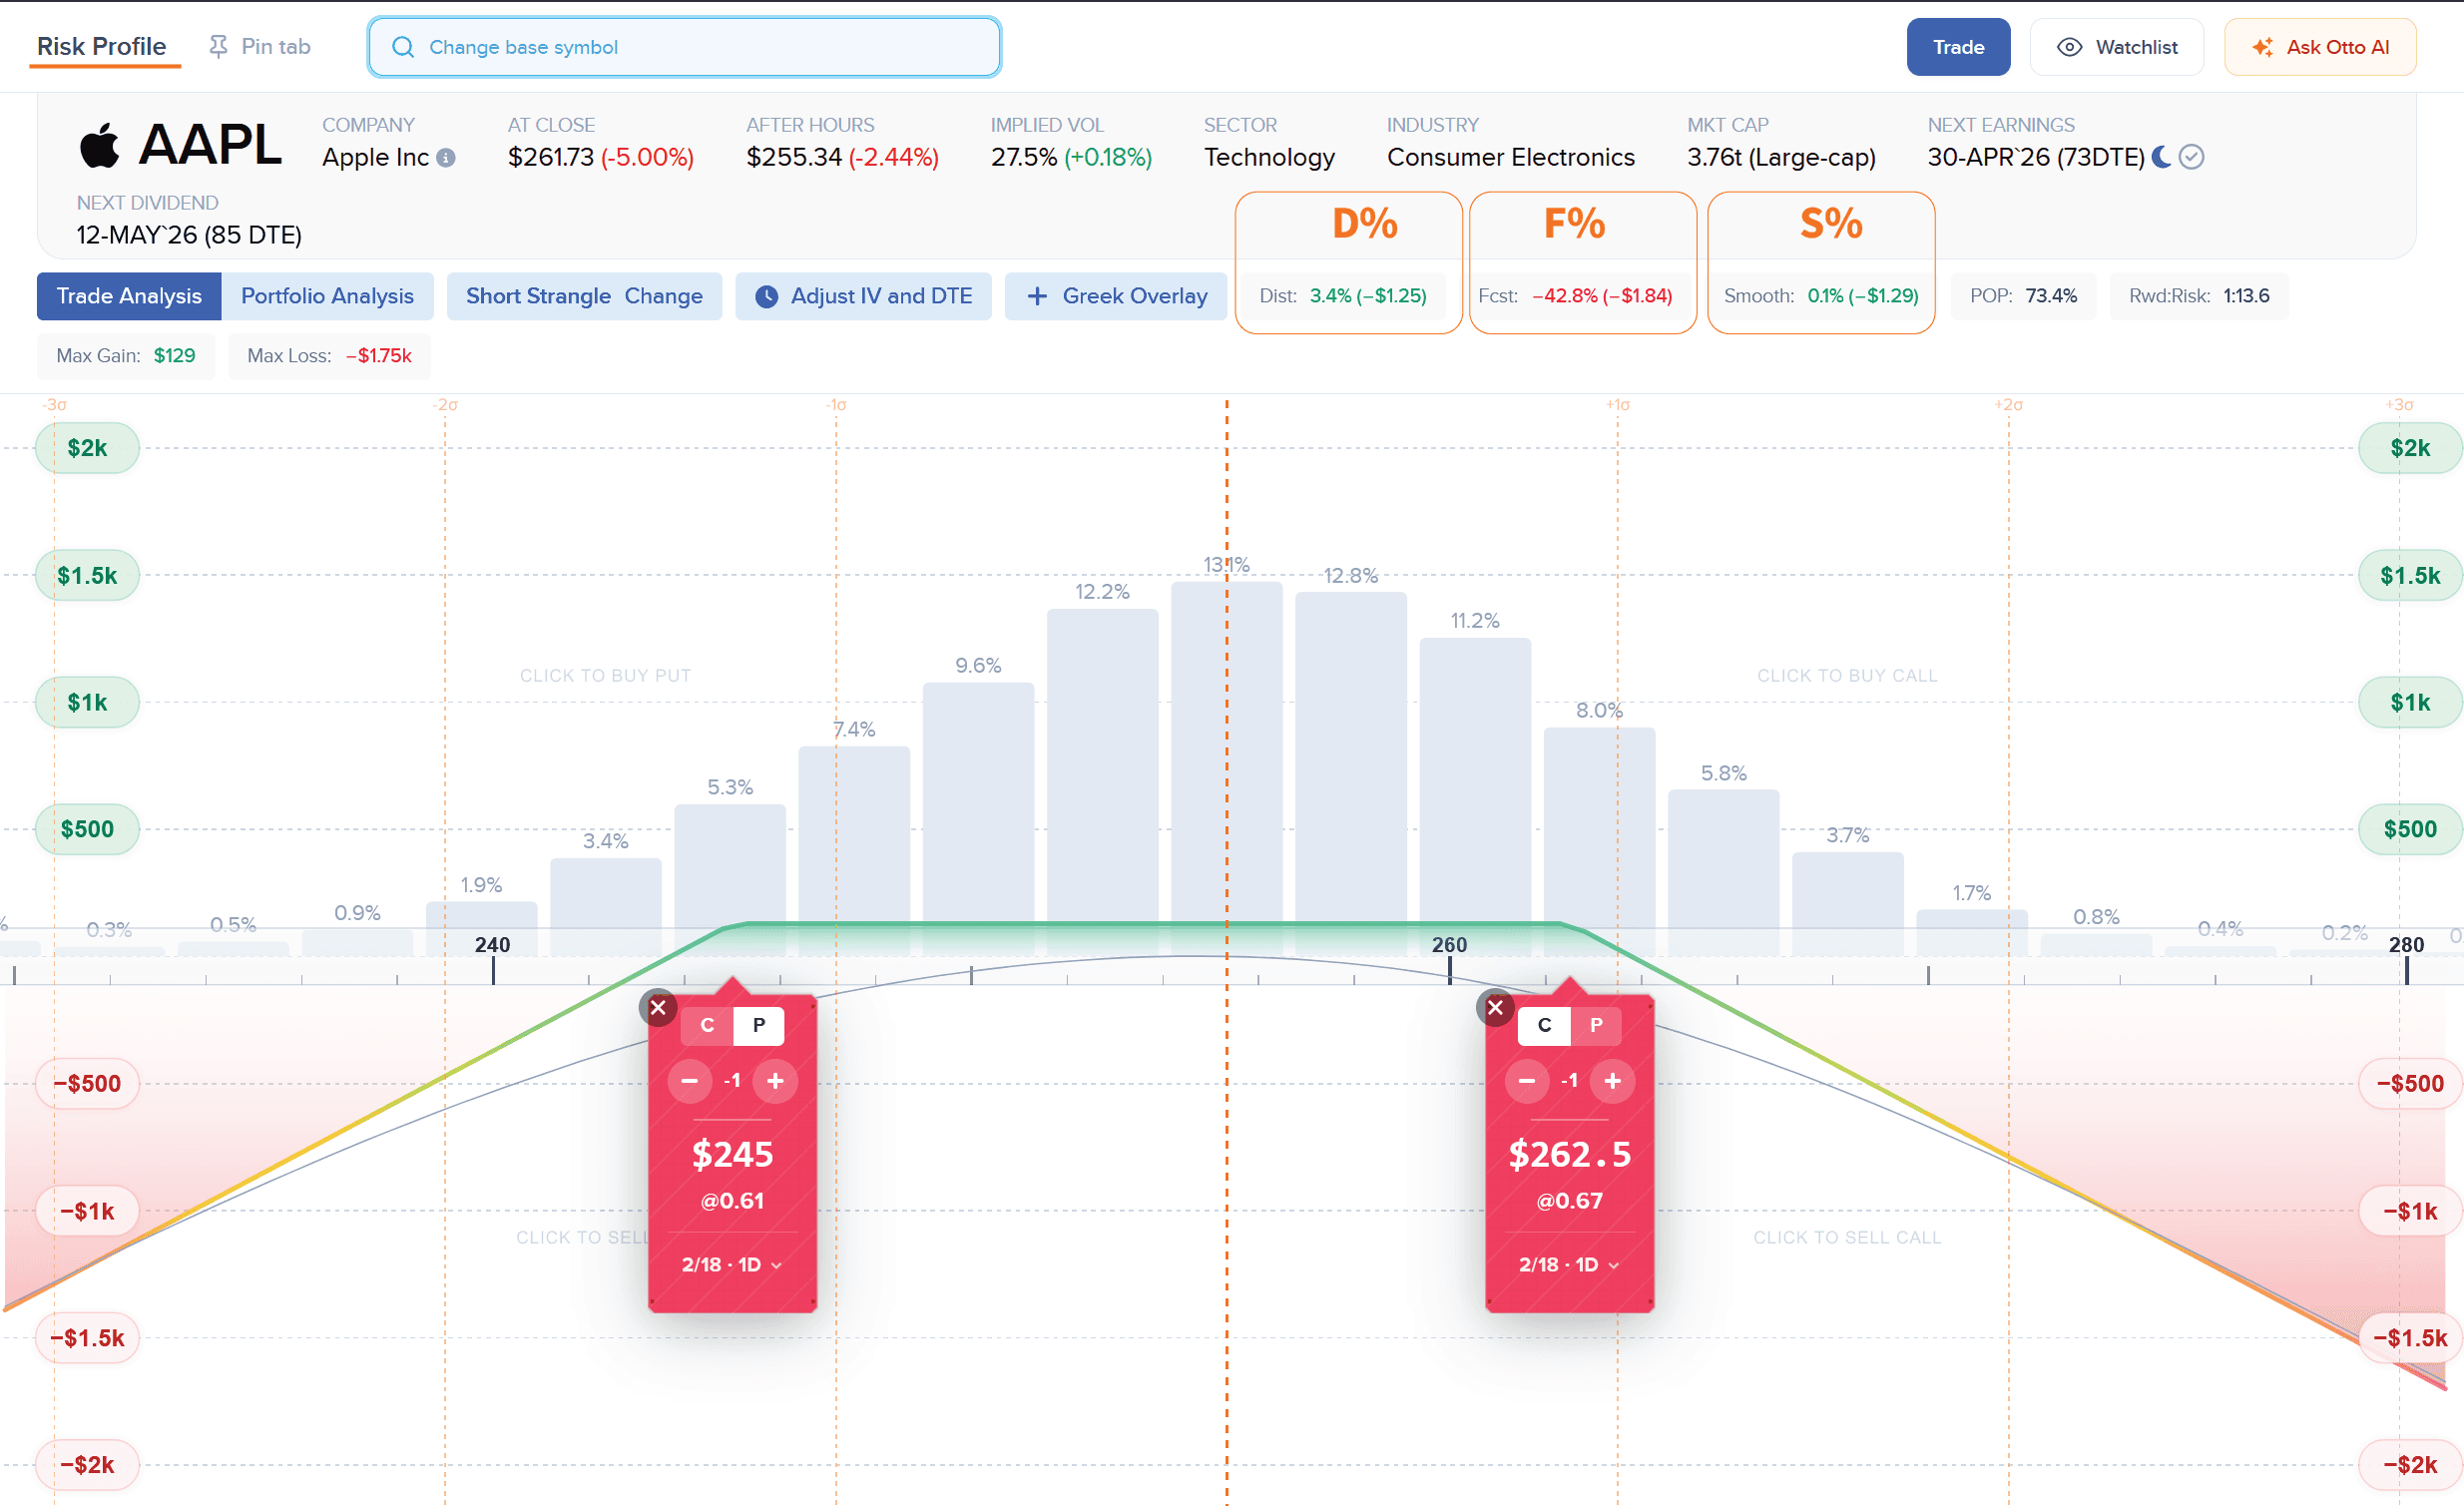
ORATS Dashboard shows these percentages in various places like this option risk profile display.
From Price Reaction to Value Measurement
Most traders react to price. They see a volatility level and form an opinion.
A more disciplined approach defines the reference first.
- Are you trading short-term structural dislocations? Structural value may matter most.
- Are you focused on long-run probability edges? Statistical value may dominate.
- Are you positioning for regime change? Forward value may be decisive.
In the ORATS Dashboard, S%, D%, and F% are displayed together in several places, including the Risk Profile page and the Positions view, allowing you to evaluate all three comparisons as part of your trade analysis.
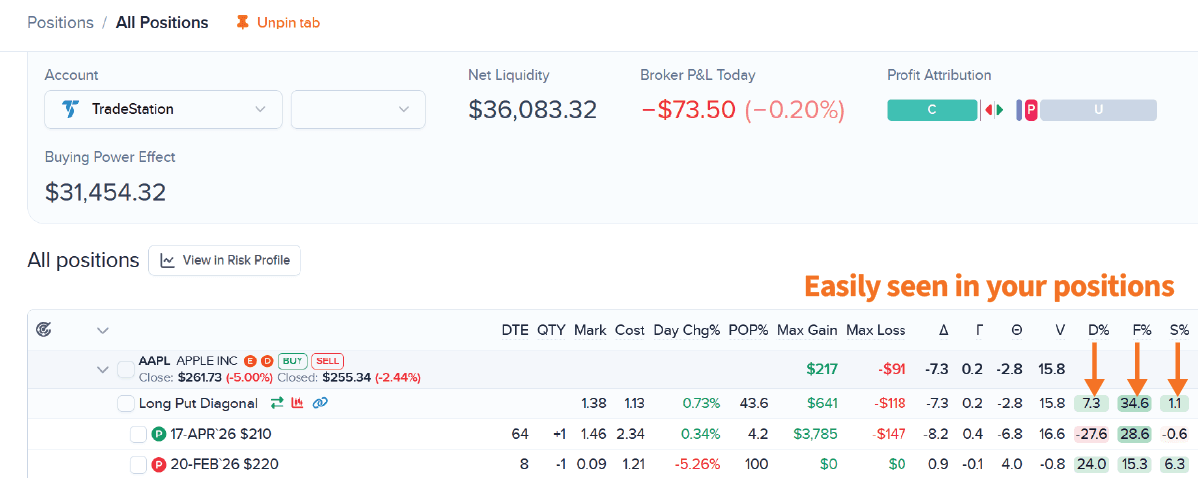
Quickly viewing D%, F%, and S% in your positions in the ORATS Dashboard.
Price is a quote. Value is a comparison.
The next time someone tells you an option is cheap, ask the only question that matters:
Cheap compared to what?
For detailed field definitions, see the ORATS API documentation or contact support@orats.com.
Edge metrics are analytical comparison tools. They do not constitute trade recommendations or guarantees of future performance.
Disclaimer:
The opinions and ideas presented herein are for informational and educational purposes only and should not be construed to represent trading or investment advice tailored to your investment objectives. You should not rely solely on any content herein and we strongly encourage you to discuss any trades or investments with your broker or investment adviser, prior to execution. None of the information contained herein constitutes a recommendation that any particular security, portfolio, transaction, or investment strategy is suitable for any specific person. Option trading and investing involves risk and is not suitable for all investors.
All opinions are based upon information and systems considered reliable, but we do not warrant the completeness or accuracy, and such information should not be relied upon as such. We are under no obligation to update or correct any information herein. All statements and opinions are subject to change without notice.
Past performance is not indicative of future results. We do not, will not and cannot guarantee any specific outcome or profit. All traders and investors must be aware of the real risk of loss in following any strategy or investment discussed herein.
Owners, employees, directors, shareholders, officers, agents or representatives of ORATS may have interests or positions in securities of any company profiled herein. Specifically, such individuals or entities may buy or sell positions, and may or may not follow the information provided herein. Some or all of the positions may have been acquired prior to the publication of such information, and such positions may increase or decrease at any time. Any opinions expressed and/or information are statements of judgment as of the date of publication only.
Day trading, short term trading, options trading, and futures trading are extremely risky undertakings. They generally are not appropriate for someone with limited capital, little or no trading experience, and/ or a low tolerance for risk. Never execute a trade unless you can afford to and are prepared to lose your entire investment. In addition, certain trades may result in a loss greater than your entire investment. Always perform your own due diligence and, as appropriate, make informed decisions with the help of a licensed financial professional.
Commissions, fees and other costs associated with investing or trading may vary from broker to broker. All investors and traders are advised to speak with their stock broker or investment adviser about these costs. Be aware that certain trades that may be profitable for some may not be profitable for others, after taking into account these costs. In certain markets, investors and traders may not always be able to buy or sell a position at the price discussed, and consequently not be able to take advantage of certain trades discussed herein.
Be sure to read the OCCs Characteristics and Risks of Standardized Options to learn more about options trading.
Related Posts