Trading
Tuesday, July 14th 2026
S&P 500: The Volatility Floor That Isn't There
SPY’s one-year IV rank makes volatility look cheap, but percentile, shorter lookbacks, and forecast ratios show a market trading much closer to fair.
Summary
SPY’s implied volatility sits at 13.98%, appearing low on a one‑year median but filling 44% of its one‑month range versus only 20% of the yearly range, making the perceived “floor” depend on the look‑back window; rank (20) and percentile (47) differ, and shortening the window raises the rank, showing that volatility isn’t truly cheap and should be evaluated with both metrics before trading decisions.

By Tyler Cheves · July 14, 2026
SPY's implied volatility closed Monday at 13.98%, sitting right on its one-year median. Its one-year IV rank read 20, low enough to look like a floor. Shorten the lookback to one month and the same vol reads 44. Nothing changed but the window you measured against, and the lower, floor-looking number is the one most platforms show by default.
IV rank is a position in a range: today's vol, minus the one-year low, over the high minus the low. It leans on two days, the year's highest and lowest prints. IV percentile is far less sensitive to them, counting the share of days that closed at or below today. SPY's percentile is 47, a full 27 points above its rank on the same number.
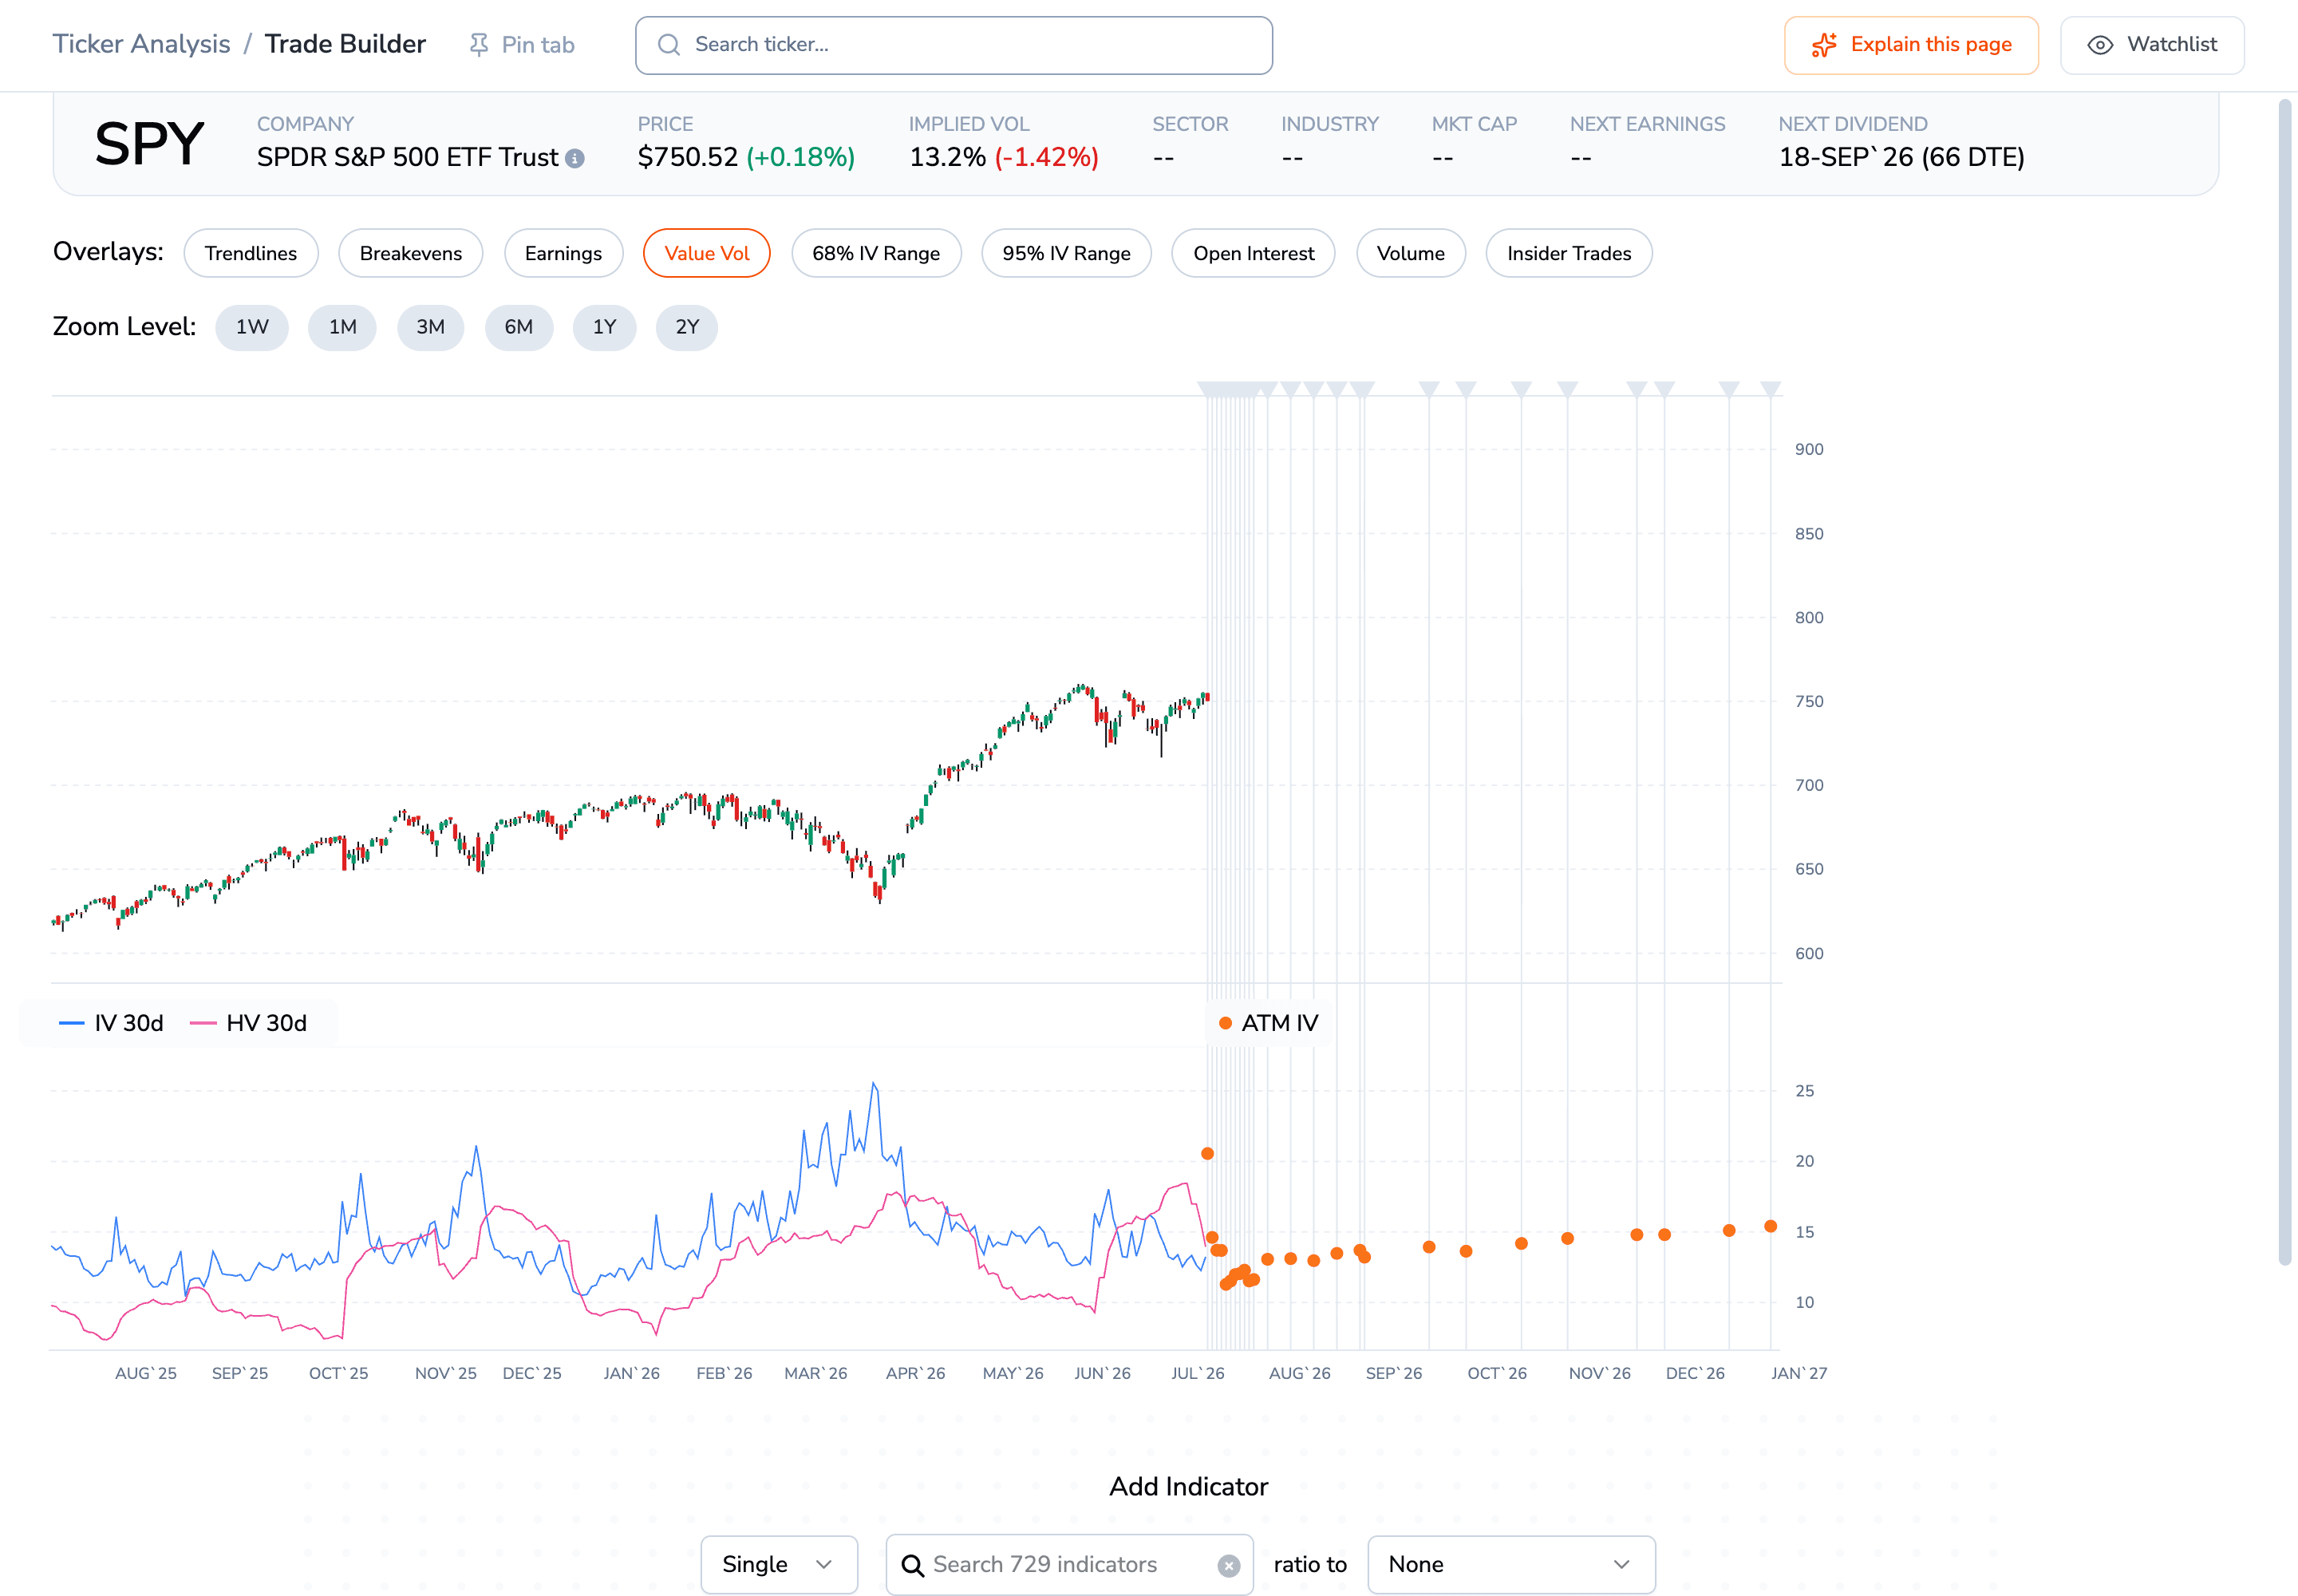
SPY's IV 30d (blue) spiked near 25% in late March, then ground through the teens; that lone March peak sets the one-year rank's ceiling. Source: ORATS /datav2/hist/summaries, live.
Change the window and the floor moves
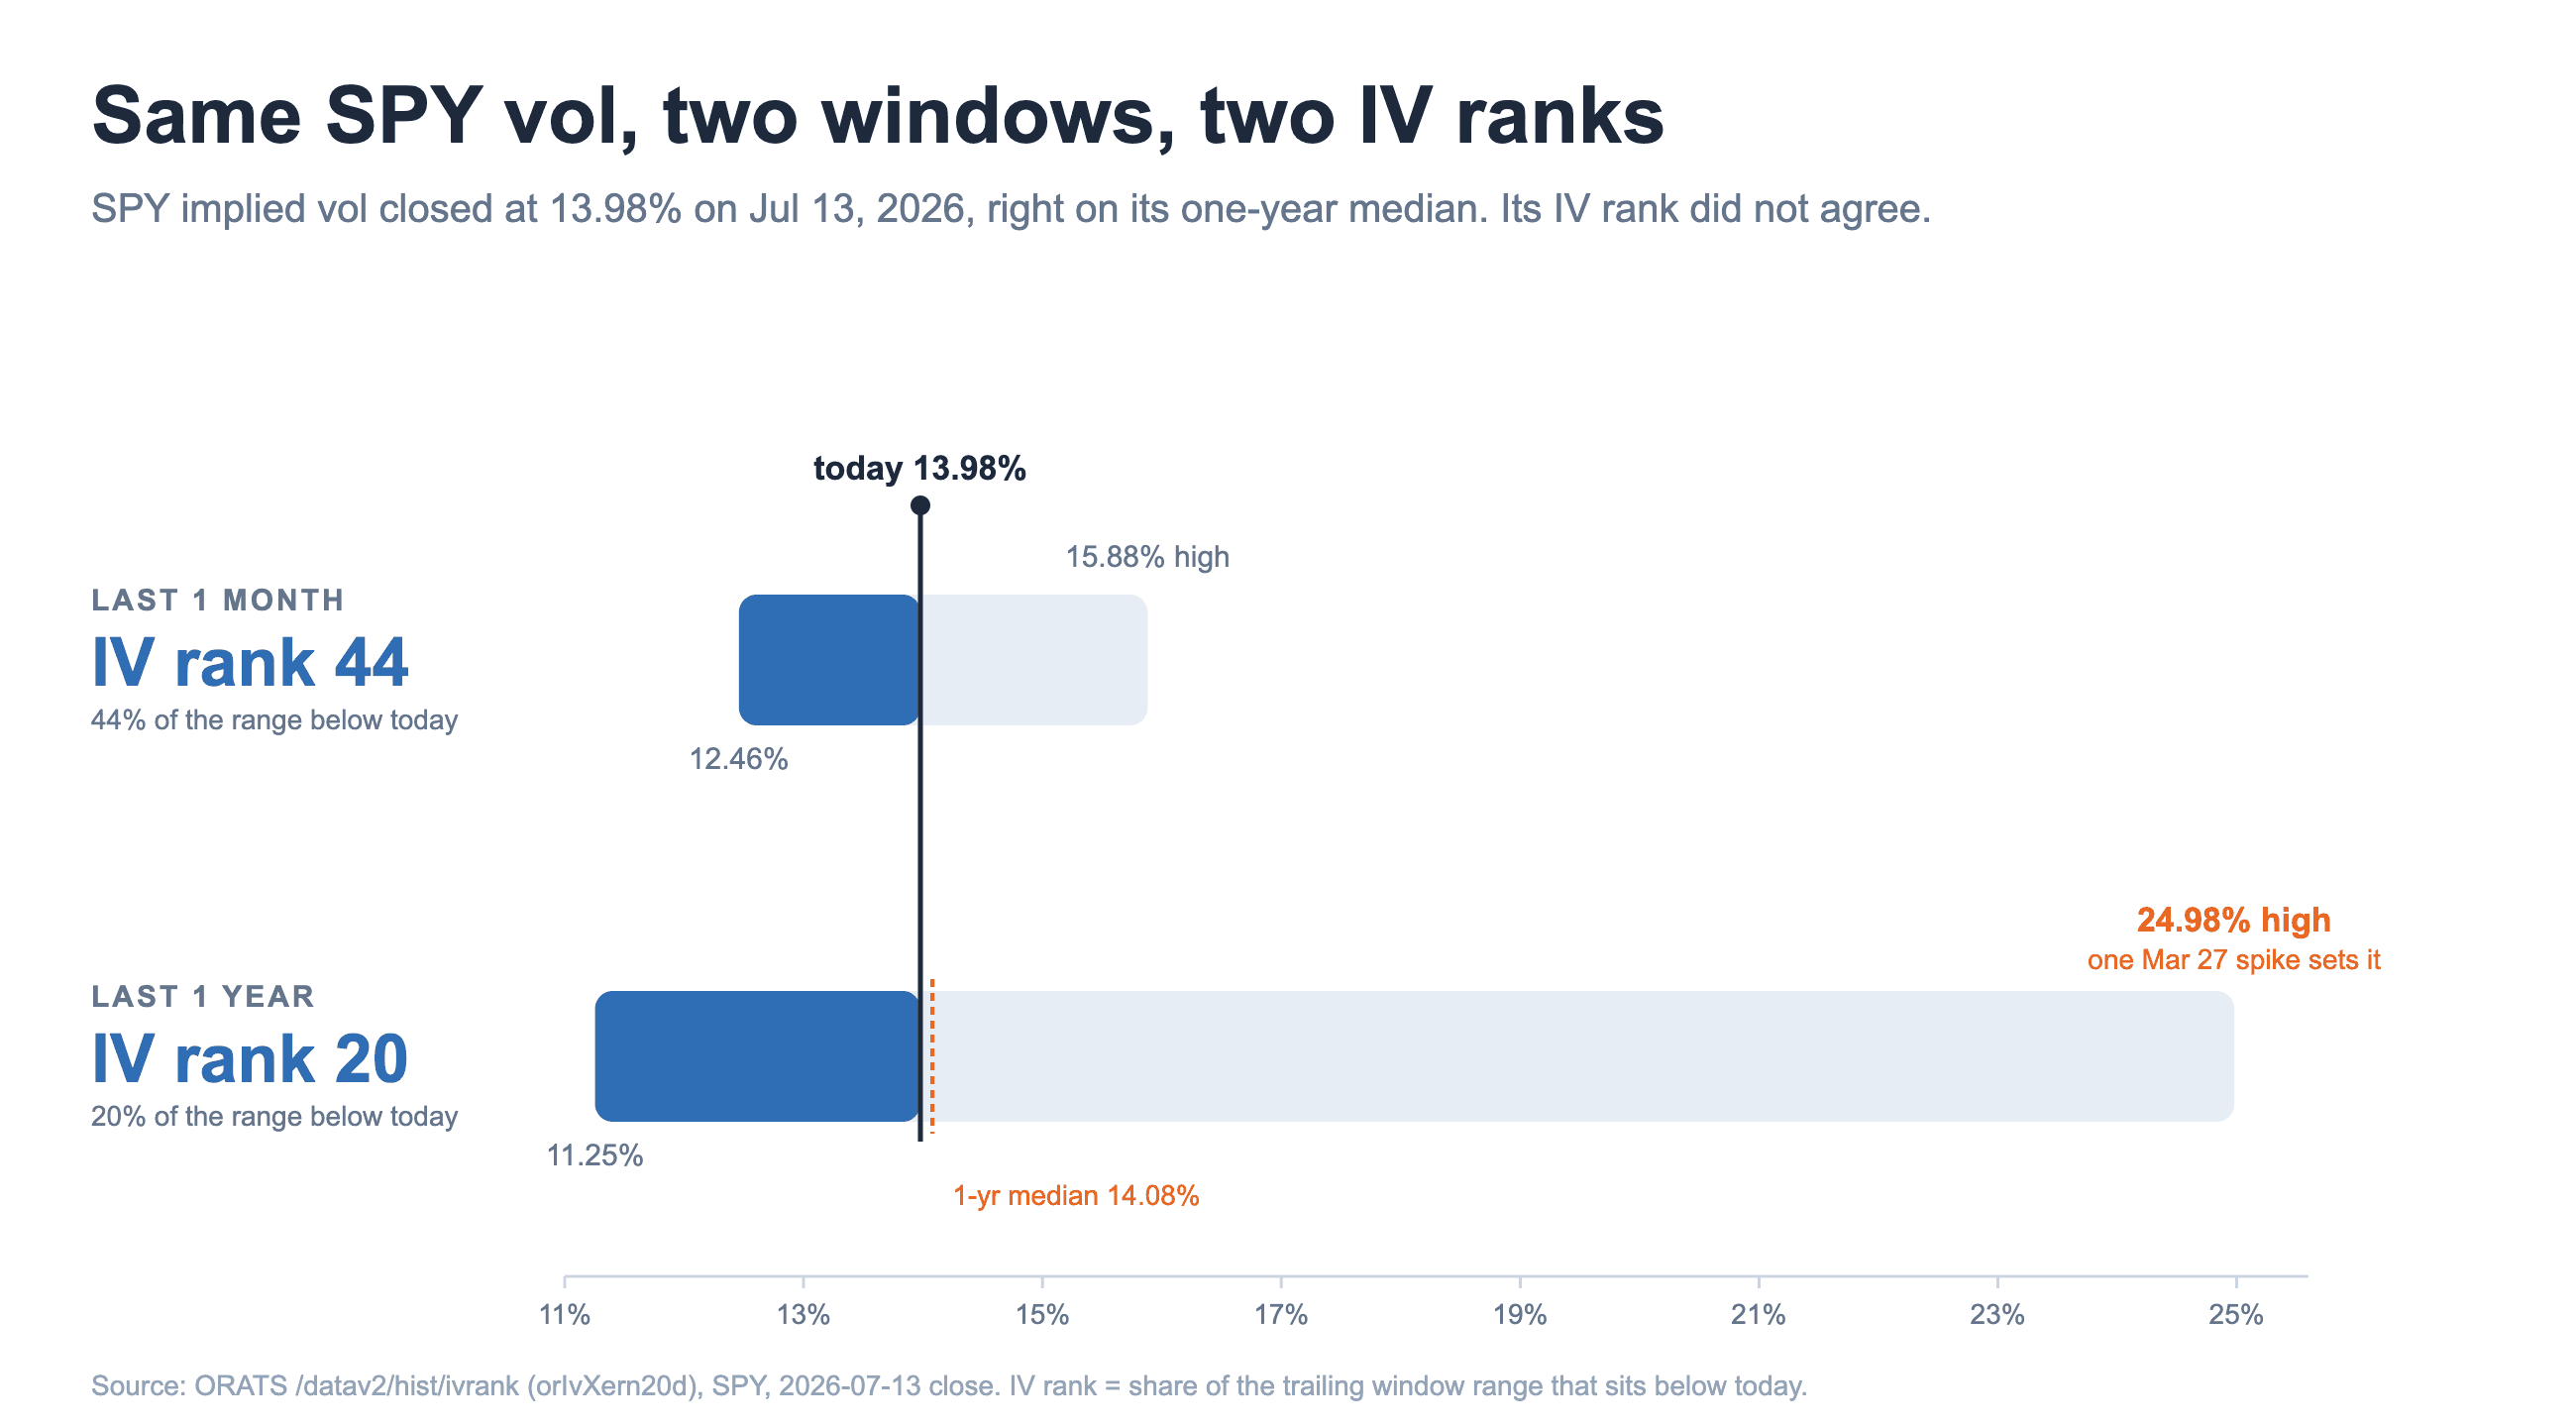
The same 13.98% vol fills 44% of SPY's one-month range but only 20% of its one-year range, which runs to a 24.98% March spike. Source: ORATS /datav2/hist/ivrank.
The window, not the vol, decides the answer. SPY's one-year range runs from 11.25% up to that 24.98% March spike, so 13.98% fills just 20% of it. The spike is 72 sessions back. Drop to a one-month window and it falls out of view: the range tops at 15.88%, and 13.98% now fills 44%.
That ceiling is fragile: swap it from the single highest print to the 90th-percentile day of the year (18.0%) and the rank jumps from 20 to 40. Percentile barely reacts: delete the ten highest days and it moves from 47 to 49. A vol reading sitting on the year's median passes for a floor.
The default read shows you the low number
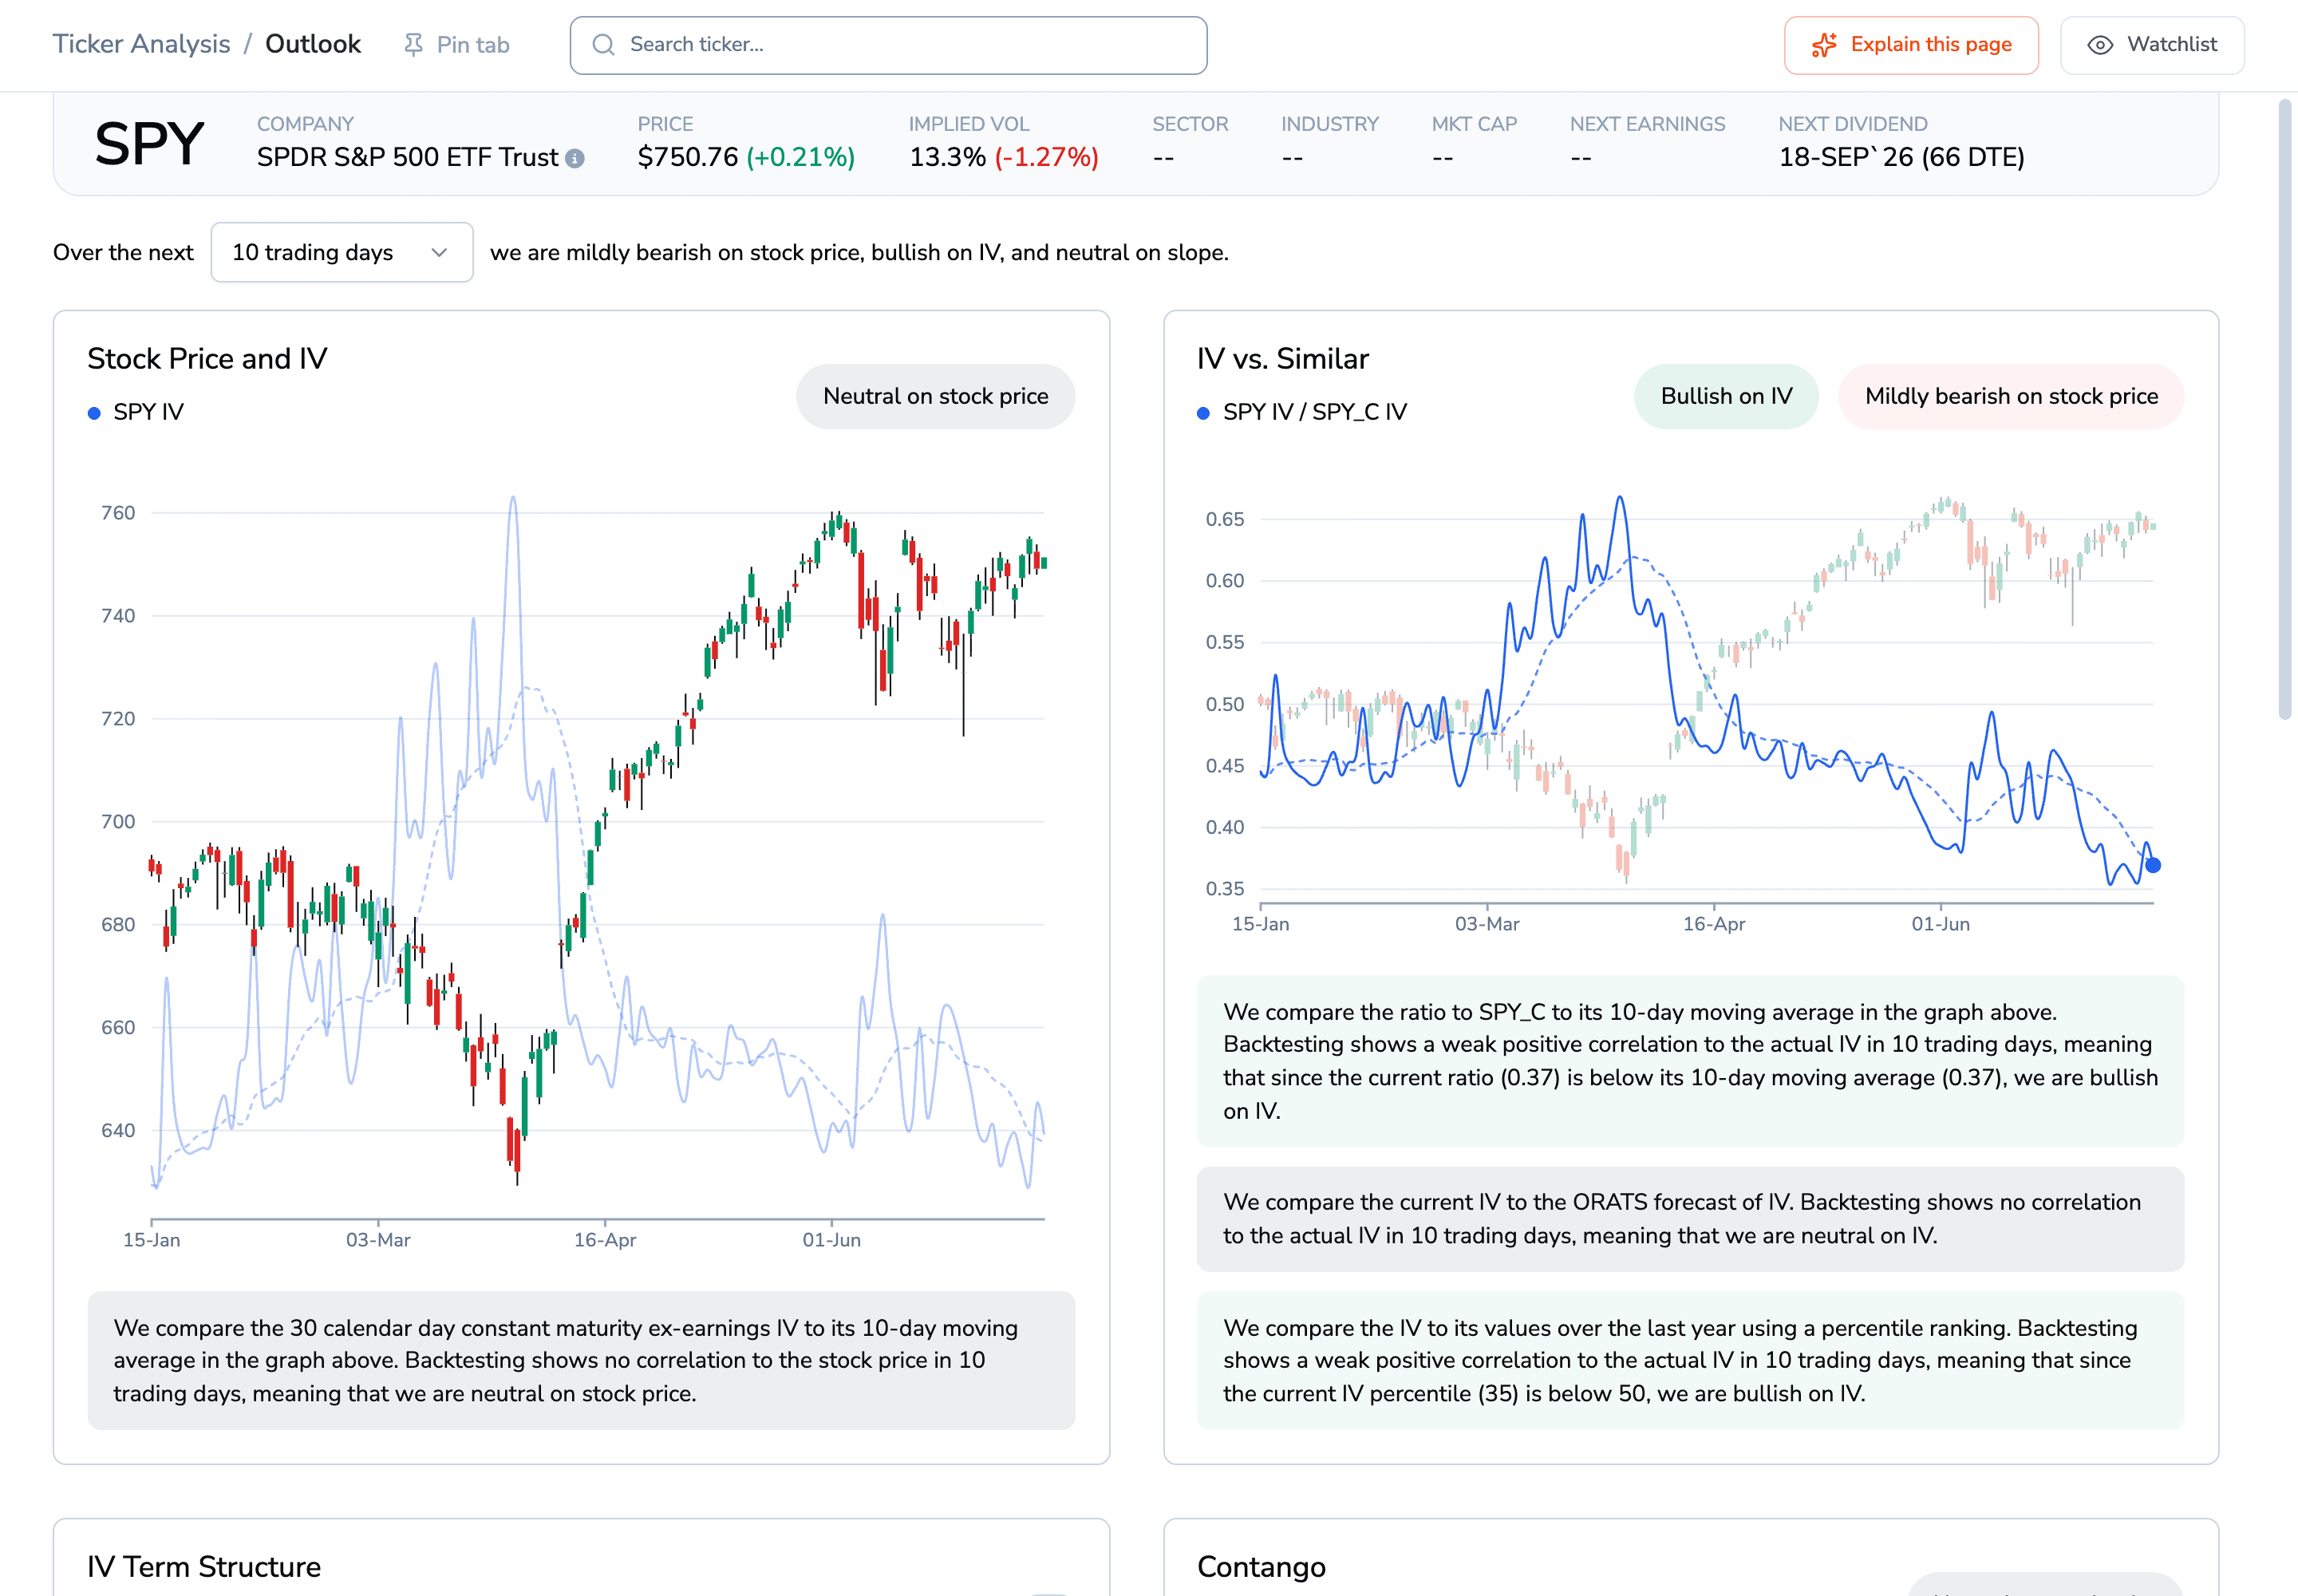
The Outlook reads SPY's vol as low in its one-year distribution, tagging it "bullish on IV" off an IV percentile below 50. Source: ORATS /datav2/hist/ivrank, live.
Glance only at the rank and you catch the 20 while three other gauges disagree: percentile 47 (near the mid-30s live Tuesday), one-month rank 44, and implied vol pinned between trailing realized (0.98x) and forward forecast (1.06x). Percentile depends on your window too; only that forecast ratio ignores the lookback, and it reads fair. All three say mid-cycle, not a floor.
Why the misread matters this week
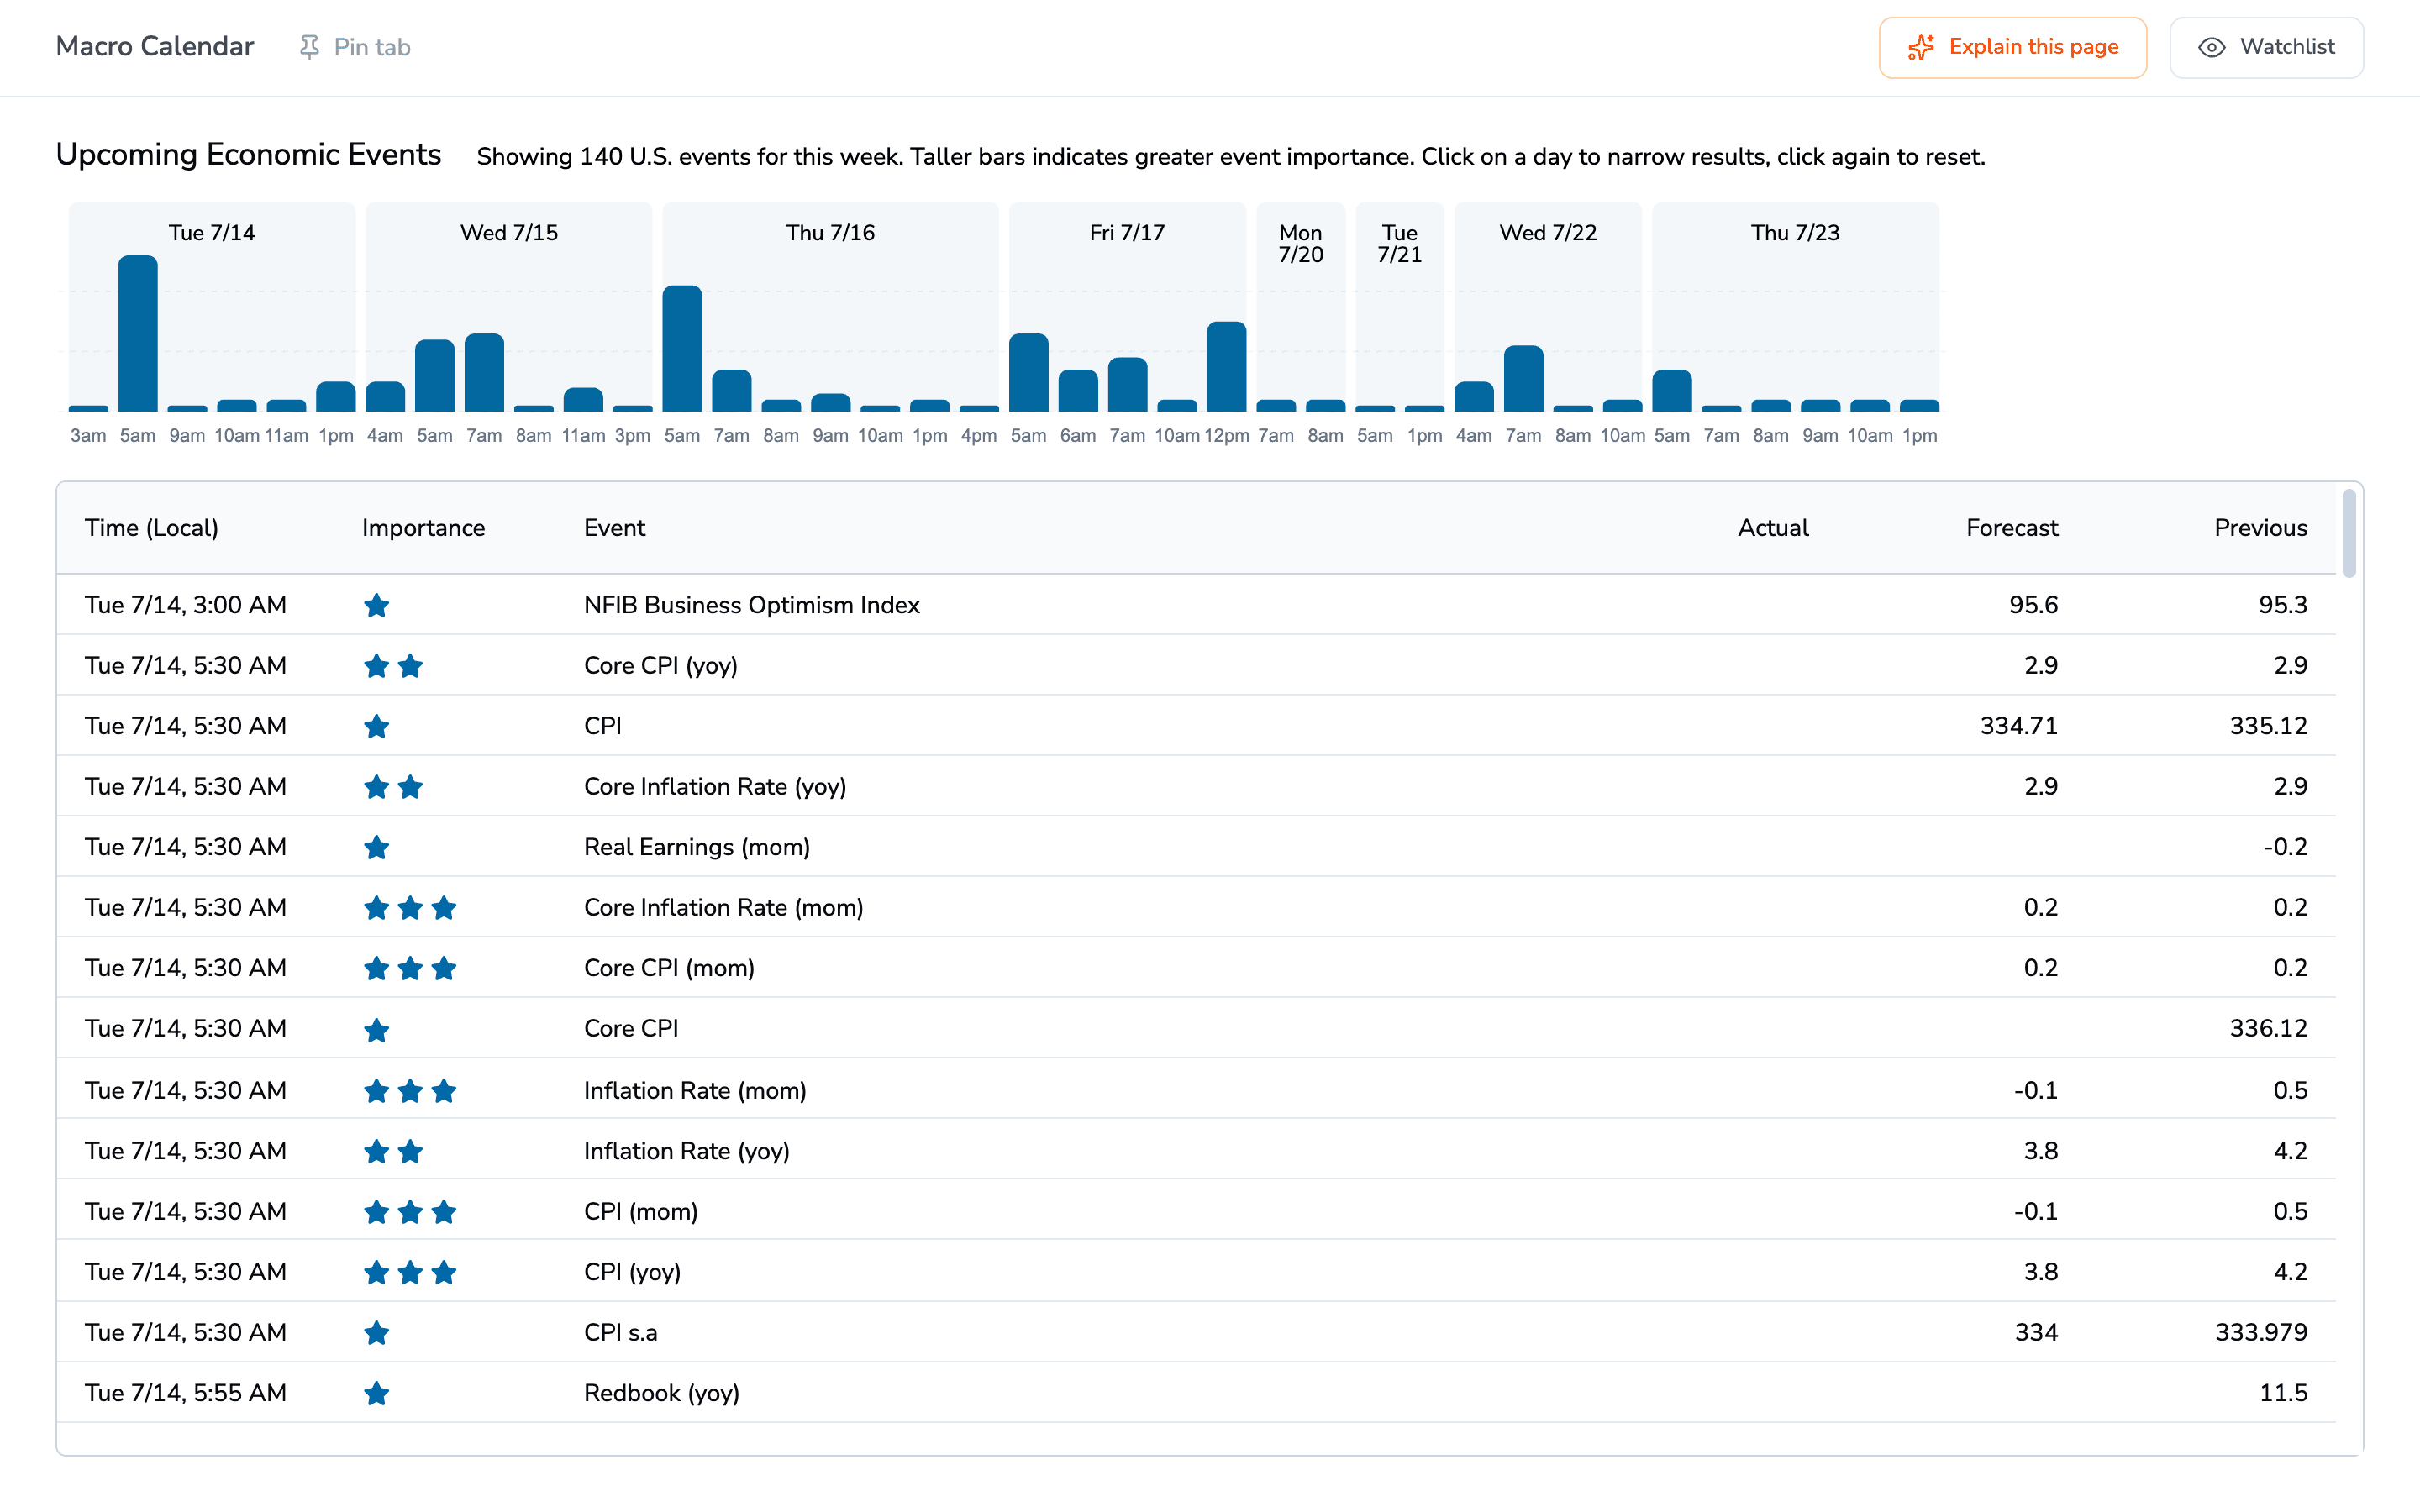
June CPI headlines the calendar Tuesday, its year-over-year print three-star rated at 8:30 AM ET with a 3.8% forecast against a 4.2% prior. Source: ORATS Macro Calendar, live.
SPY carried that rank into Tuesday's cooler-than-expected June CPI print and a wall of megabank earnings, JPMorgan and Goldman among them. Read "IV rank 20" and you would call index vol dirt cheap into two live catalysts. It is trading close to fair.
The same split shows up index-wide, and it is not permanent: the S&P 500 index (rank 19, percentile 50) and the Dow (18 and 44) carry it now, each anchored to the same March spike that rolls out of the one-year window next spring.
Before you call S&P 500 vol cheap, check which day your rank is anchored to, and which window it measures. Rank measures how far vol sits from the year's panic high, while percentile measures whether it is full versus a normal day, the question most premium sellers think rank answers. Pull up SPY in the ORATS Outlook, read the two side by side, then shorten the window and watch the floor move.
$SPY $SPX $DIA
#ImpliedVolatility #IVRank #IVPercentile #VolatilityTrading #OptionsTrading
Disclaimer:
The opinions and ideas presented herein are for informational and educational purposes only and should not be construed to represent trading or investment advice tailored to your investment objectives. You should not rely solely on any content herein and we strongly encourage you to discuss any trades or investments with your broker or investment adviser, prior to execution. None of the information contained herein constitutes a recommendation that any particular security, portfolio, transaction, or investment strategy is suitable for any specific person. Option trading and investing involves risk and is not suitable for all investors.
All opinions are based upon information and systems considered reliable, but we do not warrant the completeness or accuracy, and such information should not be relied upon as such. We are under no obligation to update or correct any information herein. All statements and opinions are subject to change without notice.
Past performance is not indicative of future results. We do not, will not and cannot guarantee any specific outcome or profit. All traders and investors must be aware of the real risk of loss in following any strategy or investment discussed herein.
Owners, employees, directors, shareholders, officers, agents or representatives of ORATS may have interests or positions in securities of any company profiled herein. Specifically, such individuals or entities may buy or sell positions, and may or may not follow the information provided herein. Some or all of the positions may have been acquired prior to the publication of such information, and such positions may increase or decrease at any time. Any opinions expressed and/or information are statements of judgment as of the date of publication only.
Day trading, short term trading, options trading, and futures trading are extremely risky undertakings. They generally are not appropriate for someone with limited capital, little or no trading experience, and/ or a low tolerance for risk. Never execute a trade unless you can afford to and are prepared to lose your entire investment. In addition, certain trades may result in a loss greater than your entire investment. Always perform your own due diligence and, as appropriate, make informed decisions with the help of a licensed financial professional.
Commissions, fees and other costs associated with investing or trading may vary from broker to broker. All investors and traders are advised to speak with their stock broker or investment adviser about these costs. Be aware that certain trades that may be profitable for some may not be profitable for others, after taking into account these costs. In certain markets, investors and traders may not always be able to buy or sell a position at the price discussed, and consequently not be able to take advantage of certain trades discussed herein.
Be sure to read the OCCs Characteristics and Risks of Standardized Options to learn more about options trading.
Related Posts