Backtesting
Tuesday, July 25th 2023
Unleash Your Investment Potential with the new ORATS Backtester
Sort, filter, and rank millions of options backtests. Designed to help you make more informed trading decisions.
Summary
ORATS Backtester is a comprehensive tool for backtesting investment strategies against historical data. With millions of backtests per symbol, the tool offers a wide variety of strategies, including bullish, bearish, and neutral, and complex strategies like iron condors and calendar spreads. The backtests come equipped with 37 different performance metrics like P&L per day average and Sharpe ratio, and users can filter, sort, and rank them to find the ones that match their investment strategy and risk appetite. The tool's data visualization capabilities make it easier to interpret complex backtest data.
Introduction
In the world of investment strategies, backtesting is not a mere convenience—it's a necessity. This statistical process allows investors to test their trading strategies against historical data, enabling them to improve their strategies and increase potential returns. But how can one efficiently sift through, sort, and gain insights from a colossal number of backtests? Enter the ORATS Backtester. With millions of backtests per symbol, covering all types of strategies, our tool offers a comprehensive testing ground to fine-tune your investment approach.

Unraveling the Power of Backtests
The Backtester is not your run-of-the-mill tool. We've gone above and beyond to provide you with backtests for several strategies - bullish, bearish, and neutral. We’ve even tested complex strategies like iron condors and calendar spreads. And we haven't skimmed on the details; we've tested thousands of combinations of days to expiration, strike deltas, and entry and exit triggers.
Moreover, each backtest comes equipped with 37 different performance metrics categorized into four distinct areas: Return, Risk, Profit & Loss, and Other. This vast array of metrics ensures a comprehensive analysis, so you're armed with the most relevant information to make informed decisions.
The tool allows for testing the backtest by isolating similar types of trading strategies for the user to build confidence in the future performance of the backtest.
Once you find a backtest you like, you can add it to your favorites so that you can easily access it later.
Filtering the Backtests
Navigating through millions of backtests may seem overwhelming, but fear not. Our backtester allows you to filter the tests based on a broad range of entry criteria, such as VIX levels, Simple Moving Average (SMA), 14-day RSI, IV Percentile 1 year, and Slope Percentile 1 year. The backtests also include various stop losses and profit targets. You can also filter the backtests based on performance metrics to find the ones that match your investment strategy and risk appetite.

Sorting and Ranking for Better Insights
With the Backtester, you can effortlessly sort and rank over 50,000,000 backtests. This feature comes with three unique ranking algorithms—Best overall performance, Best conservative winner, and Best return on risk or individual sorts on P&L average daily profit, Sharp, Sortino and the like. Whether you're searching for a consistent winner, a risk-adjusted return champion, or an all-rounder, our ranking algorithms can cater to your unique preferences, offering a targeted understanding of each strategy's potential effectiveness. Here’s a breakdown of each of the custom ranking algorithms:
Best overall performance: This ranking looks at the following metrics and applies the following weights: Annual Return (Overall) (33.3%), P&L % Per Day Avg. (16.6%), Sharpe Ratio (33.3%), and Sortino Ratio (16.6%).
Best conservative winner: This ranking looks at the following metrics and applies the following weights: Annual Return (Overall) (18.2%), Max Drawdown % (9%), Strategy Win Rate (9%), P&L % Per Day Avg. (18.2%), Worst Annual Return (9%), Worst Monthly Return (9%), Sharpe Ratio (9%), and Annual Sortino (18.2%).
Best return on risk: This ranking calculates the following metric: P&L % Per Day Avg. / (-1 * Average (Worst Monthly Return, Worst Annual Return, Max Drawdown %))
You may also sort the table of backtests by any performance column instead of a ranking algorithm.
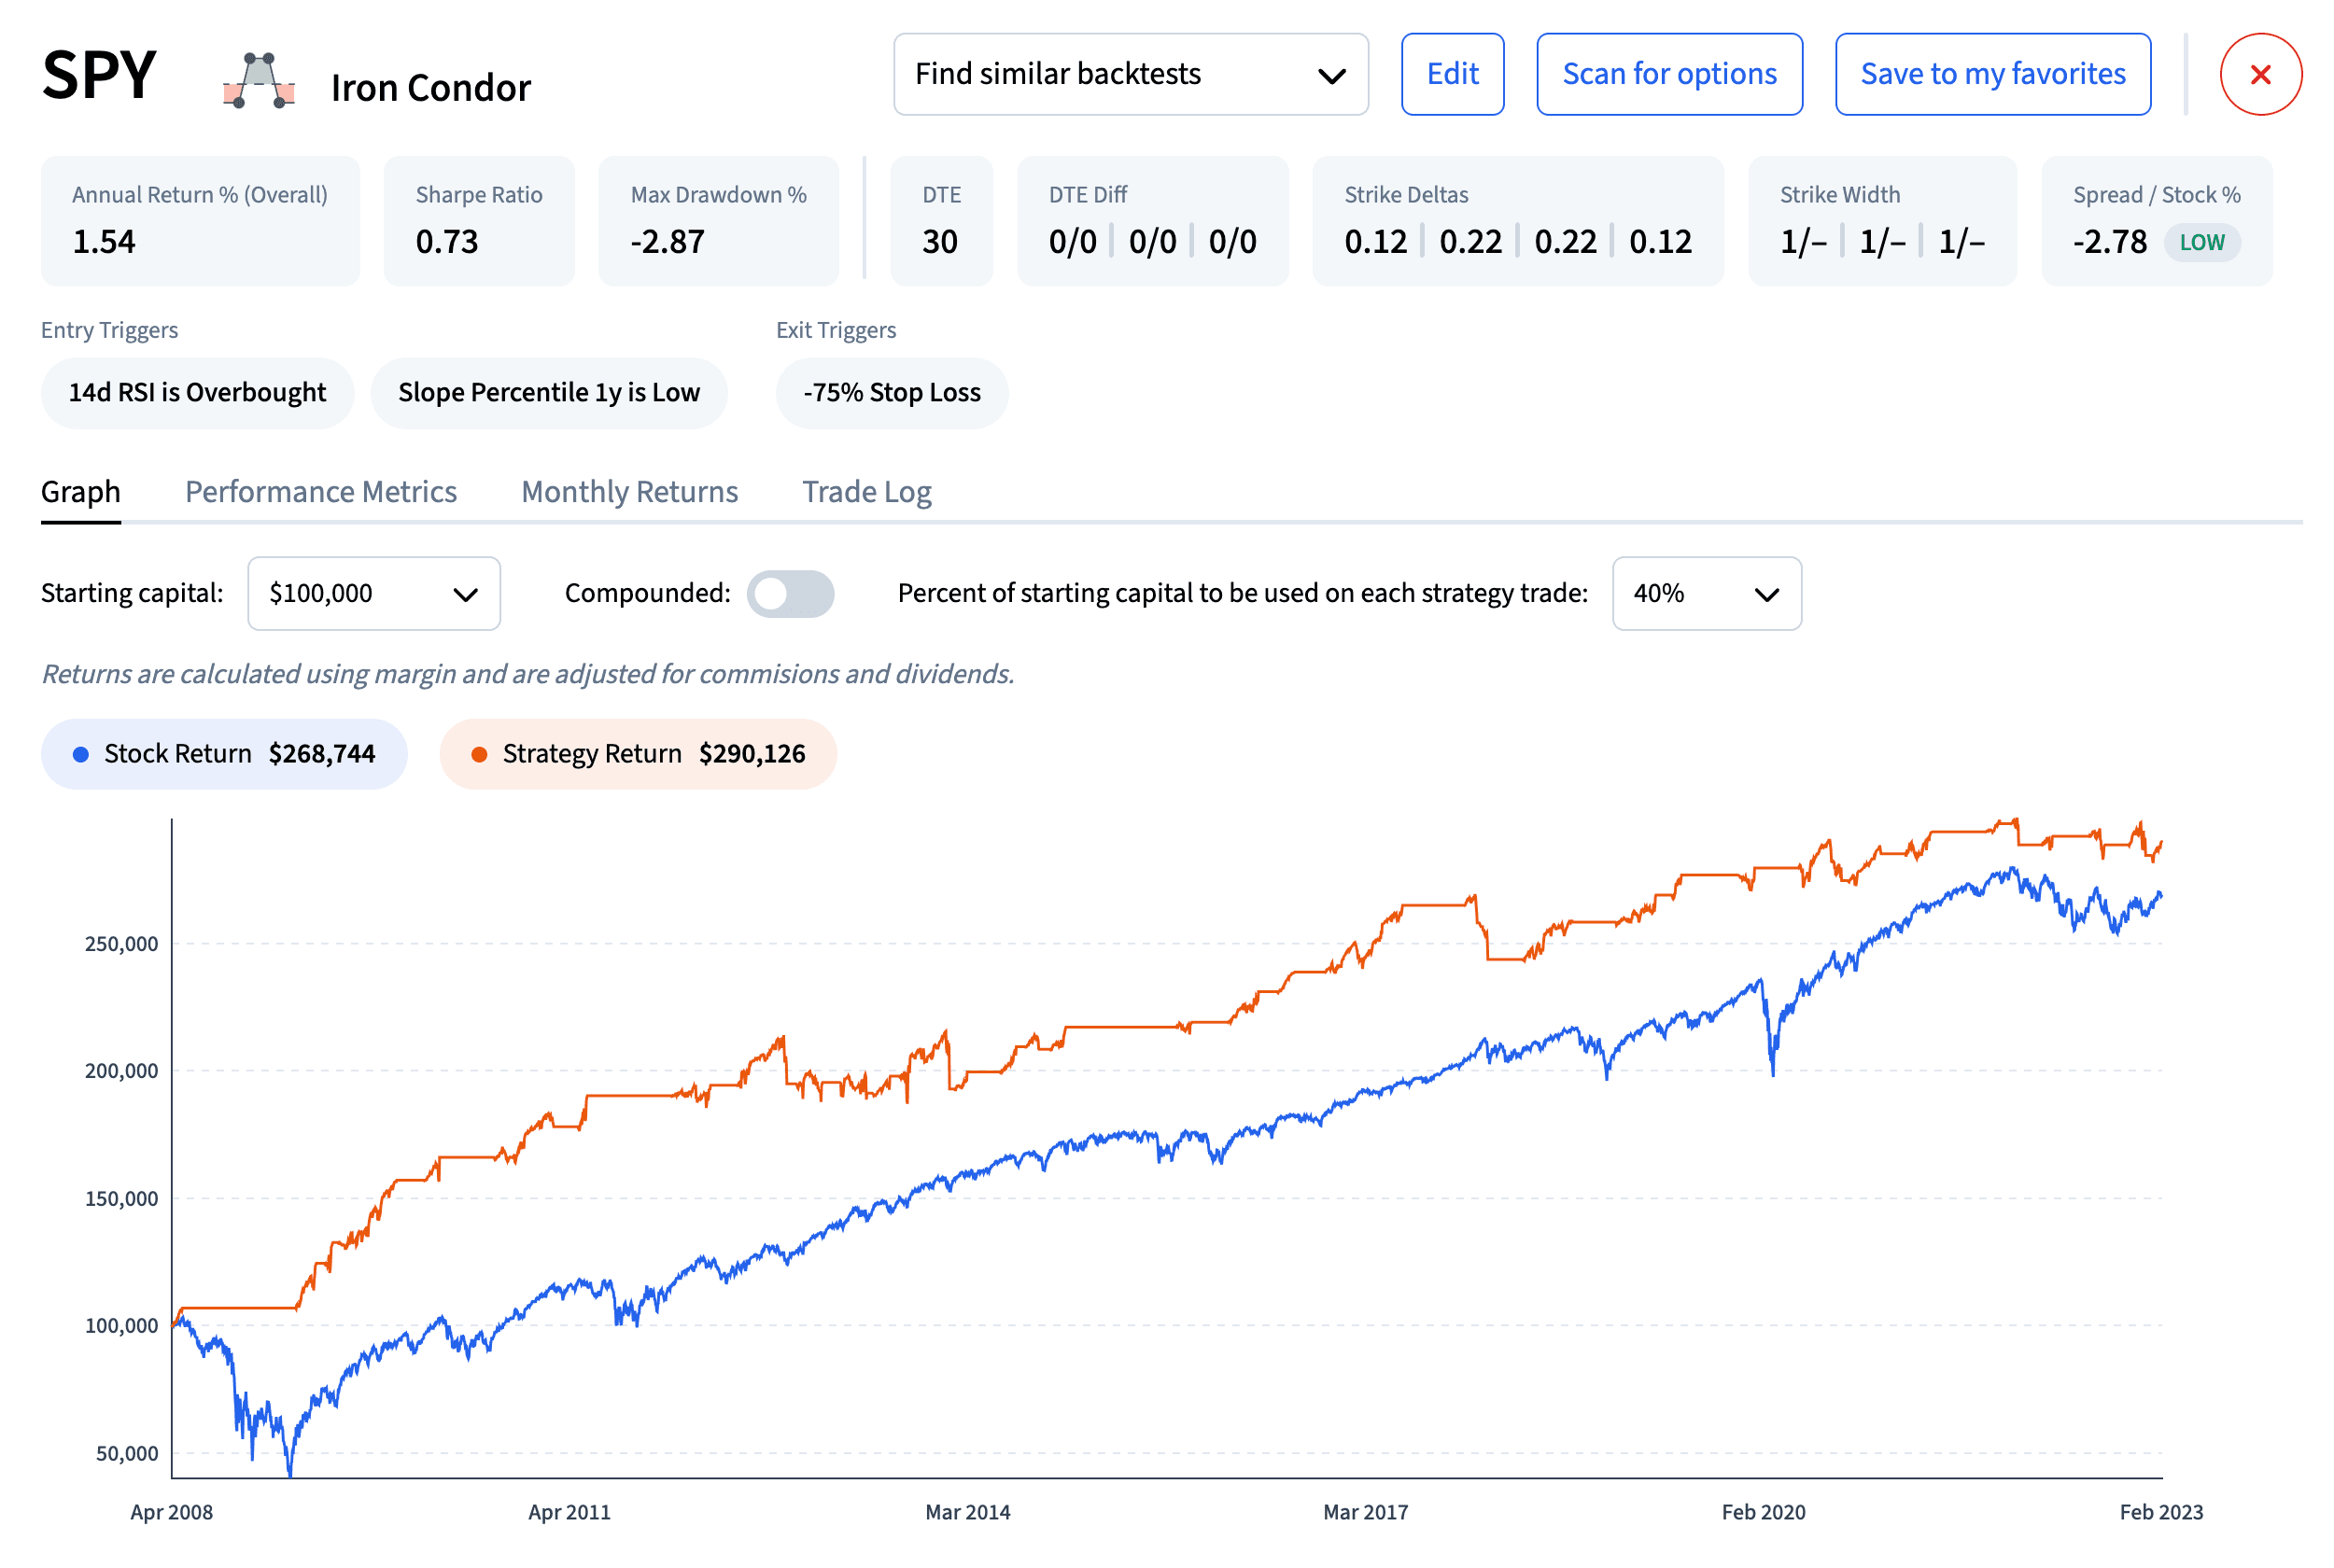
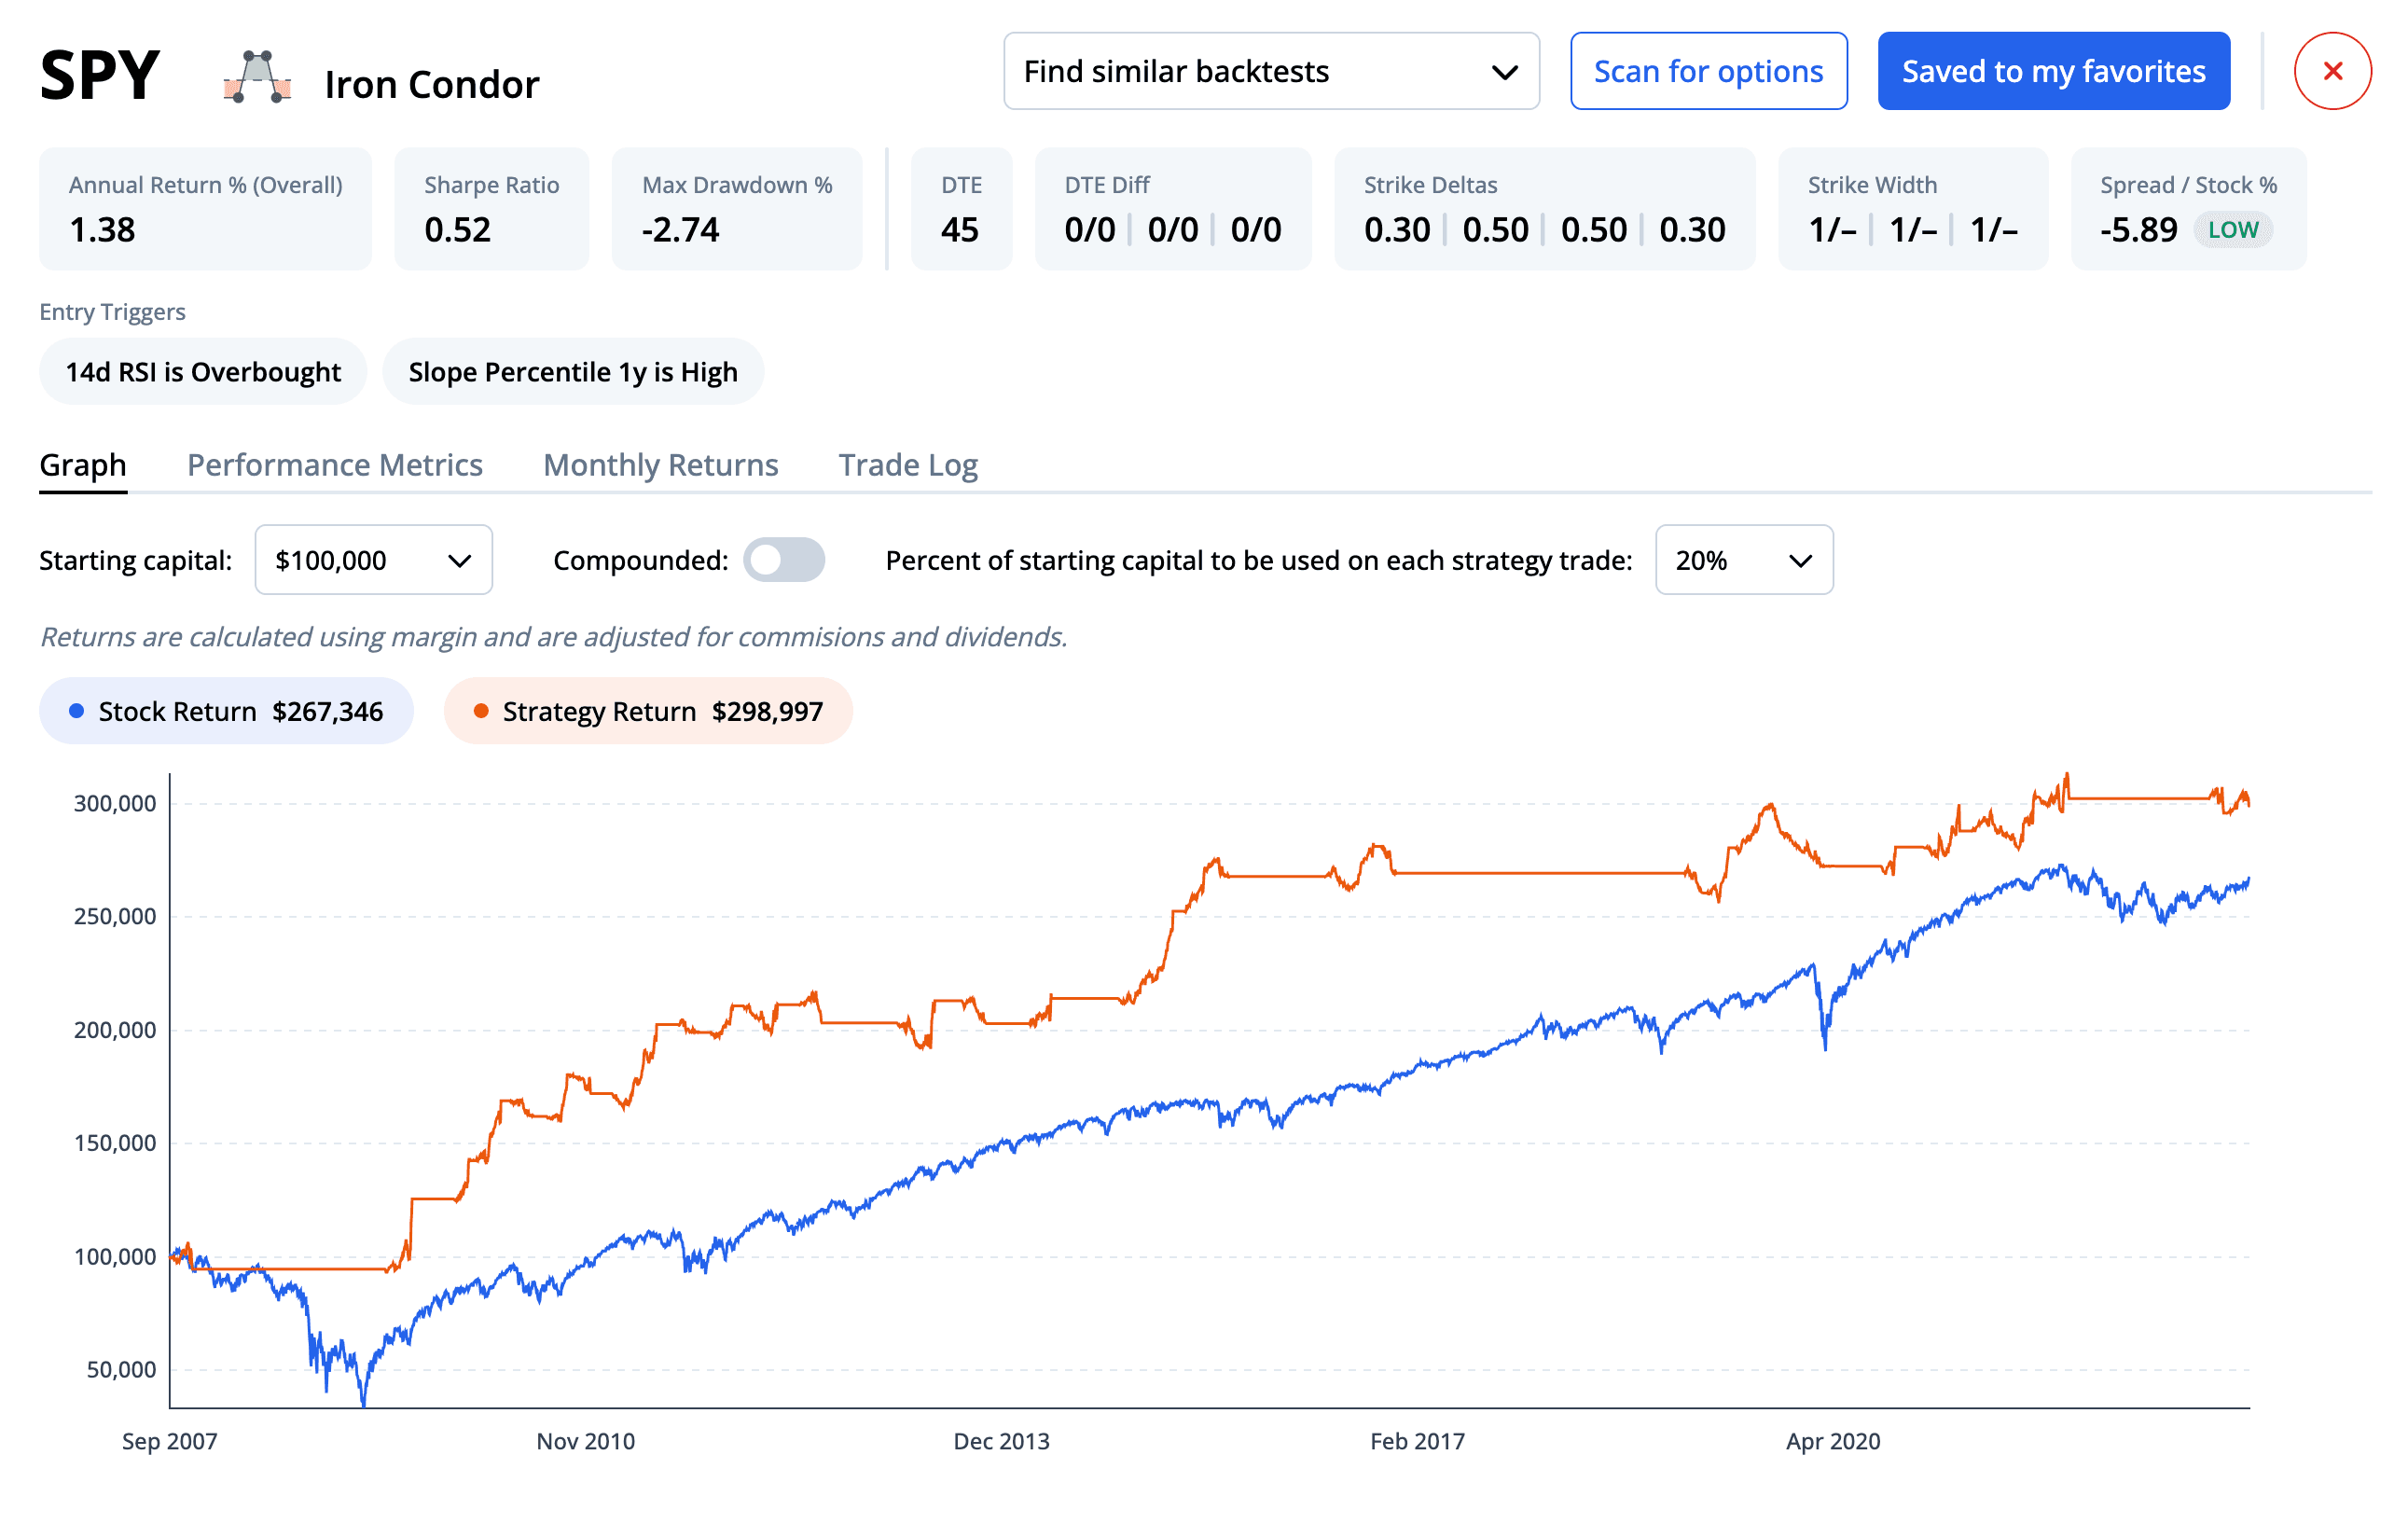
Visualizing the Backtest Data
Beyond filtering and sorting, the Backtester provides an in-depth visual representation of each backtest's data. From viewing a graph of returns, a table of monthly returns, to a detailed trade log, you have a wealth of data visualization tools at your disposal. By simplifying complex data into understandable visual formats, the backtester fosters easy interpretation and informed decision-making.
Graph of returns:

Monthly and yearly returns:

Trade log:

Conclusion
With the Backtester, evaluating and comparing countless backtests is a breeze. The tool eliminates the guesswork associated with strategy evaluation, giving you precise and accurate results instead. The ability to filter, sort, and rank backtests ensures a comprehensive understanding of potential outcomes and risks tailored to your strategy. Additionally, the tool's data visualization capabilities make it easier than ever to interpret complex backtest data.
The Backtester is more than just a tool—it's your strategic partner, enabling you to make informed investment decisions based on concrete, historical data. We encourage you to leverage the power of our Backtester and discover the wealth of insights it can offer for your investment strategies.
Disclaimer:
The opinions and ideas presented herein are for informational and educational purposes only and should not be construed to represent trading or investment advice tailored to your investment objectives. You should not rely solely on any content herein and we strongly encourage you to discuss any trades or investments with your broker or investment adviser, prior to execution. None of the information contained herein constitutes a recommendation that any particular security, portfolio, transaction, or investment strategy is suitable for any specific person. Option trading and investing involves risk and is not suitable for all investors.
All opinions are based upon information and systems considered reliable, but we do not warrant the completeness or accuracy, and such information should not be relied upon as such. We are under no obligation to update or correct any information herein. All statements and opinions are subject to change without notice.
Past performance is not indicative of future results. We do not, will not and cannot guarantee any specific outcome or profit. All traders and investors must be aware of the real risk of loss in following any strategy or investment discussed herein.
Owners, employees, directors, shareholders, officers, agents or representatives of ORATS may have interests or positions in securities of any company profiled herein. Specifically, such individuals or entities may buy or sell positions, and may or may not follow the information provided herein. Some or all of the positions may have been acquired prior to the publication of such information, and such positions may increase or decrease at any time. Any opinions expressed and/or information are statements of judgment as of the date of publication only.
Day trading, short term trading, options trading, and futures trading are extremely risky undertakings. They generally are not appropriate for someone with limited capital, little or no trading experience, and/ or a low tolerance for risk. Never execute a trade unless you can afford to and are prepared to lose your entire investment. In addition, certain trades may result in a loss greater than your entire investment. Always perform your own due diligence and, as appropriate, make informed decisions with the help of a licensed financial professional.
Commissions, fees and other costs associated with investing or trading may vary from broker to broker. All investors and traders are advised to speak with their stock broker or investment adviser about these costs. Be aware that certain trades that may be profitable for some may not be profitable for others, after taking into account these costs. In certain markets, investors and traders may not always be able to buy or sell a position at the price discussed, and consequently not be able to take advantage of certain trades discussed herein.
Be sure to read the OCCs Characteristics and Risks of Standardized Options to learn more about options trading.
Related Posts