Indicators
Thursday, February 21st 2019
Calculate Expected Implied Volatility After Earnings, A Lesson from Mom
With the earnings effect stripped out, you get a way to compare IVs over time and estimate where the implied might fall after earnings are announced and volatilities settle down.
Summary
This article discusses how to calculate expected implied volatility after earnings by stripping out the earnings effect and iterating through earnings effects until a rational term structure appears. By comparing IVs over time, you can estimate where the implied might fall after earnings are announced and volatilities settle down.
When my mom asked whether she should sell some of her GRMN (up 16% yesterday after announcing earnings), I dug deep into the equity options data to see what happened. Were there any clues in the options market where I could have identified this trade?
It turns out there were signs in Garmin's IV term structure and in daily options volume. The volume was six times normal on the day before the move and the term structure was seven times as heavily skewed higher in the front months than normal, even after adjusting for earnings.
This adjustment for earnings is the crux of calculating the expected implied volatility after earnings and seeing the underlying creep in implied that occurred in GRMN in the days before earnings were announced.

In the table above, the day before earnings were announced, option volume was 15,400 total contracts vs an average of 2500 per day and contango at -1.56 vs -0.2 average. Contango is the normal state of monthly implied volatilities when the front months are below the longer dated months. Here, a negative contango or backwardation, is a bright red flag reflecting GRMN's front month volatilities were well above the back months even after adjusting for the earnings effect in IV.
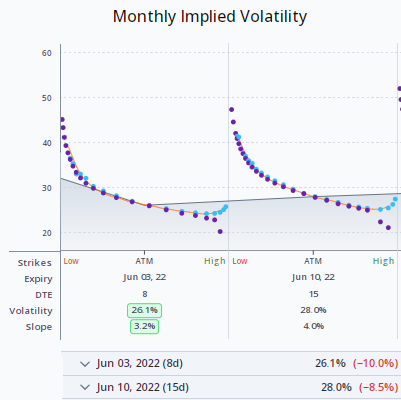
In order to get a good look at the implied volatility term structure you have to strip out the earnings effect. The earnings effect is the one day move that usually happens after the earnings announcement. That one day move has a huge effect on the IV of options with only a few days to expiration and less effect on ones with more days left before expiring.
To isolate the ex-earnings implied volatilities, the trick is to iterate through earnings effects until a rational term structure appears. Finding that rational term structure involves constructing a formula based on the square root of time that matches the historical term-structure relationships in the market (a subject of another post). With a formula to fit the monthly IV term structure, the expected implied volatility after earnings can be found by iterating earnings effects until the difference between the rational term structure and the ex-earnings implied volatilities of each month is minimized.
With the earnings effect stripped out, you get a way to compare IVs over time and estimate where the implied might fall after earnings are announced and volatilities settle down.
Disclaimer:
The opinions and ideas presented herein are for informational and educational purposes only and should not be construed to represent trading or investment advice tailored to your investment objectives. You should not rely solely on any content herein and we strongly encourage you to discuss any trades or investments with your broker or investment adviser, prior to execution. None of the information contained herein constitutes a recommendation that any particular security, portfolio, transaction, or investment strategy is suitable for any specific person. Option trading and investing involves risk and is not suitable for all investors.
All opinions are based upon information and systems considered reliable, but we do not warrant the completeness or accuracy, and such information should not be relied upon as such. We are under no obligation to update or correct any information herein. All statements and opinions are subject to change without notice.
Past performance is not indicative of future results. We do not, will not and cannot guarantee any specific outcome or profit. All traders and investors must be aware of the real risk of loss in following any strategy or investment discussed herein.
Owners, employees, directors, shareholders, officers, agents or representatives of ORATS may have interests or positions in securities of any company profiled herein. Specifically, such individuals or entities may buy or sell positions, and may or may not follow the information provided herein. Some or all of the positions may have been acquired prior to the publication of such information, and such positions may increase or decrease at any time. Any opinions expressed and/or information are statements of judgment as of the date of publication only.
Day trading, short term trading, options trading, and futures trading are extremely risky undertakings. They generally are not appropriate for someone with limited capital, little or no trading experience, and/ or a low tolerance for risk. Never execute a trade unless you can afford to and are prepared to lose your entire investment. In addition, certain trades may result in a loss greater than your entire investment. Always perform your own due diligence and, as appropriate, make informed decisions with the help of a licensed financial professional.
Commissions, fees and other costs associated with investing or trading may vary from broker to broker. All investors and traders are advised to speak with their stock broker or investment adviser about these costs. Be aware that certain trades that may be profitable for some may not be profitable for others, after taking into account these costs. In certain markets, investors and traders may not always be able to buy or sell a position at the price discussed, and consequently not be able to take advantage of certain trades discussed herein.
Be sure to read the OCCs Characteristics and Risks of Standardized Options to learn more about options trading.
Related Posts


