Indicators
Wednesday, March 6th 2019
Our Special Historical Volatility Calculation at ORATS
ORATS calculates historical volatility sometimes called statistical volatility intraday and ex-earnings and compares to implied volatility for related ETFs
Summary
ORATS calculates historical volatility from intraday data to produce accurate daily volatilities and effective forecasts of volatility for nearly 5000 US equity options. They also present ex-earnings historical volatility and ratios of implied volatility to historical volatility and related ETFs.
Setting ORATS Apart with Historical Volatility Research
Our proprietary historical volatilities are calculated from intraday data market information produce more accurate daily volatilities than traditional methods like close-to-close. From these accurate volatilities, we produce effective forecasts of volatility and other useful datasets.
Asset Coverage
ORATS covers all US equity options including stocks, ETFs, and indexes--nearly 5000 tickers. We characterize each symbol as a stock, ETF or index and we determine whether it is easy or hard to borrow and a dividend payer or not.
Historical Volatility Research
To make a forecast of a variable, one must first take measurements of it. The common methods of measuring underlying volatility are close-to-close, high-low, high-low-close and GARCH. Over many years of trading, Matt Amberson, our President, and CEO, was never satisfied with any these approaches. Based on our extensive analysis, we believe we have found the most accurate historical volatility measure available using intraday analysis. Another advantage of intraday volatility readings is that a one-day volatility can be calculated. The use of shorter term volatilities can help see a change in volatility before longer term measurements. ORATS utilizes a modified open high low close intraday volatility calculation.
Related Data Points in our API: or1dHv, or5dHv, cls5dHv
Ex-Earnings Historical Volatility
Close-to-close and ORATS intraday historical volatilities are also presented with the day of and day after earnings taken out of the calculation. These calculations are important as they can be compared over time or when analyzing a non-earnings expiration.
Related Data Point(s): xErnOr5dHv, xErncls5dHv
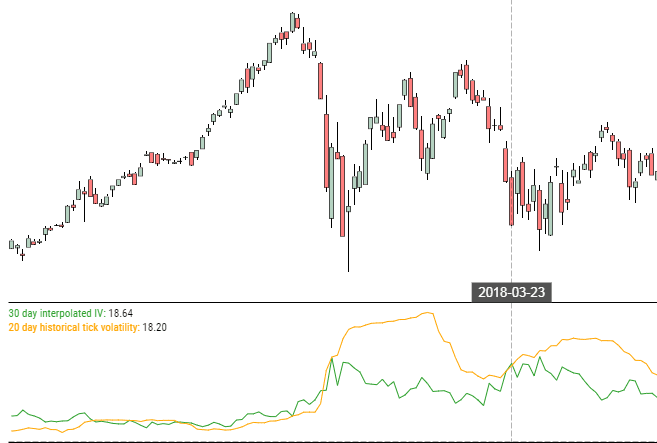
Implied Volatility & Historical Volatility Ratios
An important indicator is how the implied volatility is trading in relation to the historical volatility. ORATS presents this and another special calculation related ETF calculation. It is useful to compare that ratio to the related ETF ratio to see if the ratio is high or low.
Related Data Points from our Data API:
ivAvg1mXErnHvRatio = IV 30-day / HV20xErn Ratio current vs monthly average
ivAvg1yXErnHvRatio= IV 30-day / HV20xErn Ratio current vs yearly average
ivStdev1yHvXErnRatio= Stdev of IV 30-day / HV20xErn Ratio current vs monthly average
etfIvXErnHvRatio= IV 30-day / HV20xErn Ratio divided by ETF IV 30-day / HV20d ratio
etfIvAvg1mHvXErnRatio= IV 30-day / HV20xErn Ratio divided by ETF IV 30-day / HV20d ratio month average
etfIvAvg1yHvXErnRatio= IV 30-day / HV20xErn Ratio divided by ETF IV 30-day / HV20d ratio year average
etfIvStdev1yXErnHvRatio= Stdev of IV 30-day / HV20xErn Ratio divided by ETF IV 30-day / HV20d ratio year average
Disclaimer:
The opinions and ideas presented herein are for informational and educational purposes only and should not be construed to represent trading or investment advice tailored to your investment objectives. You should not rely solely on any content herein and we strongly encourage you to discuss any trades or investments with your broker or investment adviser, prior to execution. None of the information contained herein constitutes a recommendation that any particular security, portfolio, transaction, or investment strategy is suitable for any specific person. Option trading and investing involves risk and is not suitable for all investors.
All opinions are based upon information and systems considered reliable, but we do not warrant the completeness or accuracy, and such information should not be relied upon as such. We are under no obligation to update or correct any information herein. All statements and opinions are subject to change without notice.
Past performance is not indicative of future results. We do not, will not and cannot guarantee any specific outcome or profit. All traders and investors must be aware of the real risk of loss in following any strategy or investment discussed herein.
Owners, employees, directors, shareholders, officers, agents or representatives of ORATS may have interests or positions in securities of any company profiled herein. Specifically, such individuals or entities may buy or sell positions, and may or may not follow the information provided herein. Some or all of the positions may have been acquired prior to the publication of such information, and such positions may increase or decrease at any time. Any opinions expressed and/or information are statements of judgment as of the date of publication only.
Day trading, short term trading, options trading, and futures trading are extremely risky undertakings. They generally are not appropriate for someone with limited capital, little or no trading experience, and/ or a low tolerance for risk. Never execute a trade unless you can afford to and are prepared to lose your entire investment. In addition, certain trades may result in a loss greater than your entire investment. Always perform your own due diligence and, as appropriate, make informed decisions with the help of a licensed financial professional.
Commissions, fees and other costs associated with investing or trading may vary from broker to broker. All investors and traders are advised to speak with their stock broker or investment adviser about these costs. Be aware that certain trades that may be profitable for some may not be profitable for others, after taking into account these costs. In certain markets, investors and traders may not always be able to buy or sell a position at the price discussed, and consequently not be able to take advantage of certain trades discussed herein.
Be sure to read the OCCs Characteristics and Risks of Standardized Options to learn more about options trading.
Related Posts