Indicators
Friday, August 30th 2019
Put-Call Skew Dips in Coincidence with Market Rallies
Large dips in put call slope coincided with market rallies.
Summary
Large dips in put-call slope have coincided with market rallies three times since mid 2017. Buying calls and selling puts applies pressure on market makers to adjust put vs call prices down, which moves the relative implied volatilities of puts to calls lower. ORATS offers a new Wheel product that can test technical indicators, like slope, and resulting returns from holding stock.
Over the last couple of years, the put-call skew has coincided with market rallies. Three times since mid 2017, when the put-call skew dipped precipitously, the market has rallied.
Below, we highlight January 8th 2018, December 19th 2018, and June 3rd 2019 as valleys in the put-call skew and commensurate rallies in the market.
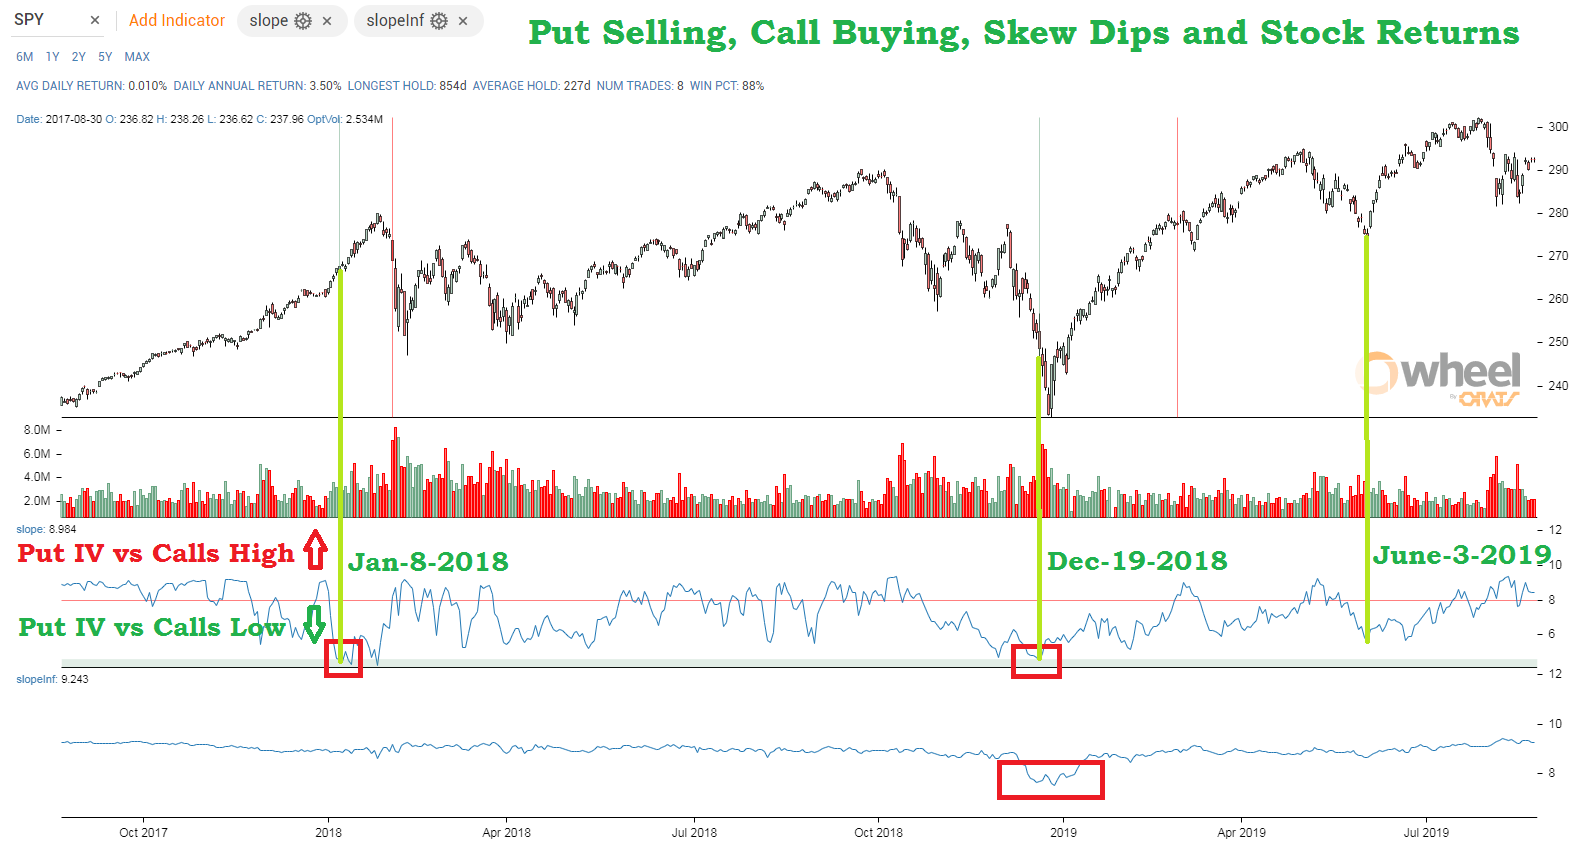
Buying calls and selling puts applies pressure on the market makers to adjust the put vs call prices down. This moves the relative implied volatilities of the puts to the calls lower.
At ORATS, we communicate the put-call implied volatility skew as "slope" and graph it above. In the bottom part of the graph, "slopeInf" corresponds to the longer-term options' slope.
The skew in the implied volatility between low strikes and high strikes, that is almost always higher for the low strikes, is presented as the percentage that the 10 delta lower strike is greater than the higher strike. For example, if the at-the-money strike 50 delta call strike is a 10.0% IV and the lower strike 60 call delta is a 10.8% IV, then the slope would be 8%.
The average slope for SPY since mid 2017 has been 7.5%. Only twice did the slope dip below 4.6% in that time, on January 8th 2018 and December 19th 2018. The slope went down to 5.6% on June 3rd 2019. Each one of those dates was a good time to own the underlying.
The graph is a new ORATS Wheel product offering that can test technical indicators, like slope, and the resulting returns from holding stock.
For example, you are able to set min and max levels of the indicator where the stock trade will be entered, and set a min max where exited. In the graph, the green band represents the entry min max of 0.1 to 4.6. This means every time the indicator is in this band a trade will be initiated and held until the exit min max is violated.
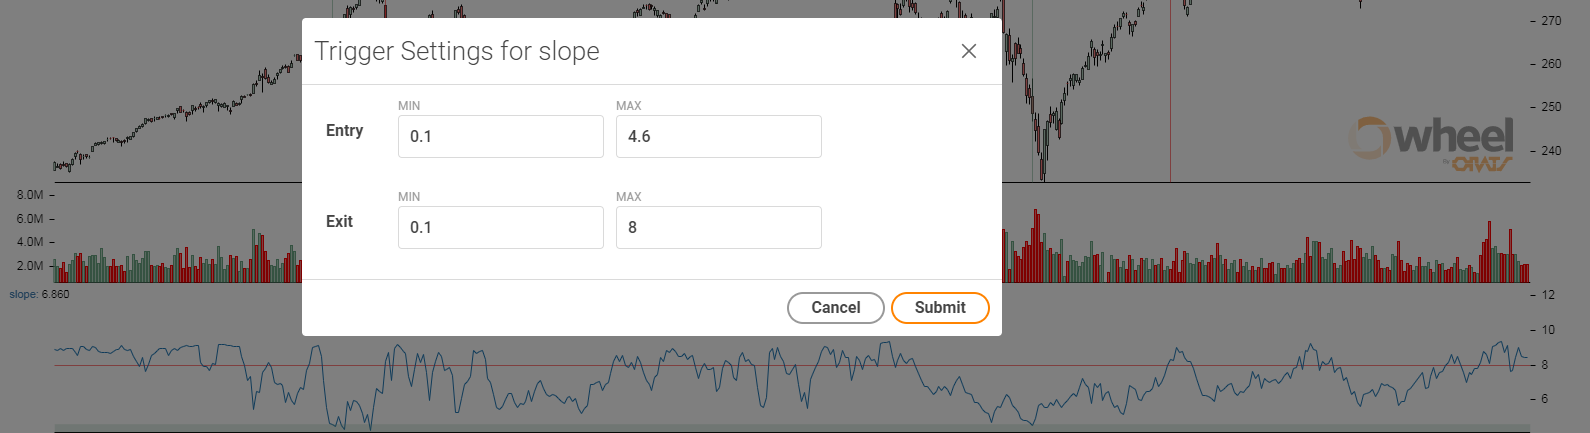
The results of the trigger settings above are:
AVG DAILY RETURN: 0.010% DAILY ANNUAL RETURN: 3.50% LONGEST HOLD: 854d AVERAGE HOLD: 227d NUM TRADES: 8 WIN PCT: 88%
If you would like to try the Beta version of the Trigger Grapher, please email mike@orats.com
More reading HERE
Disclaimer:
The opinions and ideas presented herein are for informational and educational purposes only and should not be construed to represent trading or investment advice tailored to your investment objectives. You should not rely solely on any content herein and we strongly encourage you to discuss any trades or investments with your broker or investment adviser, prior to execution. None of the information contained herein constitutes a recommendation that any particular security, portfolio, transaction, or investment strategy is suitable for any specific person. Option trading and investing involves risk and is not suitable for all investors.
All opinions are based upon information and systems considered reliable, but we do not warrant the completeness or accuracy, and such information should not be relied upon as such. We are under no obligation to update or correct any information herein. All statements and opinions are subject to change without notice.
Past performance is not indicative of future results. We do not, will not and cannot guarantee any specific outcome or profit. All traders and investors must be aware of the real risk of loss in following any strategy or investment discussed herein.
Owners, employees, directors, shareholders, officers, agents or representatives of ORATS may have interests or positions in securities of any company profiled herein. Specifically, such individuals or entities may buy or sell positions, and may or may not follow the information provided herein. Some or all of the positions may have been acquired prior to the publication of such information, and such positions may increase or decrease at any time. Any opinions expressed and/or information are statements of judgment as of the date of publication only.
Day trading, short term trading, options trading, and futures trading are extremely risky undertakings. They generally are not appropriate for someone with limited capital, little or no trading experience, and/ or a low tolerance for risk. Never execute a trade unless you can afford to and are prepared to lose your entire investment. In addition, certain trades may result in a loss greater than your entire investment. Always perform your own due diligence and, as appropriate, make informed decisions with the help of a licensed financial professional.
Commissions, fees and other costs associated with investing or trading may vary from broker to broker. All investors and traders are advised to speak with their stock broker or investment adviser about these costs. Be aware that certain trades that may be profitable for some may not be profitable for others, after taking into account these costs. In certain markets, investors and traders may not always be able to buy or sell a position at the price discussed, and consequently not be able to take advantage of certain trades discussed herein.
Be sure to read the OCCs Characteristics and Risks of Standardized Options to learn more about options trading.
Related Posts