Indicators
Wednesday, May 22nd 2019
Volatility Skew and Buckets
Volatility skew can be broken down to delta buckets. Slope and derivative can also help identify over or underpriced areas of the implied volatility surface.
Summary
Volatility skew can be analyzed by breaking it down into delta buckets, which can help identify over or undervalued areas of the implied volatility surface. Comparing parameters to history, related stocks, or ETFs can also provide insight into overpriced areas. ORATS breaks down each expiration into 21 volatility buckets from 100 delta to 0 delta every 5 deltas, which can be tracked using their Monies part of the Data API.
Generalizing the implied volatility skew into parameters is a good way to get an overall view of the surface. Comparing the parameters to history, to related stocks or to ETFs is a good way to see what part of the skew might be overpriced. For example, if the slope is steep and other stocks or ETFs are not, the put IV might be overpriced relative to calls.
To drill down to the specific areas on the implied volatility skew, the use of delta buckets to categorize implied volatility can be helpful. ORATS breaks down each expiration into 21 volatility buckets from 100 delta to 0 delta every 5 deltas.
Here's a picture of XLK from 5/22/19 delta bucktest of IVs:
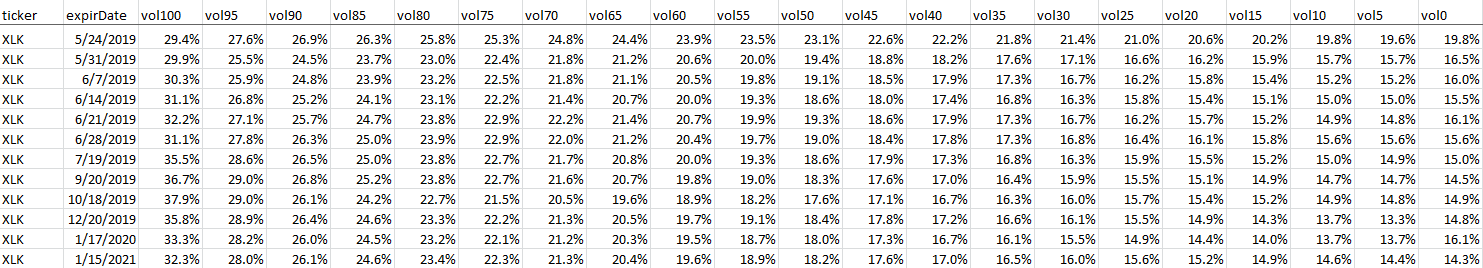
We call this our Monies (short for money-ness) part of the Data API. Trial
Monies are available each trading day back to 2007.
Tracking areas of the volatility surface using delta buckets can help identify areas of over or undervalued parts of the skew.
More reading:
Disclaimer:
The opinions and ideas presented herein are for informational and educational purposes only and should not be construed to represent trading or investment advice tailored to your investment objectives. You should not rely solely on any content herein and we strongly encourage you to discuss any trades or investments with your broker or investment adviser, prior to execution. None of the information contained herein constitutes a recommendation that any particular security, portfolio, transaction, or investment strategy is suitable for any specific person. Option trading and investing involves risk and is not suitable for all investors.
All opinions are based upon information and systems considered reliable, but we do not warrant the completeness or accuracy, and such information should not be relied upon as such. We are under no obligation to update or correct any information herein. All statements and opinions are subject to change without notice.
Past performance is not indicative of future results. We do not, will not and cannot guarantee any specific outcome or profit. All traders and investors must be aware of the real risk of loss in following any strategy or investment discussed herein.
Owners, employees, directors, shareholders, officers, agents or representatives of ORATS may have interests or positions in securities of any company profiled herein. Specifically, such individuals or entities may buy or sell positions, and may or may not follow the information provided herein. Some or all of the positions may have been acquired prior to the publication of such information, and such positions may increase or decrease at any time. Any opinions expressed and/or information are statements of judgment as of the date of publication only.
Day trading, short term trading, options trading, and futures trading are extremely risky undertakings. They generally are not appropriate for someone with limited capital, little or no trading experience, and/ or a low tolerance for risk. Never execute a trade unless you can afford to and are prepared to lose your entire investment. In addition, certain trades may result in a loss greater than your entire investment. Always perform your own due diligence and, as appropriate, make informed decisions with the help of a licensed financial professional.
Commissions, fees and other costs associated with investing or trading may vary from broker to broker. All investors and traders are advised to speak with their stock broker or investment adviser about these costs. Be aware that certain trades that may be profitable for some may not be profitable for others, after taking into account these costs. In certain markets, investors and traders may not always be able to buy or sell a position at the price discussed, and consequently not be able to take advantage of certain trades discussed herein.
Be sure to read the OCCs Characteristics and Risks of Standardized Options to learn more about options trading.
Related Posts