Indicators
Thursday, July 29th 2021
Options Indicator Spotlight: Implied Volatility Ratio To SPY
ORATS calculates implied volatility ex-earnings and its ratio to SPY. When applied to a backtest, this indicator improves annual return, drawdown, and more.
Summary
ORATS's ivSpyRatio indicator calculates the ratio between a stock's 30-day implied volatility ex-earnings and the implied volatility of SPY. Backtesting with this indicator improves annual return, drawdown, and more. The numerator is calculated using ORATS's proprietary historical volatilities derived from intraday data, and term structure modeling is used to remove the effect of upcoming earnings on the implied volatility of the stock. The entry max on the ivSpyRatio indicator should be set to a value less than two to improve the results of a bullish short put spread strategy.
ORATS has hundreds of proprietary indicators accessible through our Data API and Wheel web platform of tools. One of our most popular indicators – ivSpyRatio – looks at the ratio between a stock’s 30 day implied volatility ex-earnings and the implied volatility of SPY.
You can watch the breakdown in the video below, or read on for a written walkthrough:
Backtest Results With Indicator Trigger vs. Without
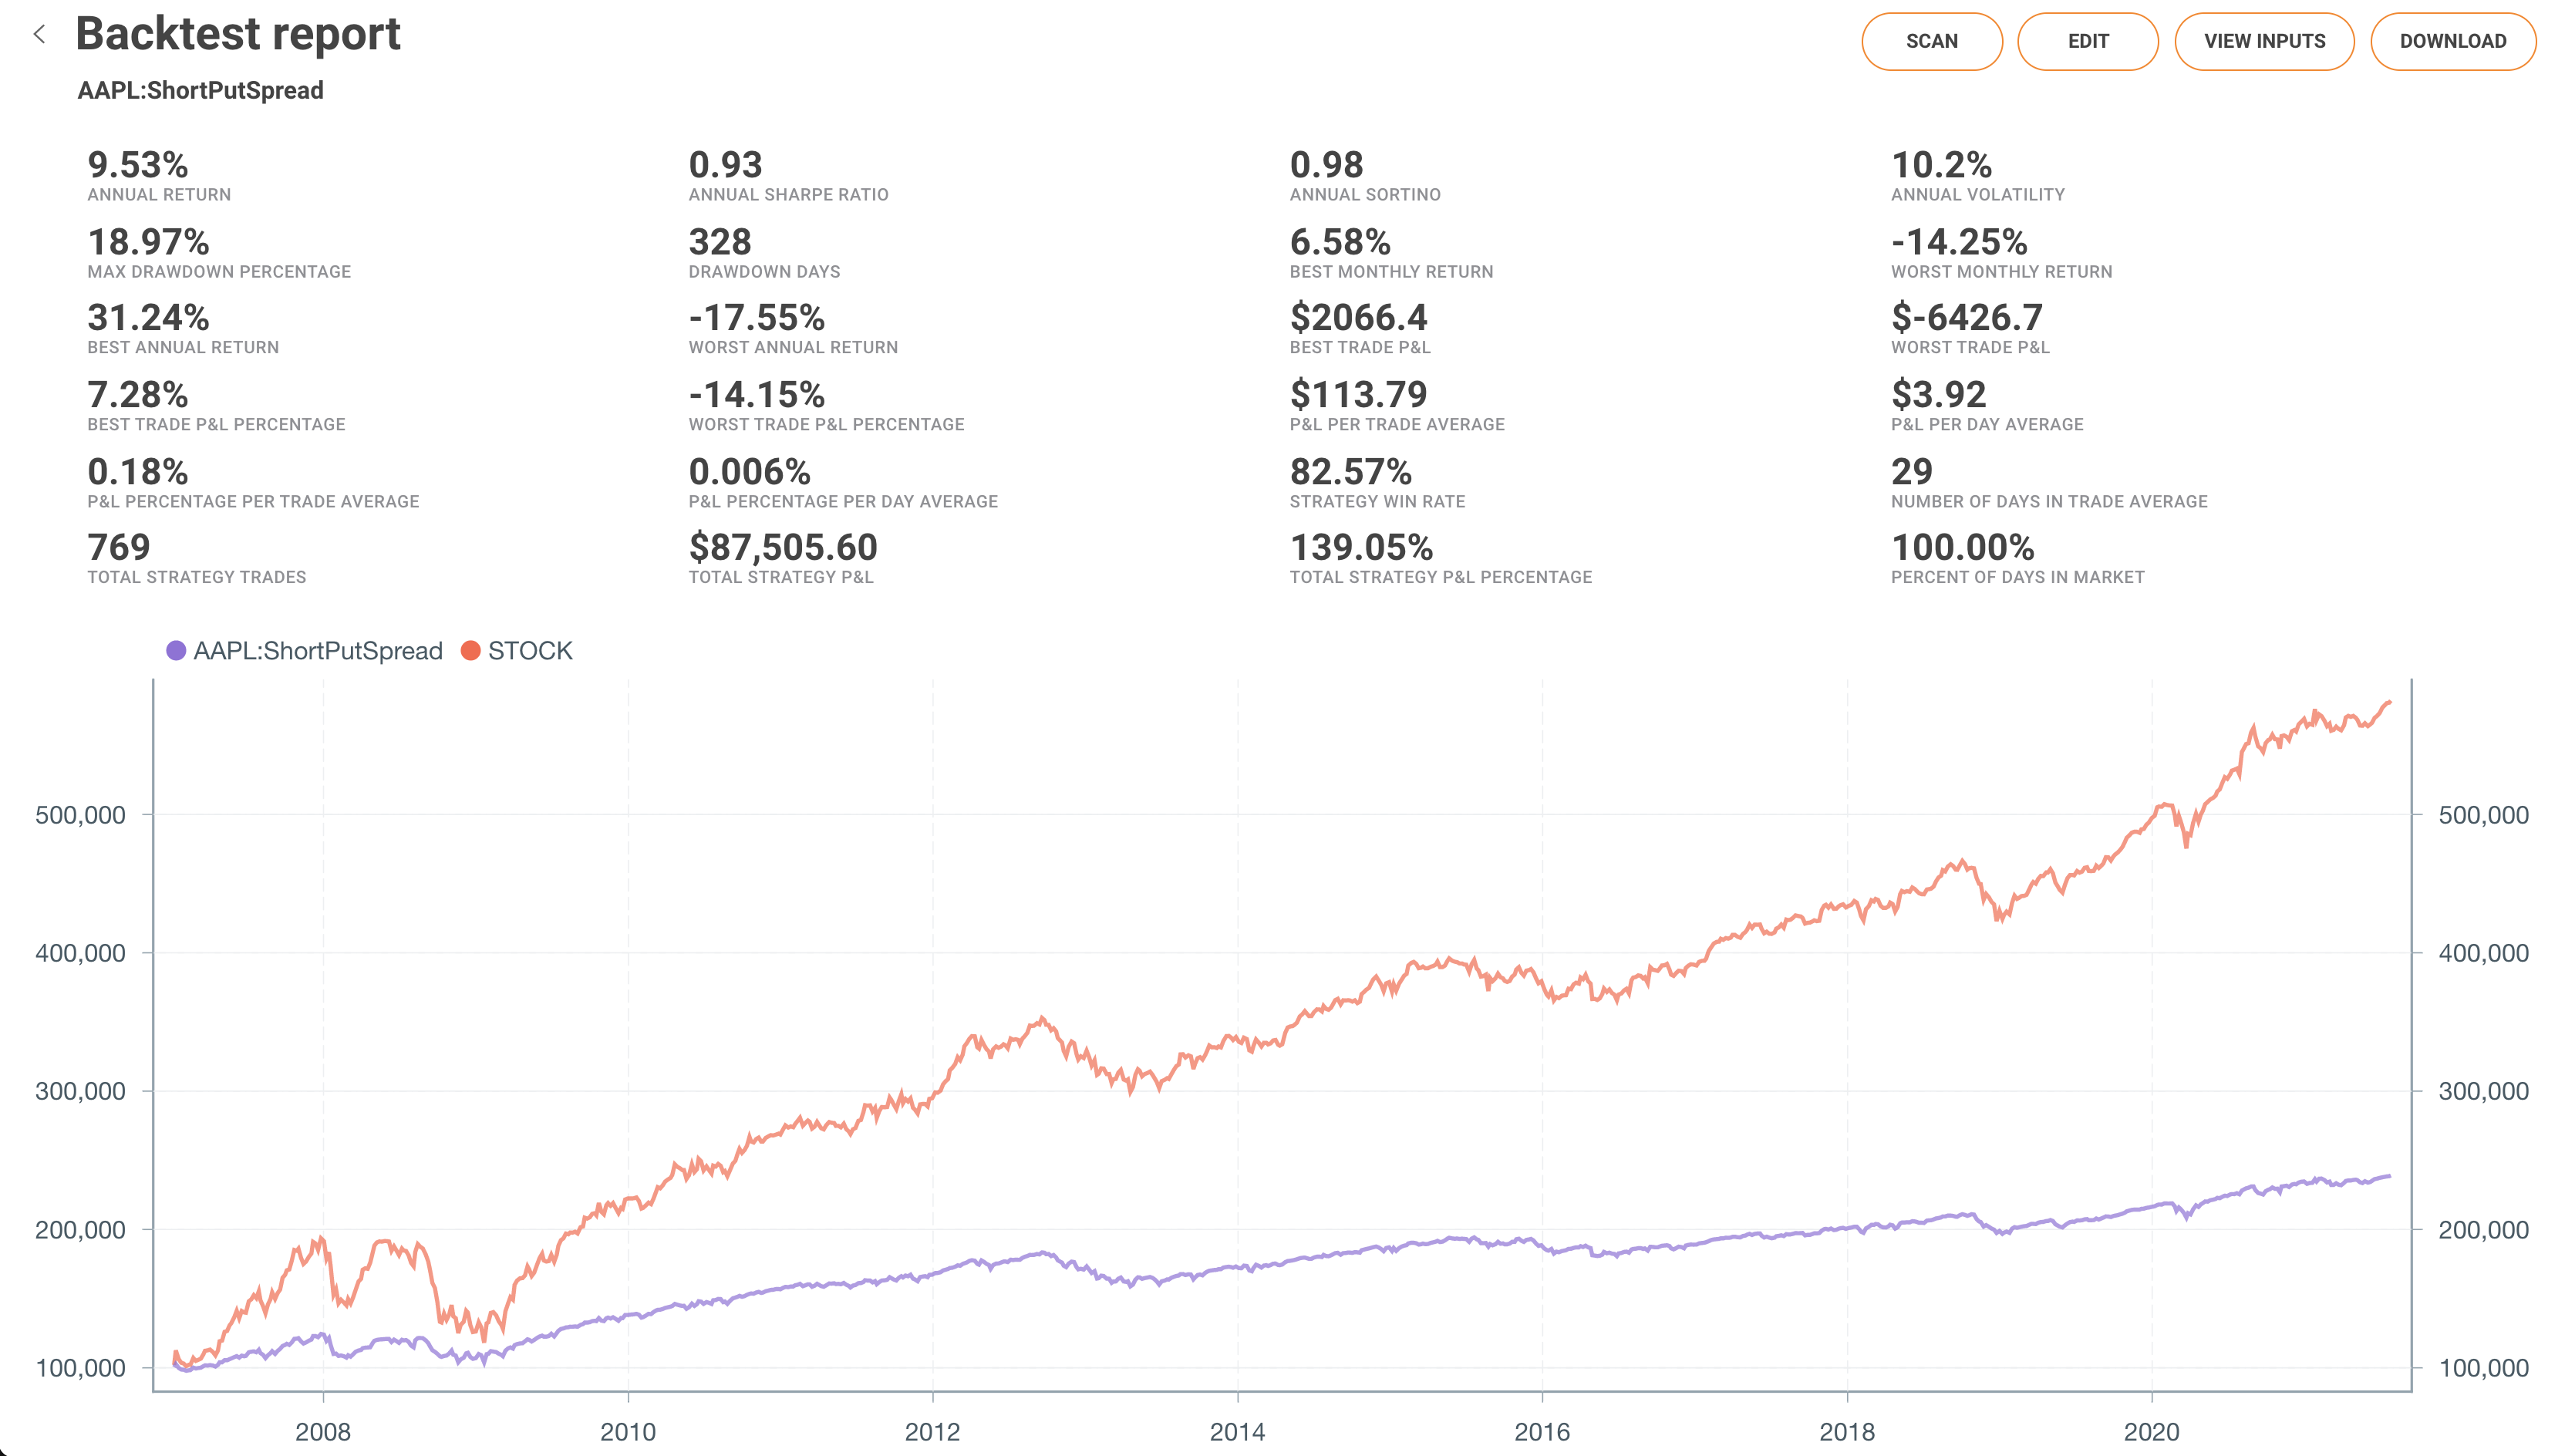
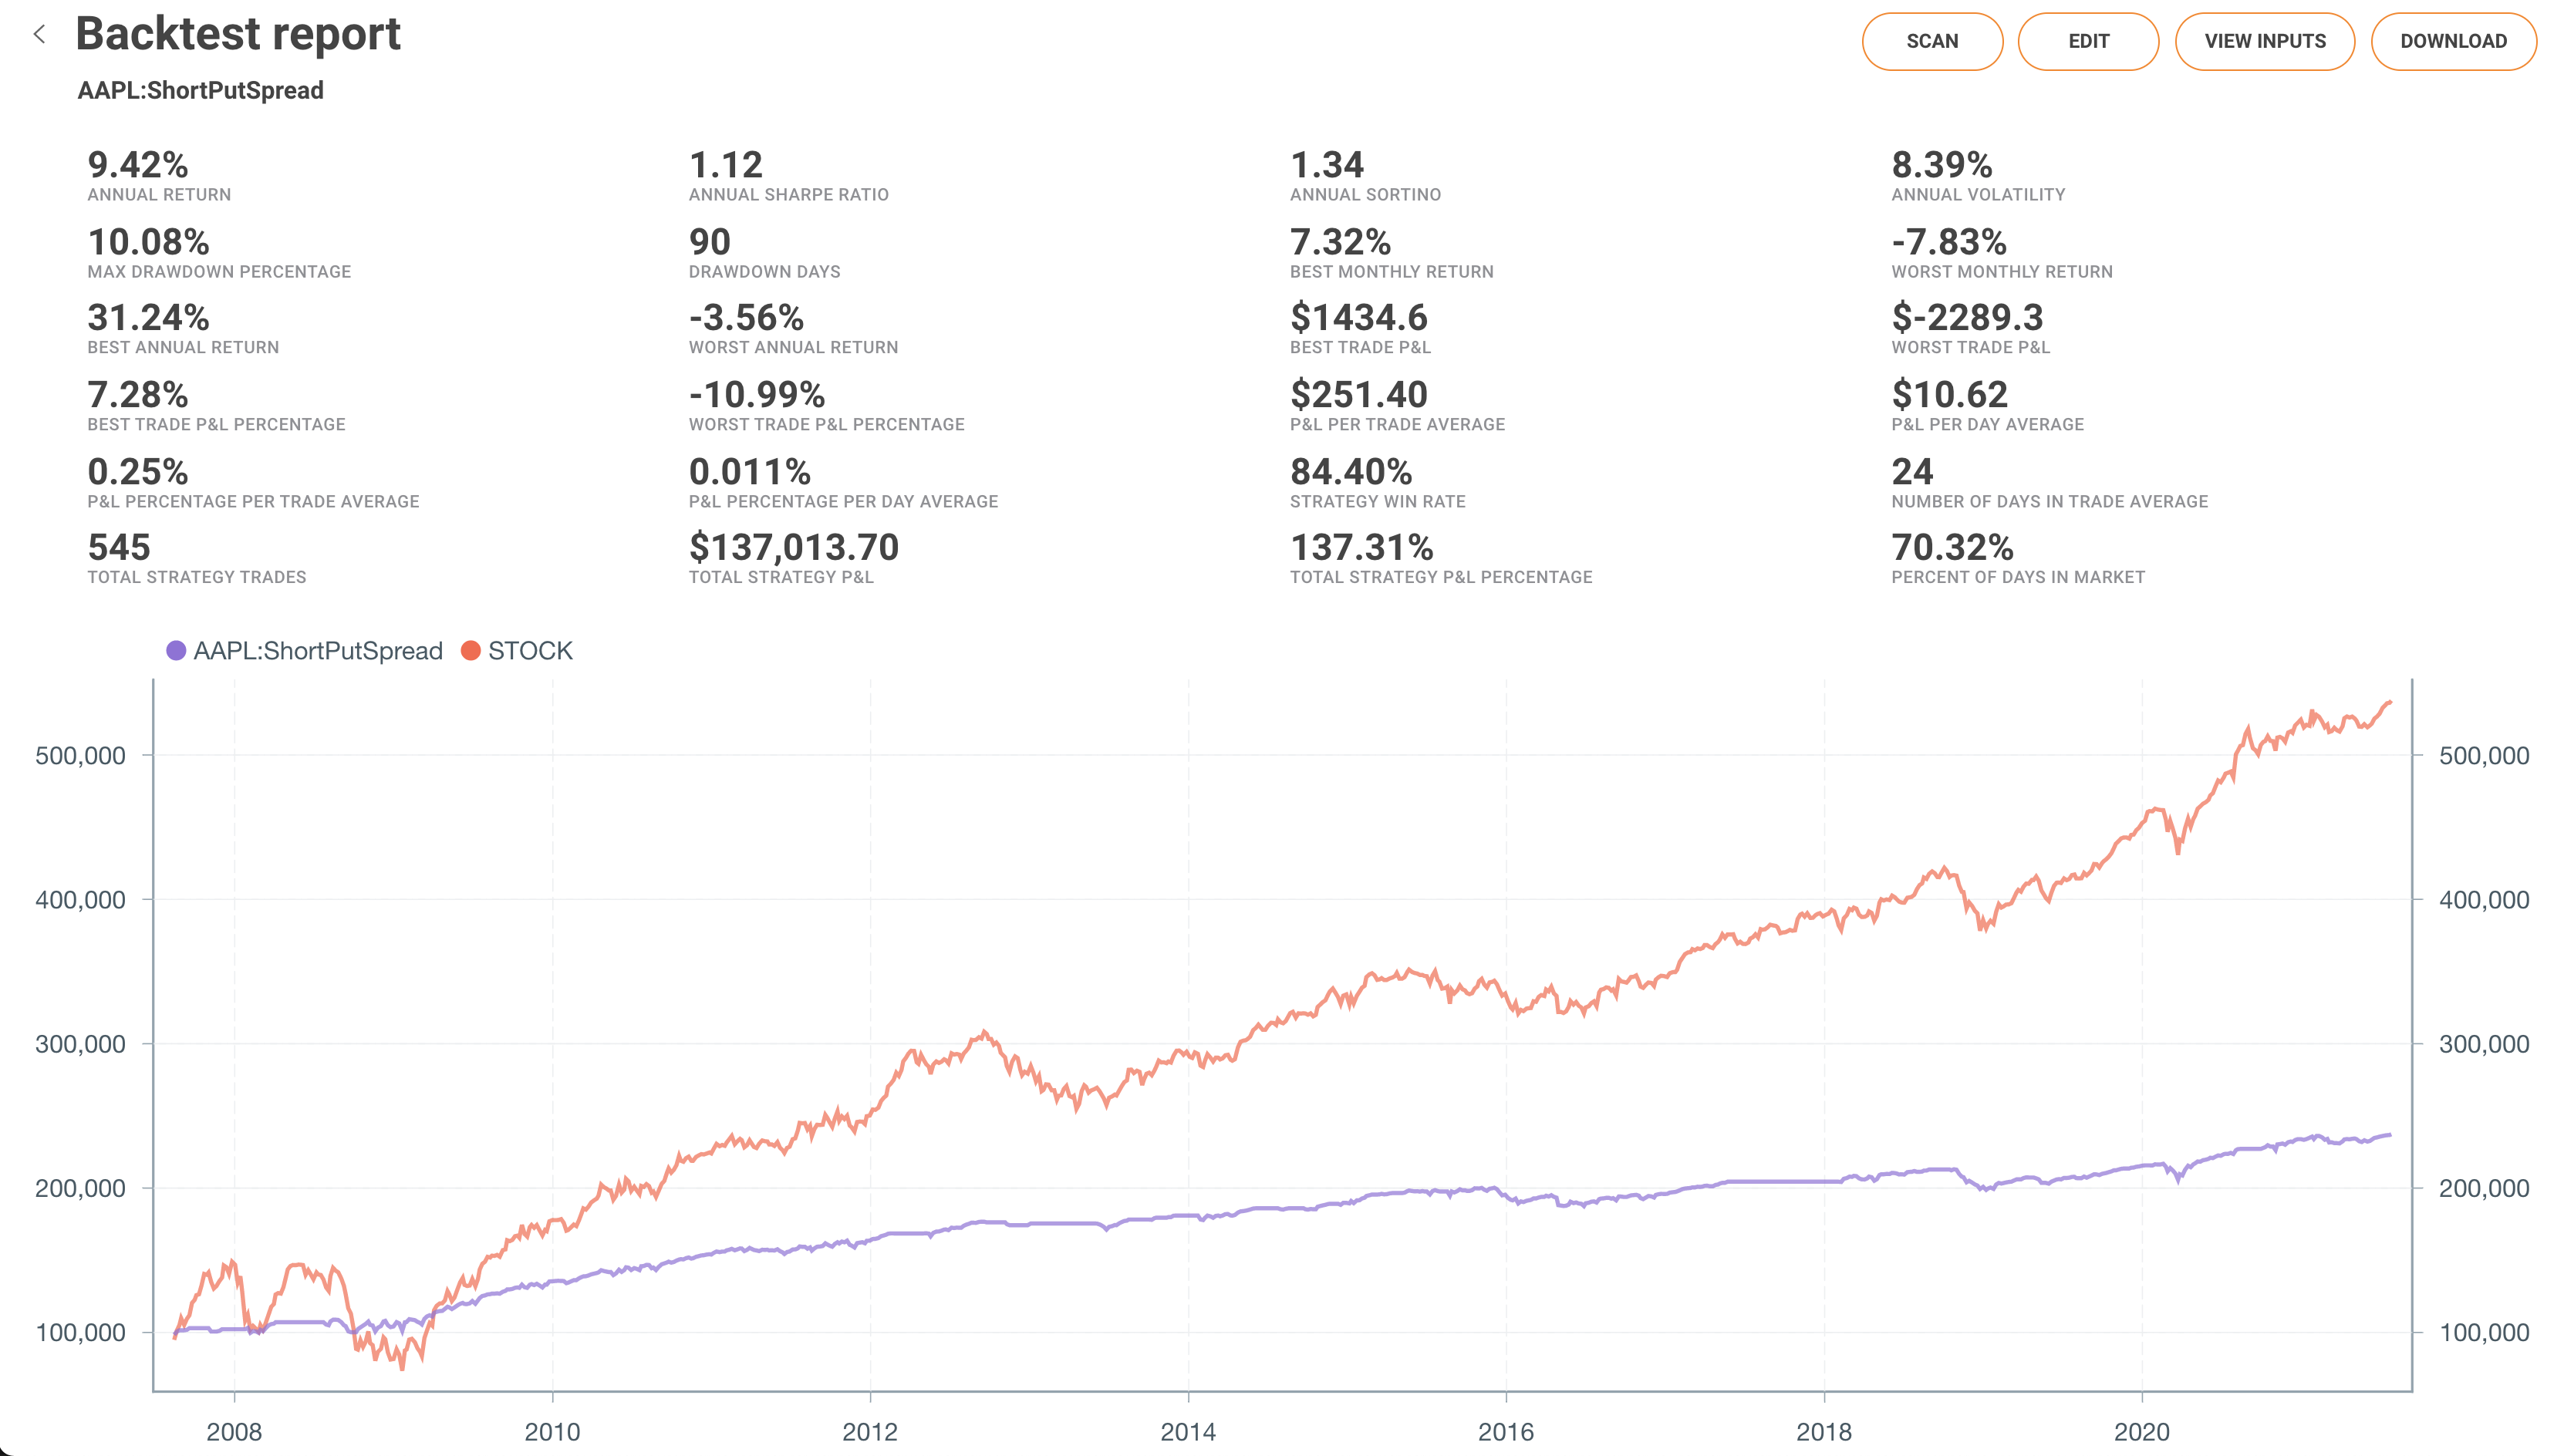
Below are screenshots of the backtest results for each strategy. The first strategy omits the ivSpyRatio indicator, and the second strategy includes both entry and exit triggers for the indicator.
Without Indicator:
With Indicator (entry and exit triggers applied):
Here is a summary of the main differences between the two backtests:
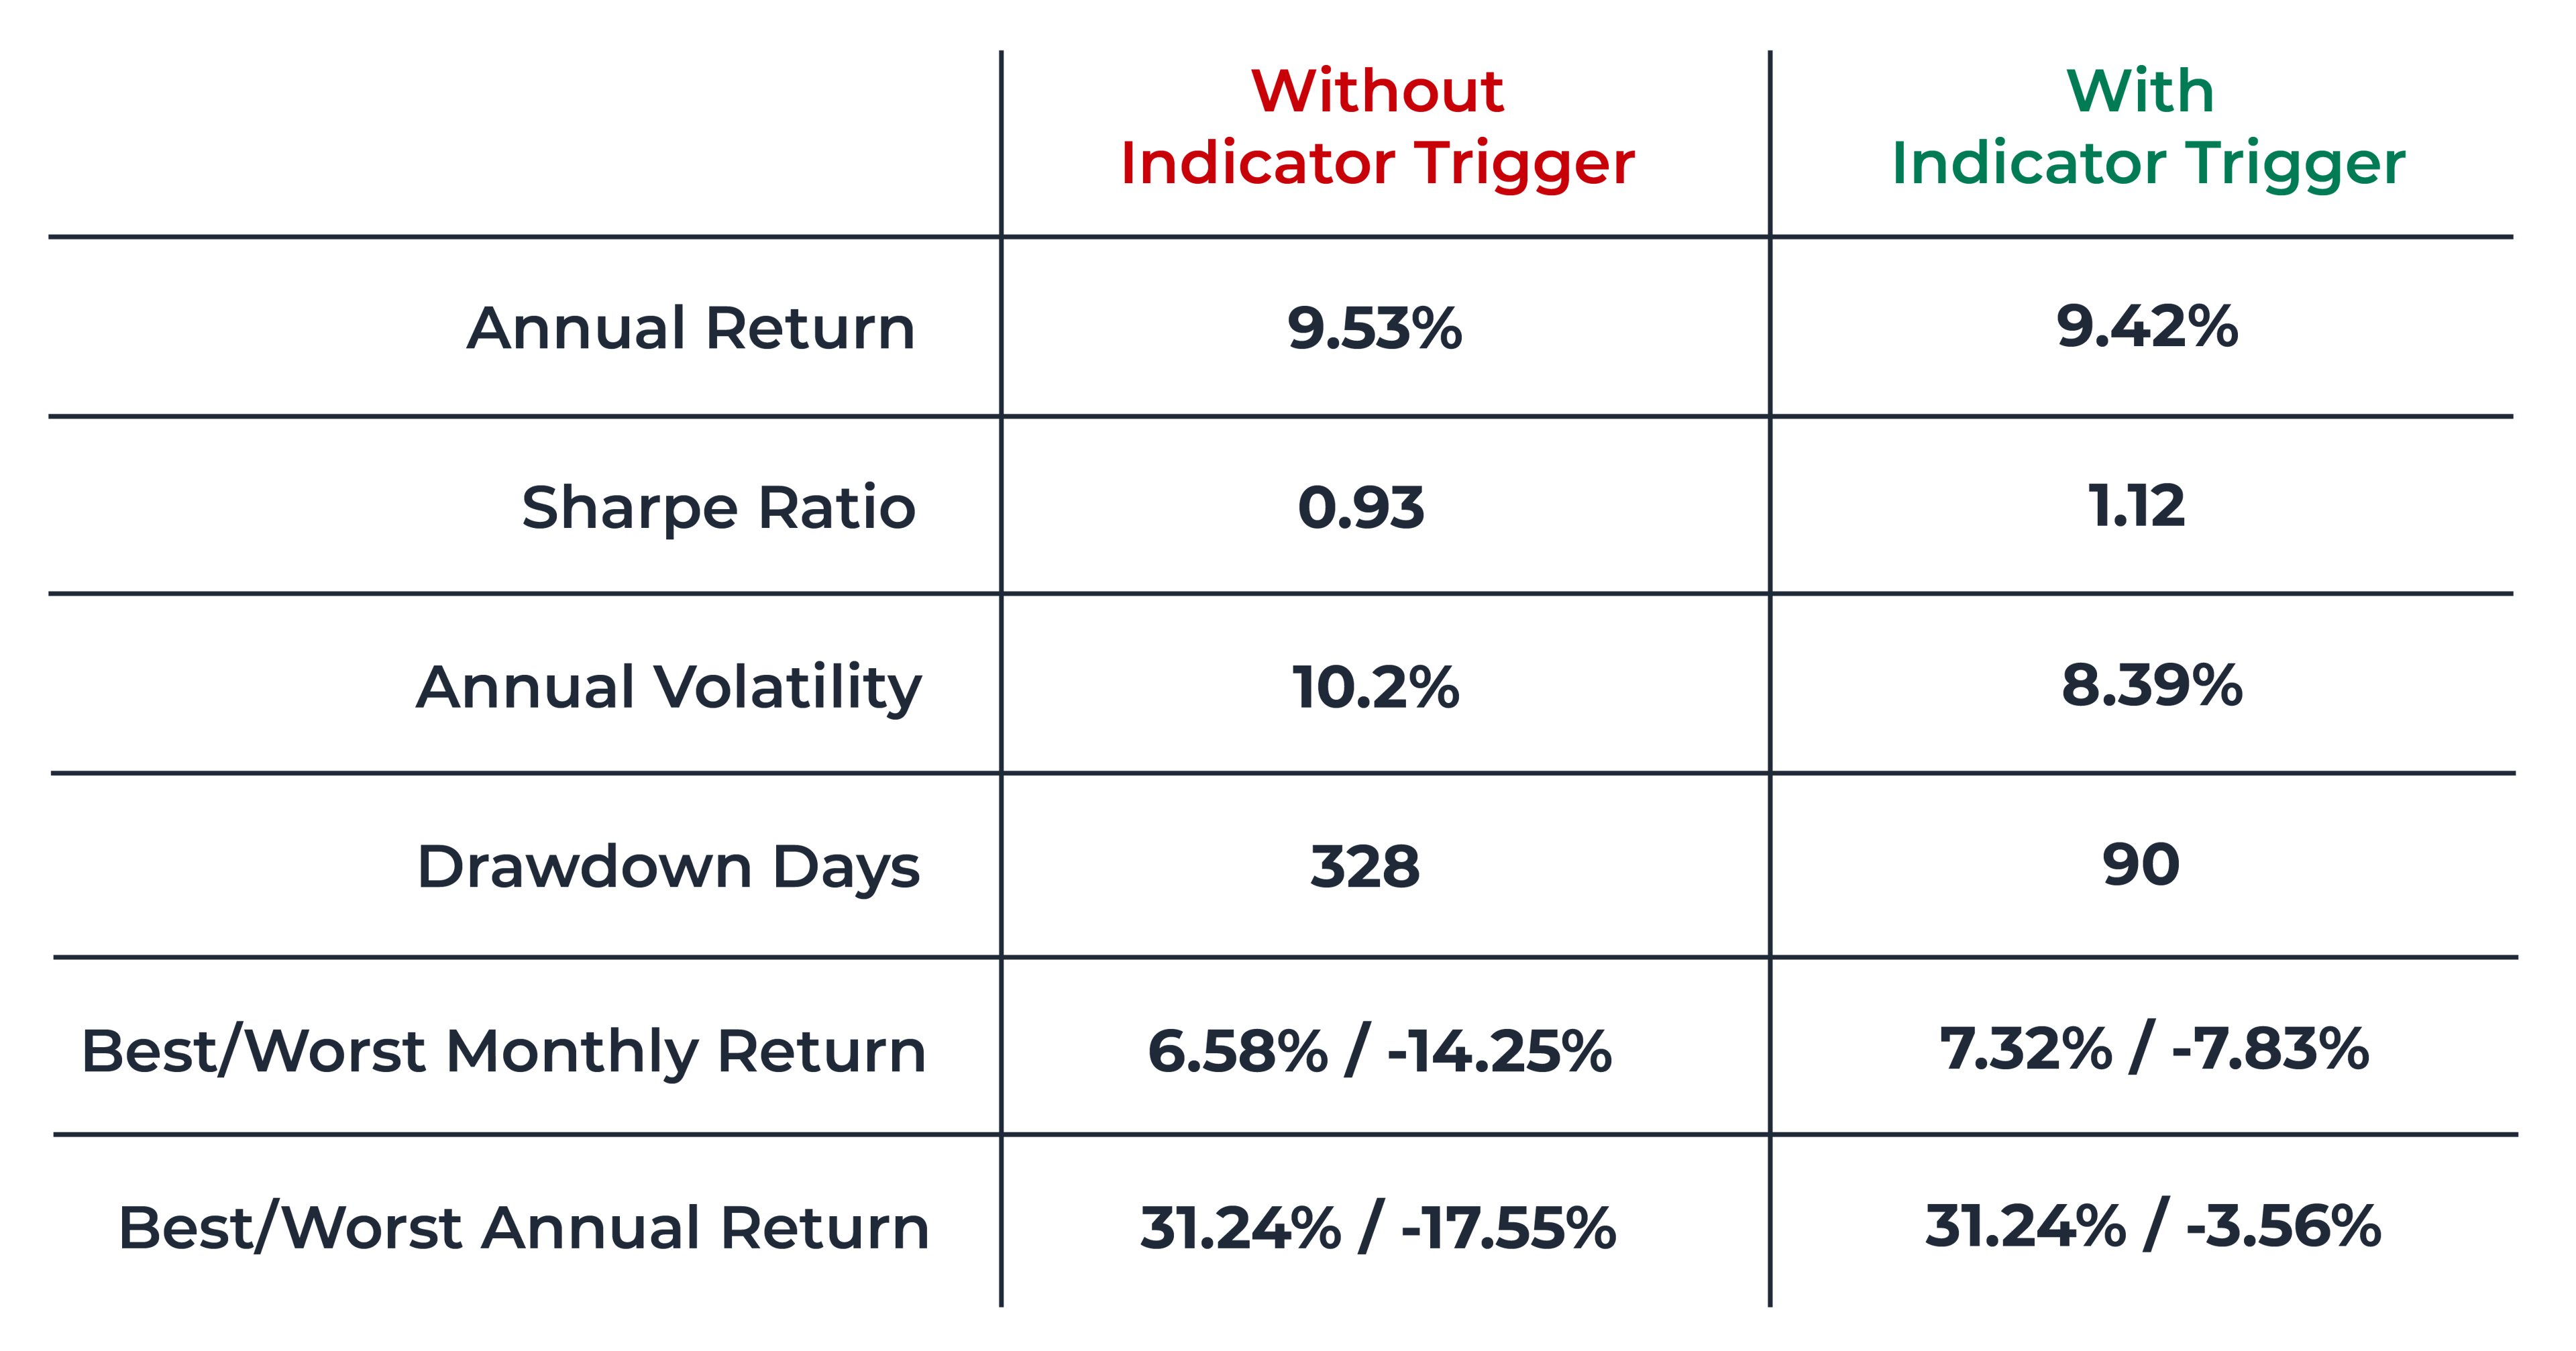
While the annual returns are nearly the same, the backtest with the indicator trigger was in the market only 70% of the time, compared to 100% of the time for the strategy without the indicator. We can calculate an adjusted return by dividing the annual return by the percent of days in market. This gives the indicator trigger backtest an adjusted return of 14.4%, a significant improvement over the original return.
How The Indicator Works
To understand why the ivSpyRatio indicator is so powerful, we have to examine the equation:
ivSpyRatio = ORATS 30 day implied volatility ex-earnings / SPY 30 day ORATS implied volatility
``Let’s look at the numerator first. ORATS calculates the 30-day implied volatility of a stock using proprietary historical volatilities derived from intraday data. These produce more accurate daily volatilities than the traditional close-to-close method. In turn, we are able to generate more effective forecasts and other useful data sets. We then utilize our sophisticated methods of term structure modeling to take out any effect that upcoming earnings may have on the implied volatility of the stock.The ratio to the SPY implied volatility is where this indicator begins to draw its meaning. Since Apple stock is a huge component of the S&P 500, any significant difference between the ETF’s implied volatility and Apple’s implied volatility is worth investigating.We can pull up the chart tab in Wheel to look at a graph of this indicator. It is set to display only the last two years for clarity:
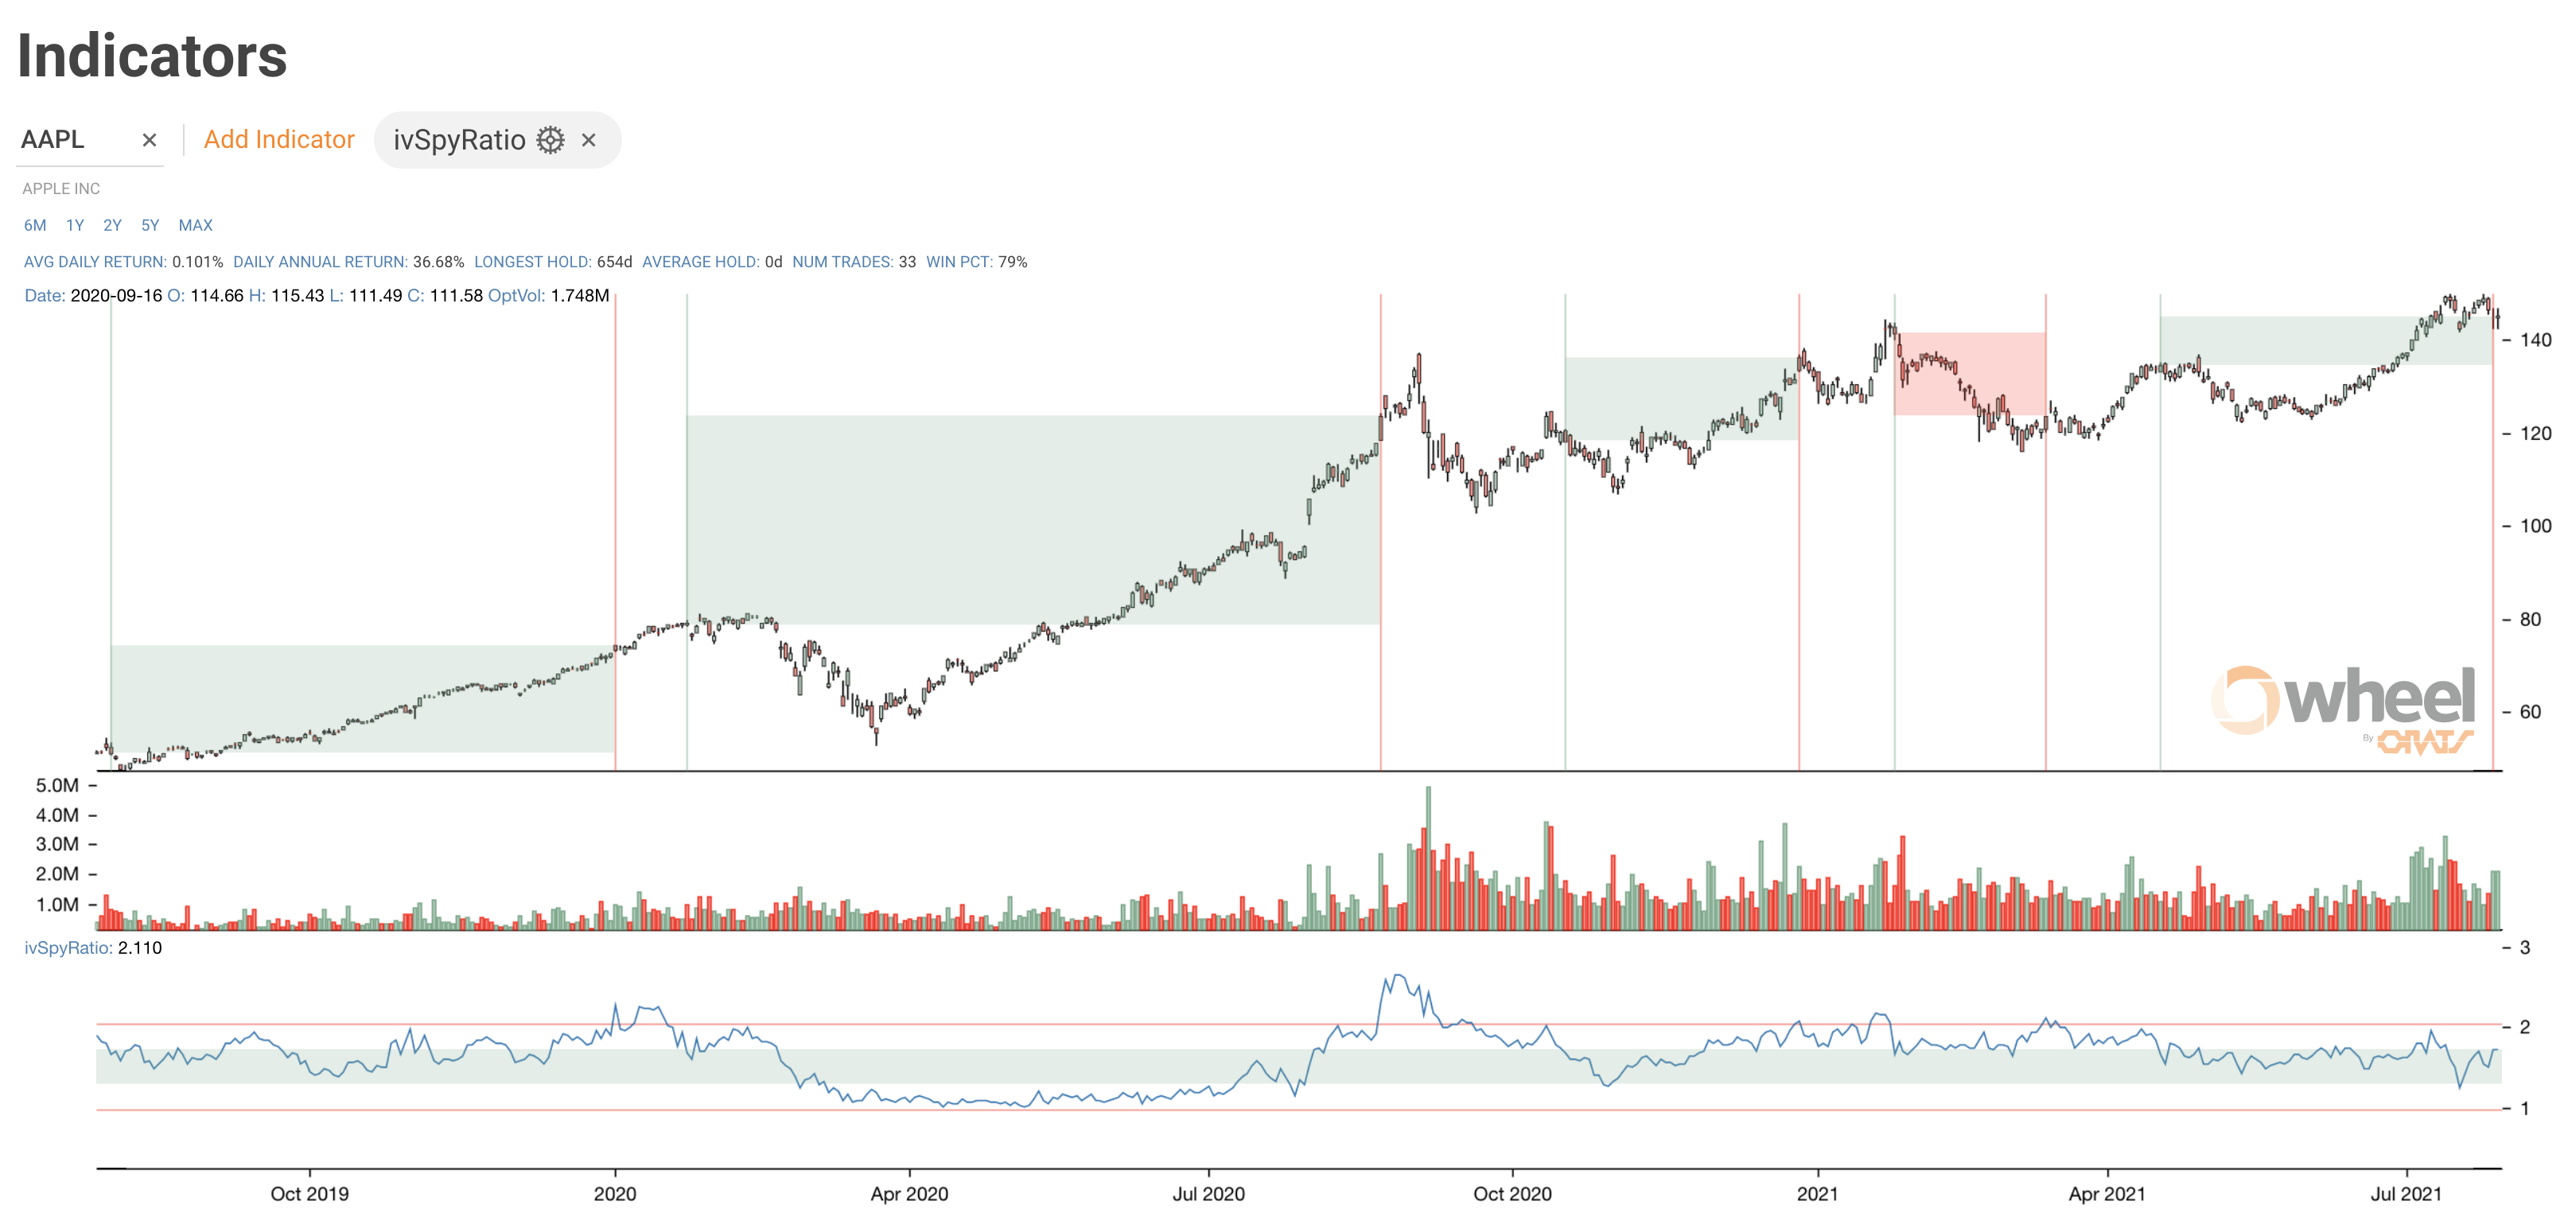
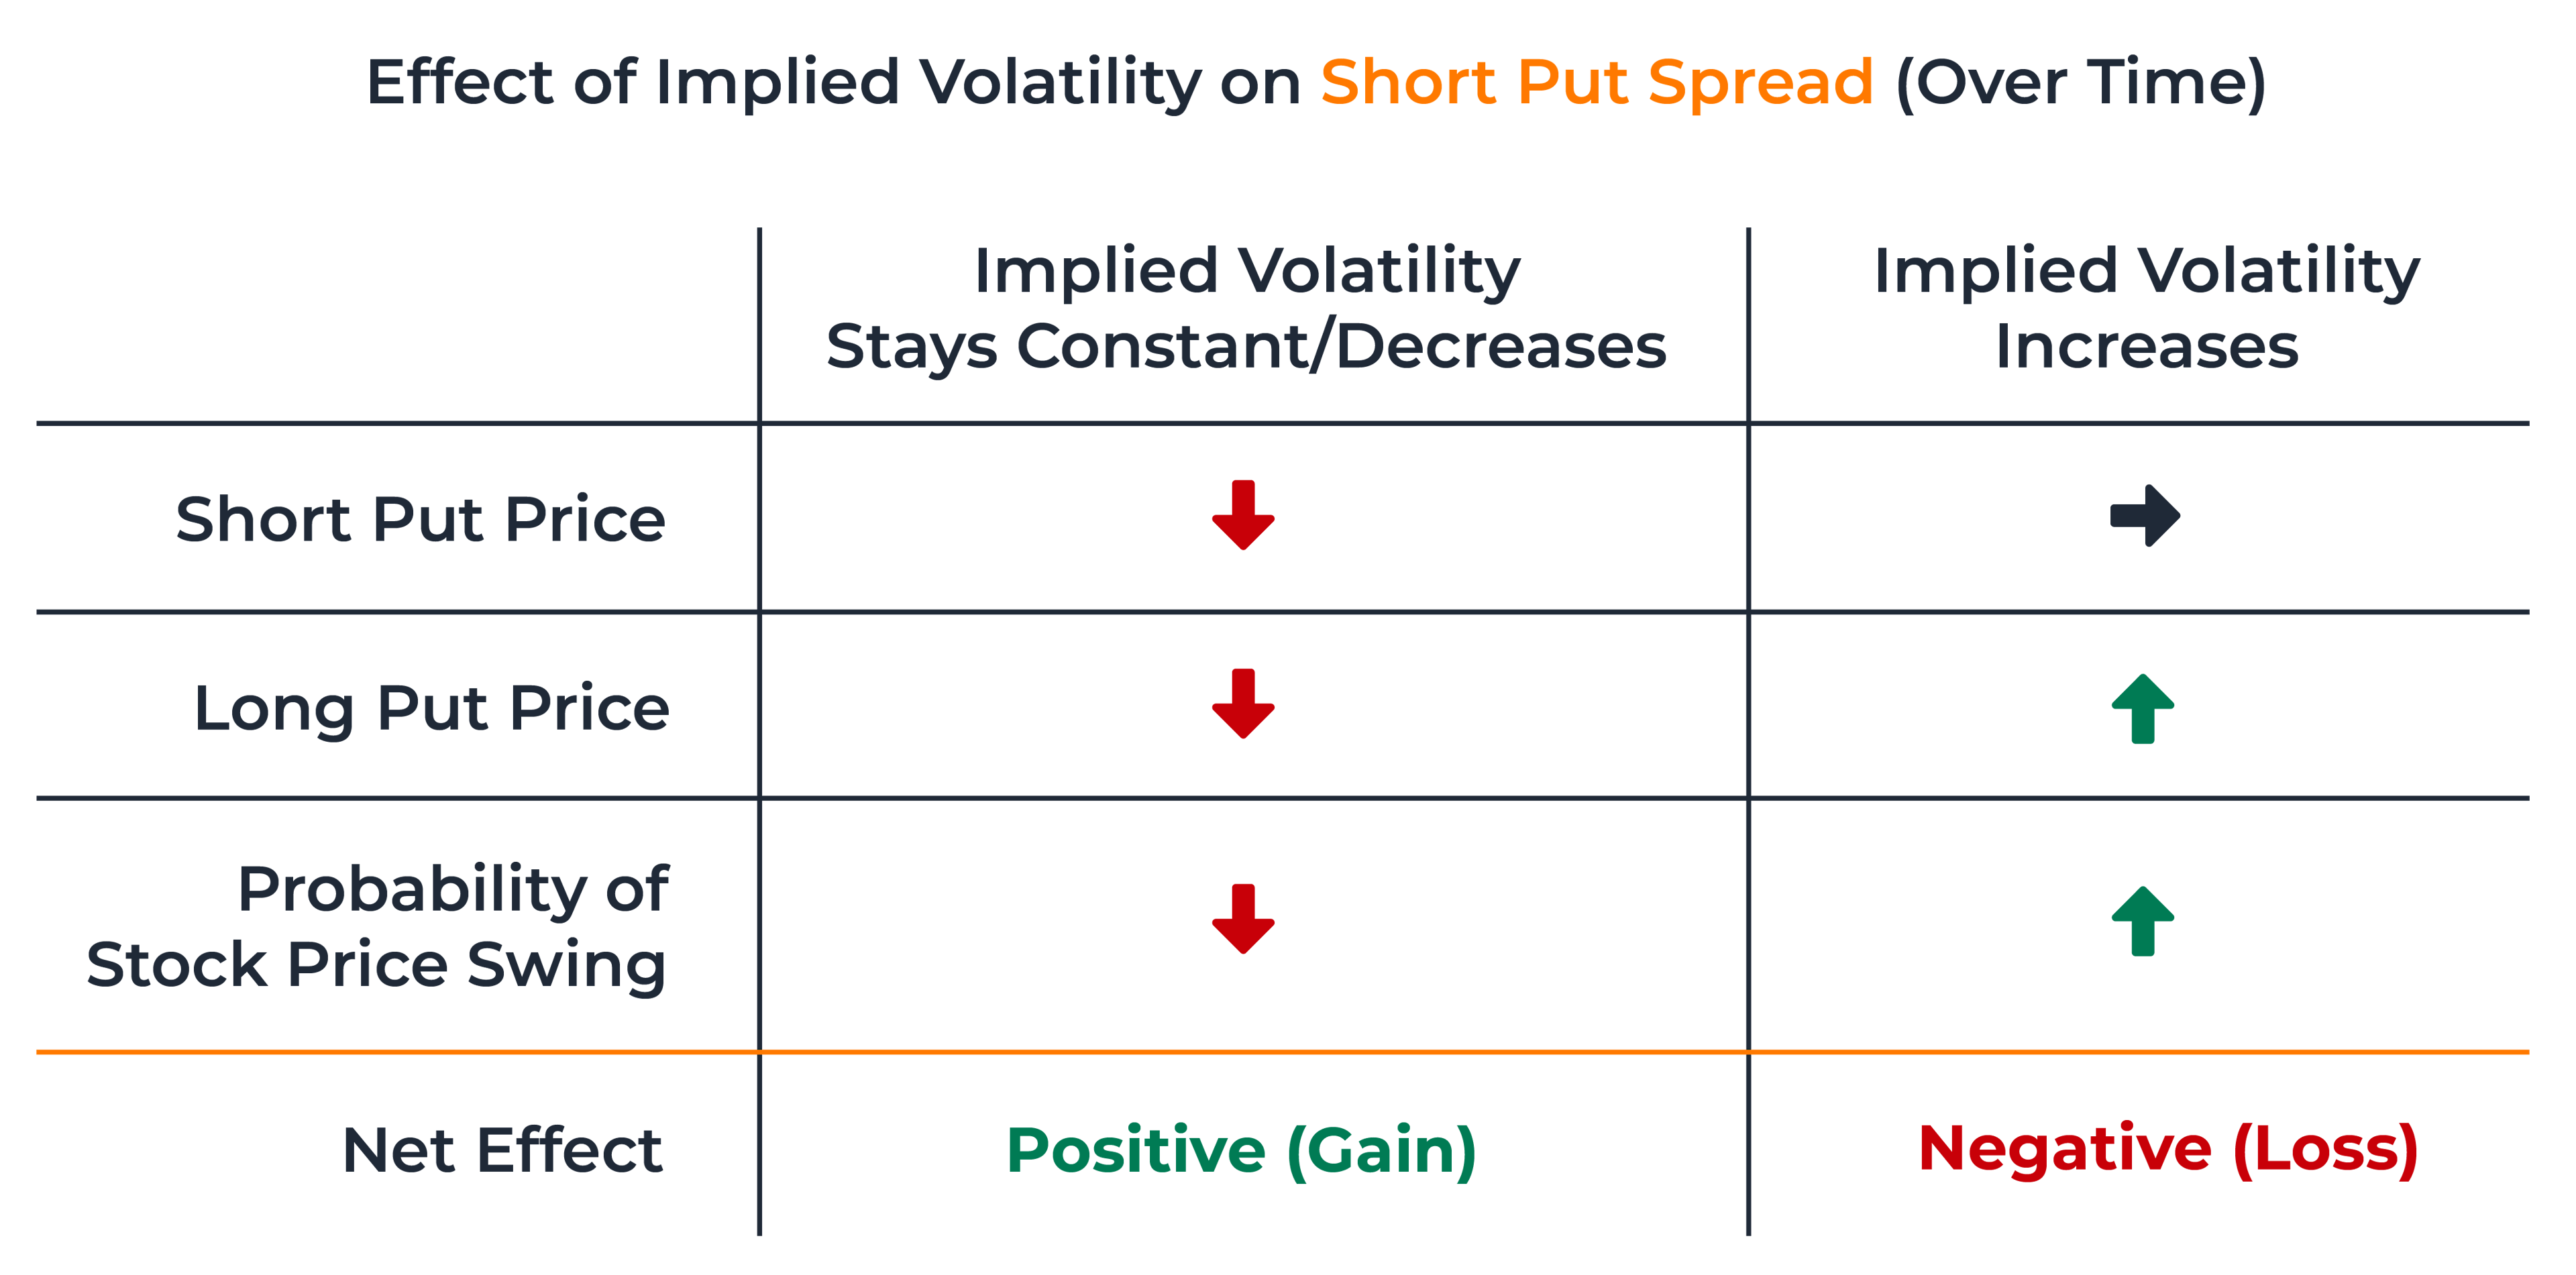
Around late August in 2020, we saw this indicator jump up higher than two, which means that Apple’s implied volatility was nearly double that of SPY. Since we are backtesting a short put spread, which is a bullish strategy, we want implied volatility to stay relatively constant and predictable. Ideally, if our bullish forecast is correct, the price of both options will decrease over time and eventually expire worthless. However, if implied volatility unexpectedly rises, we could be at a greater risk for a price swing, which would be bad for our bullish short put spread. The following table summarizes the outcomes:
Looking back at the ivSpyRatio graph, this is exactly what happened during August and September 2020. A lot of volatility in a short amount of time, which is precisely when we want to avoid being in this trade. From this analysis, we can determine that setting the entry max on the ivSpyRatio indicator to a value less than two will help improve the results of this strategy.
How To Backtest In WheelLet’s apply what we’ve learned from the chart to the backtesting engine by adding ivSpyRatio to the entry date triggers parameter. We’ll also add an exit indicator trigger. Below are the exact inputs I used to create the backtest that is shown at the beginning of the article (with a 9.42% annual return):
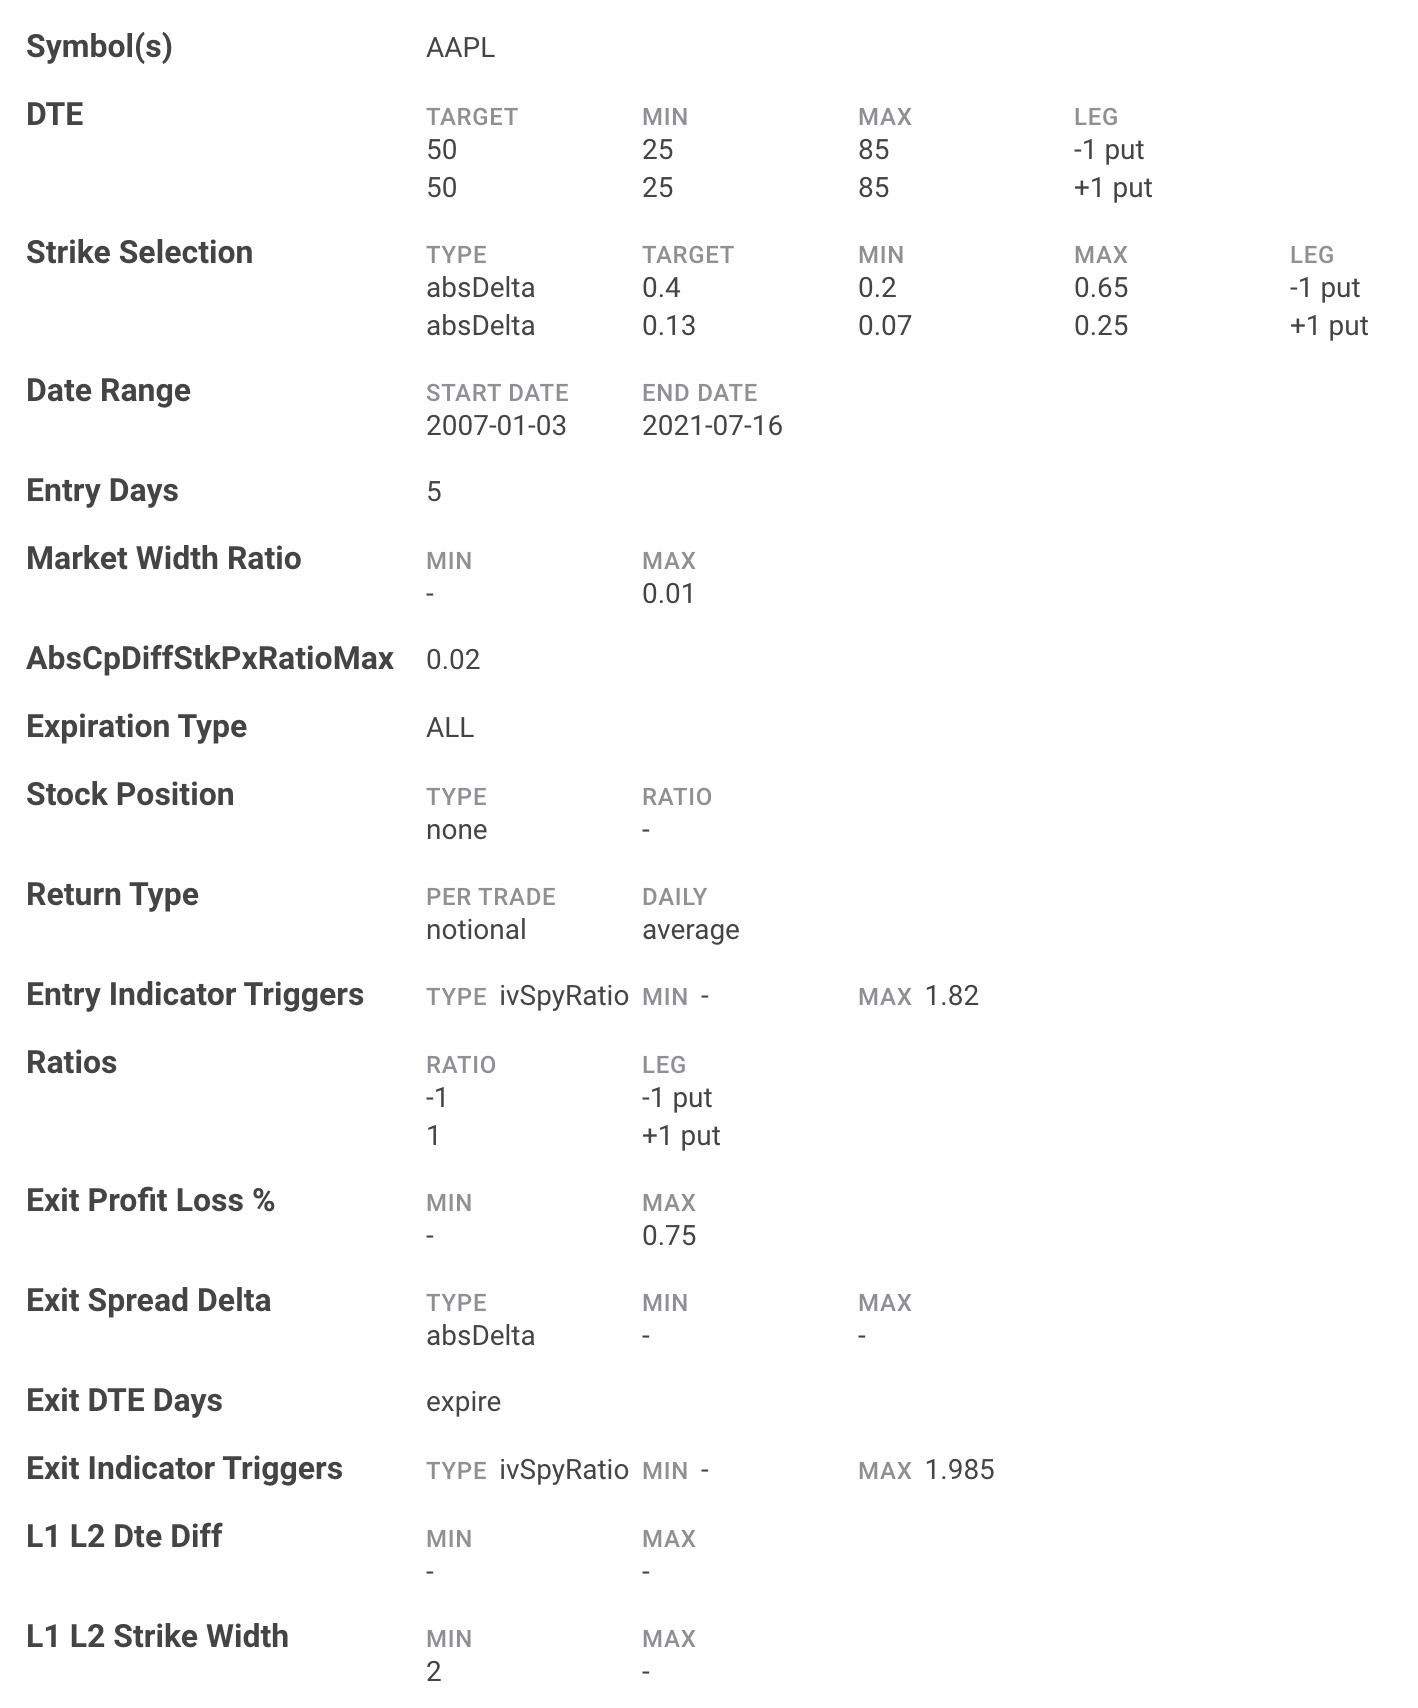
The backtester will only enter the trade if the reading for the indicator is between 0 and 1.82. The backtester will only exit the trade if the reading is below 0 or above 1.985.A critical thing to remember is that this indicator already takes out the earnings effect. This means it’s already compensating for the natural spike and fall in implied volatility that occurs when earnings are announced. By doing so, we can accurately compare the implied volatility of an ETF with no earnings, to a stock like Apple that has earnings.We’re excited for you to test this indicator in your own backtests and see firsthand how it can help improve your strategies.
To receive the latest indicator breakdowns, subscribe to our blog or YouTube channel.Learn about our Data API: https://orats.com/data-api/Learn about our Wheel web platform: https://orats.com/wheel/
Disclaimer:
The opinions and ideas presented herein are for informational and educational purposes only and should not be construed to represent trading or investment advice tailored to your investment objectives. You should not rely solely on any content herein and we strongly encourage you to discuss any trades or investments with your broker or investment adviser, prior to execution. None of the information contained herein constitutes a recommendation that any particular security, portfolio, transaction, or investment strategy is suitable for any specific person. Option trading and investing involves risk and is not suitable for all investors.
All opinions are based upon information and systems considered reliable, but we do not warrant the completeness or accuracy, and such information should not be relied upon as such. We are under no obligation to update or correct any information herein. All statements and opinions are subject to change without notice.
Past performance is not indicative of future results. We do not, will not and cannot guarantee any specific outcome or profit. All traders and investors must be aware of the real risk of loss in following any strategy or investment discussed herein.
Owners, employees, directors, shareholders, officers, agents or representatives of ORATS may have interests or positions in securities of any company profiled herein. Specifically, such individuals or entities may buy or sell positions, and may or may not follow the information provided herein. Some or all of the positions may have been acquired prior to the publication of such information, and such positions may increase or decrease at any time. Any opinions expressed and/or information are statements of judgment as of the date of publication only.
Day trading, short term trading, options trading, and futures trading are extremely risky undertakings. They generally are not appropriate for someone with limited capital, little or no trading experience, and/ or a low tolerance for risk. Never execute a trade unless you can afford to and are prepared to lose your entire investment. In addition, certain trades may result in a loss greater than your entire investment. Always perform your own due diligence and, as appropriate, make informed decisions with the help of a licensed financial professional.
Commissions, fees and other costs associated with investing or trading may vary from broker to broker. All investors and traders are advised to speak with their stock broker or investment adviser about these costs. Be aware that certain trades that may be profitable for some may not be profitable for others, after taking into account these costs. In certain markets, investors and traders may not always be able to buy or sell a position at the price discussed, and consequently not be able to take advantage of certain trades discussed herein.
Be sure to read the OCCs Characteristics and Risks of Standardized Options to learn more about options trading.
Related Posts