300 - Backtesting
Input Parameters
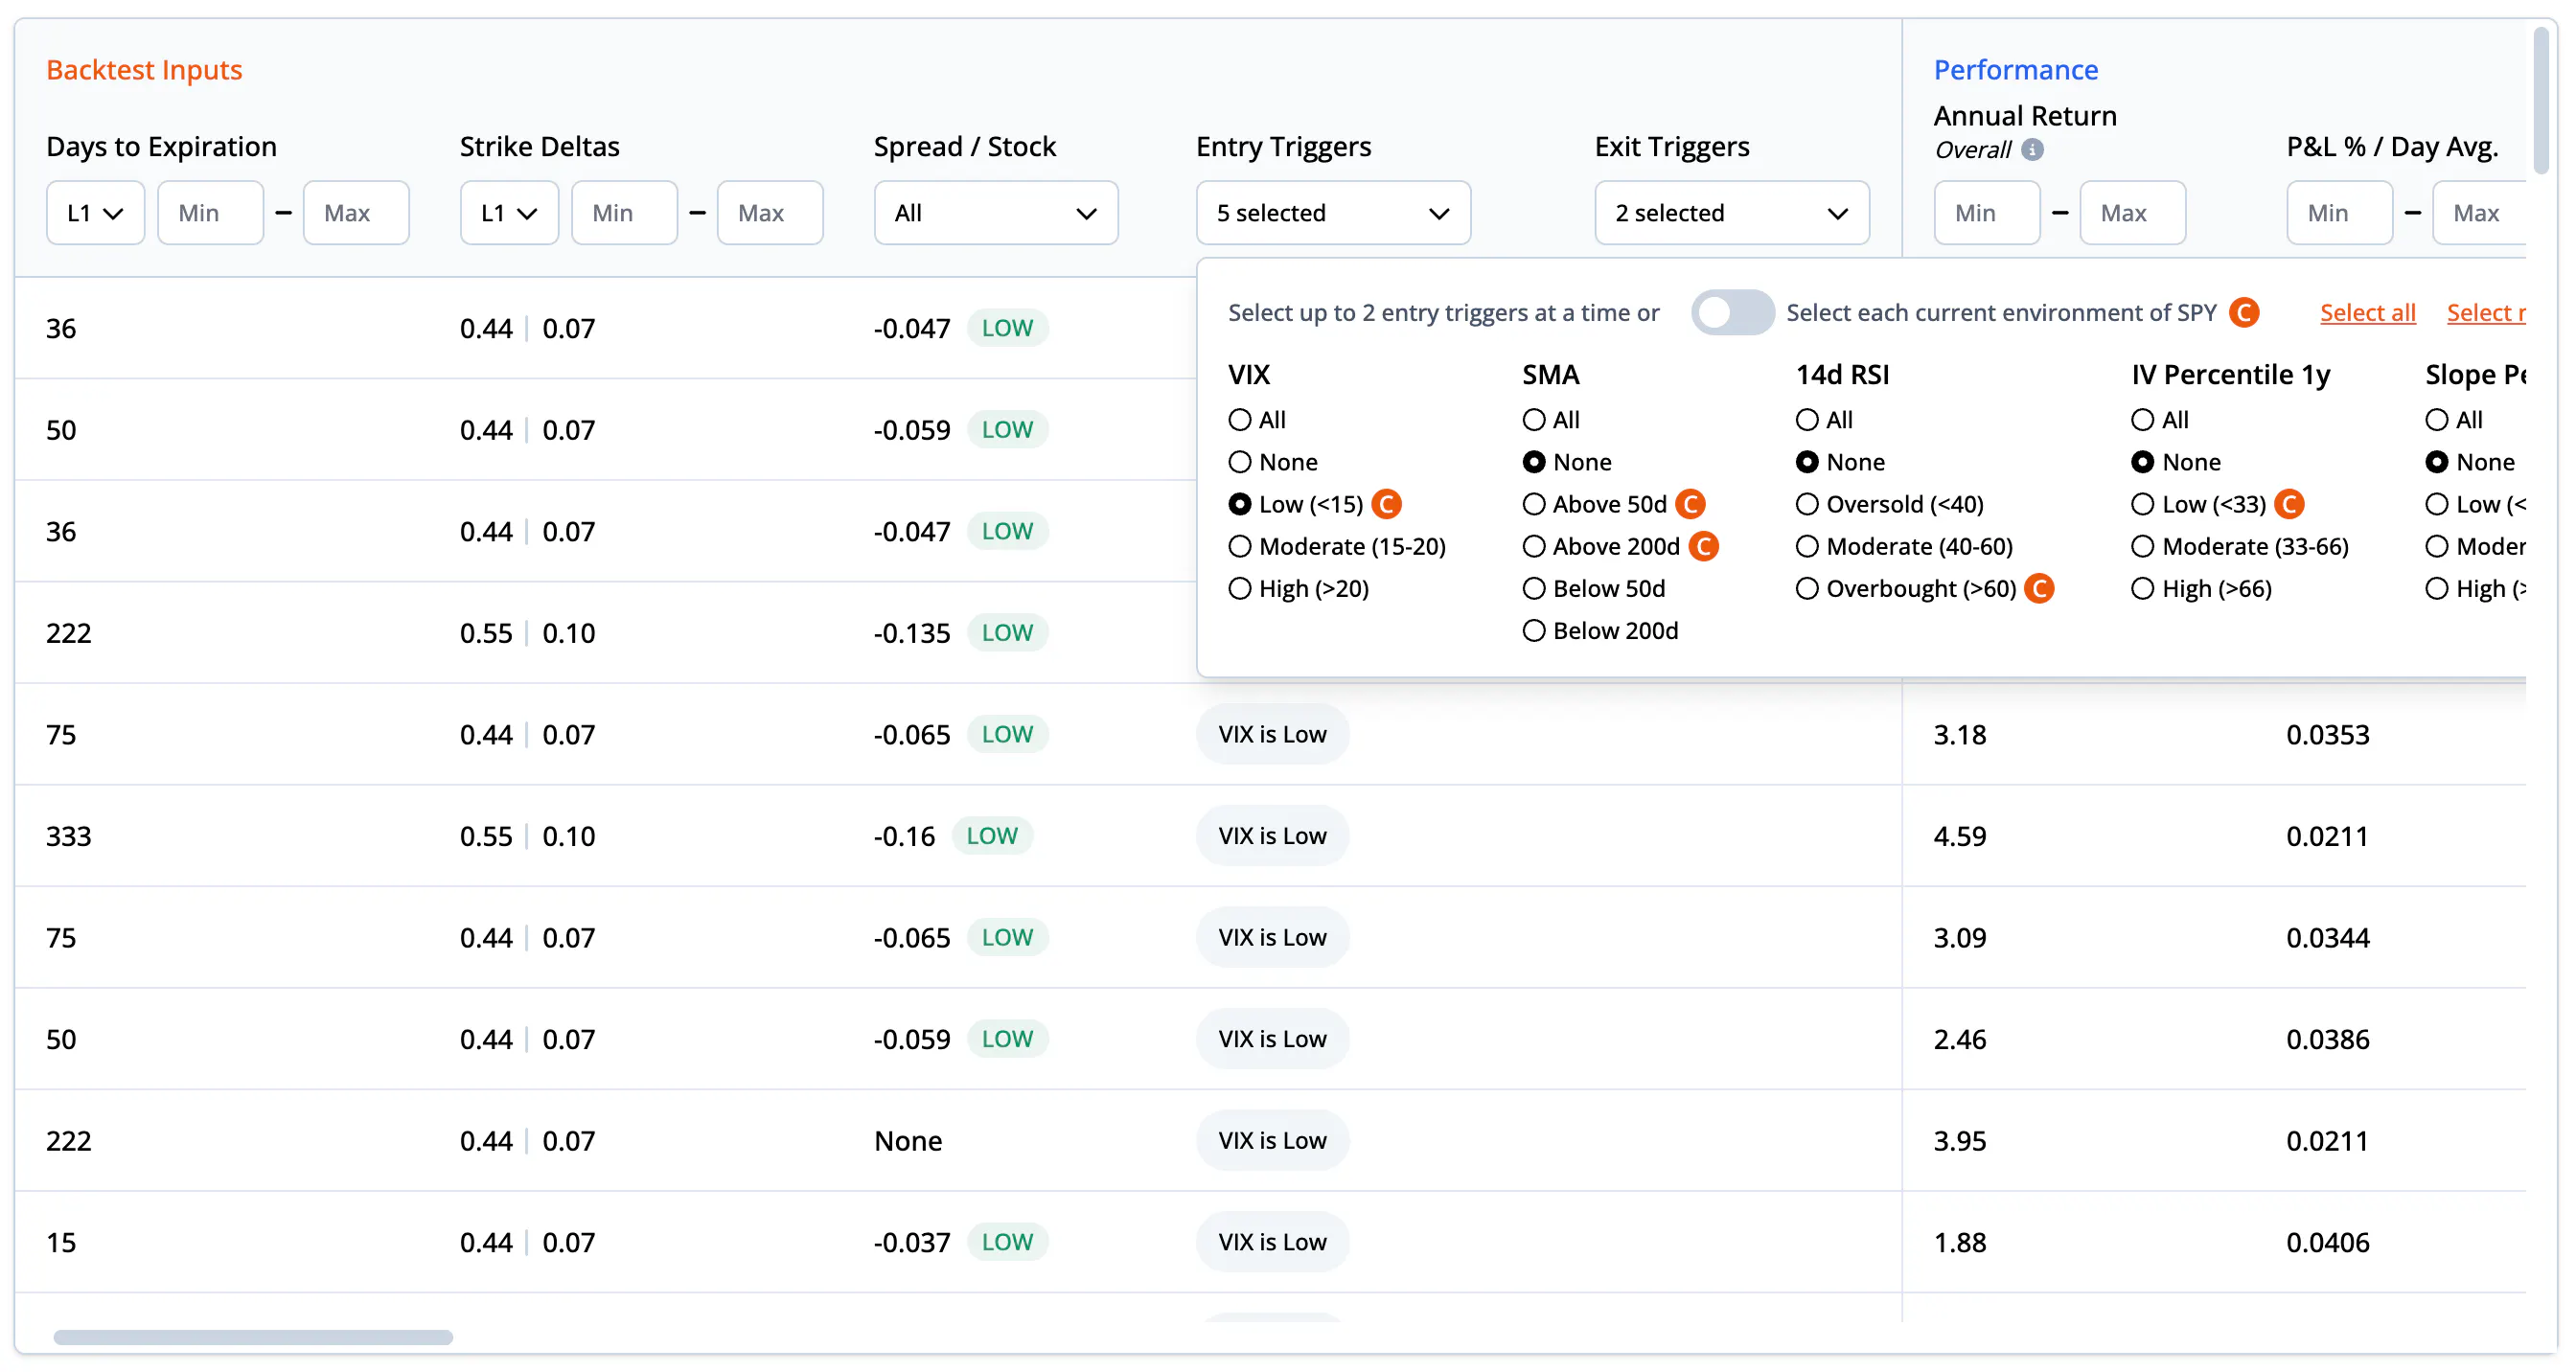
To run millions upon millions of combinations, we needed to choose only the most important entry criteria - days to expiration, strike deltas, and spread / stock % (spread yield), along with five different technical indicators. For exit criteria, this meant testing four different stop losses and seven different profit targets.
Entry criteria
Days to expiration
Days to expiration (DTE) indicates the remaining time until an option contract expires. Our backtesting tool analyzes strategy performance over a diverse range of DTEs, from as little as 2 days to over 300 days. By evaluating the strategy's performance across different time horizons, traders can gain insights into the ideal periods for executing specific strategies. In the backtester, you can filter down the table of results by specifying DTE min/max for each leg.
Strike deltas
The strike delta is a measurement of how much an option's price is likely to move with each $1 move in the underlying security. To provide you with a comprehensive view, our backtester tests strategies across a variety of absolute deltas, including in-the-money and out-of-the-money strikes. In addition to single leg strategies, we also test a variety of multi-leg strategies with more complex strike deltas such as vertical spreads and iron condors. Like DTE, you can use the filters in the backtest table to narrow down backtests by the strike delta min/max for each leg of the strategy.

Spread yield
Spread yield is a measure of the price paid for the options spread relative to the price of the underlying stock. It's calculated by dividing the price paid for the spread by the stock price. Our backtester categorizes the spread yield target for each backtest as low, moderate, or high, relative to other backtests with comparable DTE and strike deltas. This additional context allows for more informed analysis.
It’s interesting to explore the relationships between different backtest entry criteria and their performance. For example, if you filter down SPY Short Put Spreads by a low VIX entry trigger, and rank them by best overall performance, you’ll see that the spread / stock is almost always low. This shows that in a low volatility environment, this strategy performed better as you targeted a lower spread yield.

Technical indicators
Technical indicators can provide guidance on when to enter a trade. We’ve added five different technical indicators to be used as entry triggers in the backtester:
VIX price: The VIX, or volatility index, reflects the market's expectation of 30-day forward-looking volatility. Low VIX levels (<15) suggest a calm market, moderate levels (15-20) indicate normal volatility, while high levels (>20) imply increased uncertainty.
Simple moving average (SMA): SMA is a commonly used technical indicator that smoothes out price data to capture trends over specific periods. Our backtester tests if the price is above or below the 50 or 200-day SMA.
14d RSI: The 14-day Relative Strength Index (RSI) is a momentum oscillator that measures the speed and change of price movements. A reading of less than 40 indicates oversold conditions, 40-60 suggests moderate momentum, and above 60 signals overbought conditions.
IV percentile 1 Year: The IV percentile shows where the current implied volatility of the underlying stands relative to its 1-year range. It's categorized as low (<33), moderate (33-66), or high (>66).
Slope percentile 1 Year: This trigger shows where the current slope of the implied volatility skew stands relative to its 1-year range, categorized as low (<33), moderate (33-66), or high (>66).
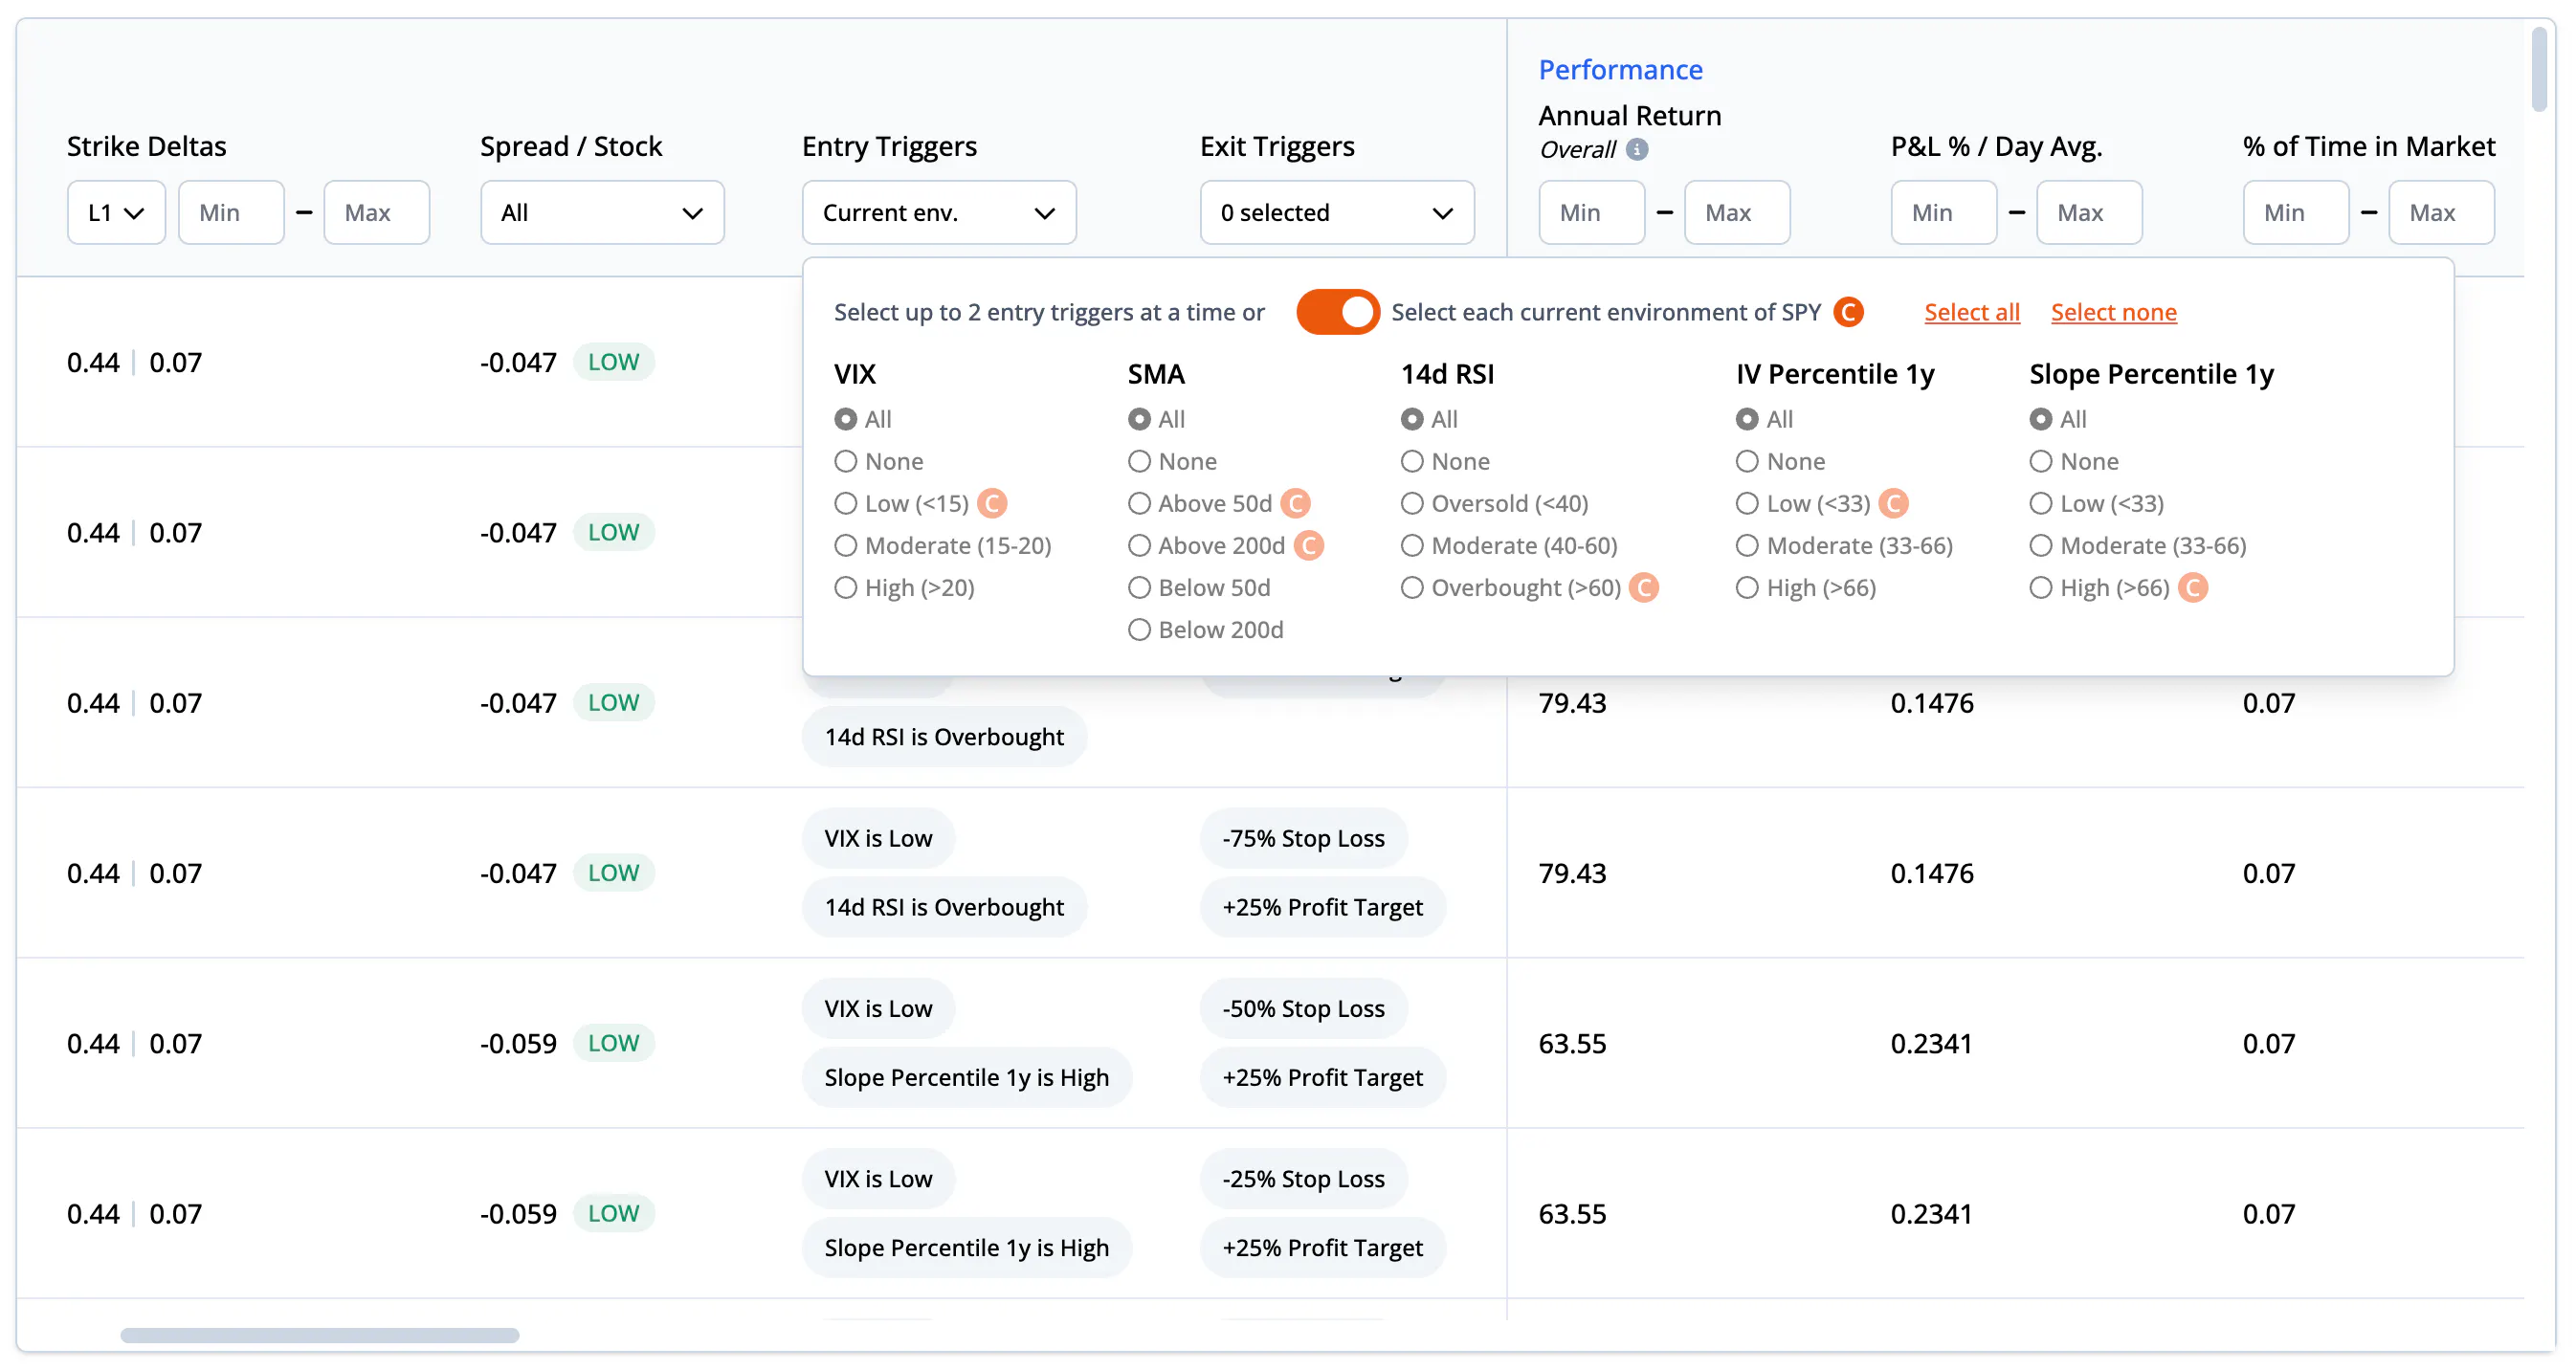
For each of these entry triggers, one of the levels is always the “current environment”. This is denoted by the orange “C” next to the corresponding level. For example, if the 14d RSI is currently overbought, an orange “C” will appear next to the overbought trigger. This information is very helpful when trying to find a trade to put on immediately, because you can filter down the backtests that performed well in the current environment. You can also toggle on “Select each current environment of [ticker]” and the table will only show backtests that have been tested with any combination of the current environment entry triggers.

Exit criteria
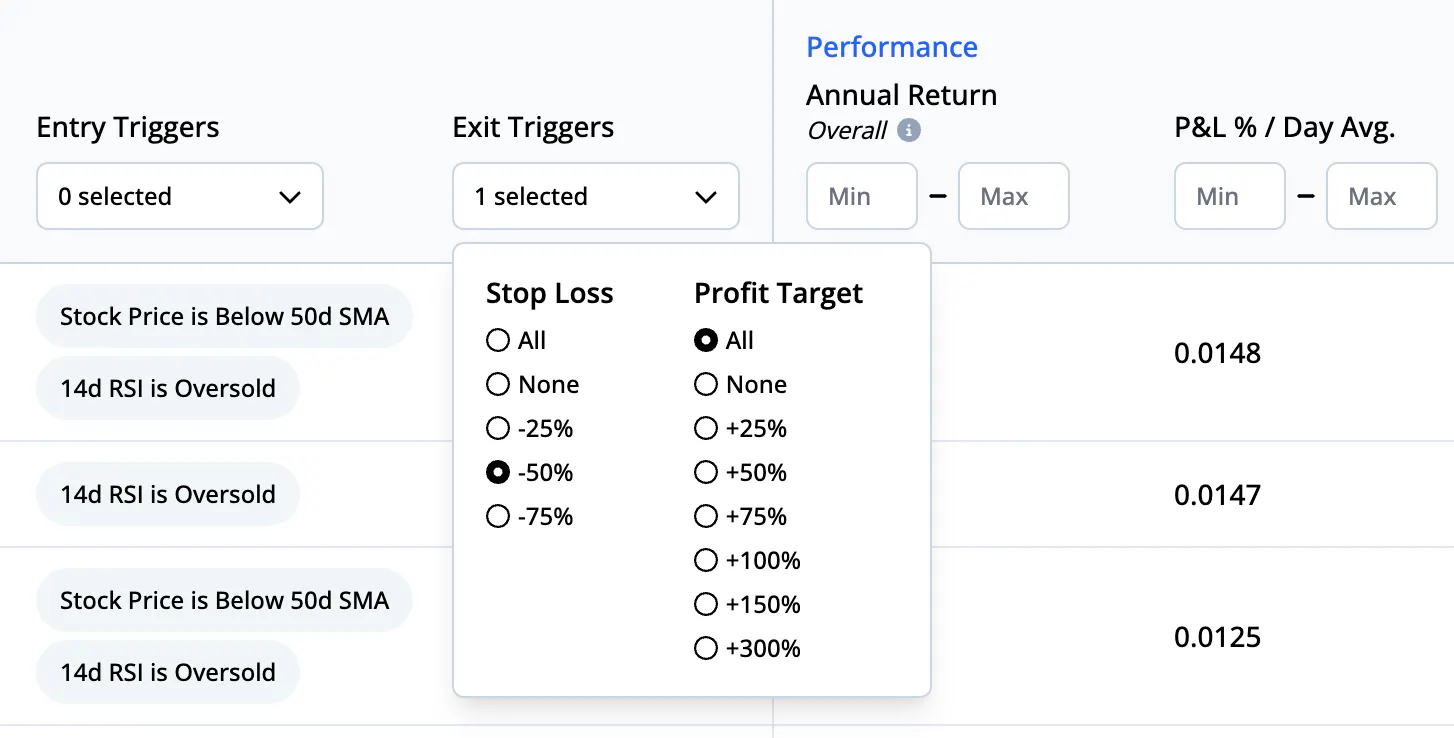
Exit triggers play a crucial role in risk management and profit protection. We test stop loss levels of -25%, -50%, and -75% to protect from excessive losses. For locking in profits, we test profit targets of +25%, +50%, +75%, +100% (if debit strategy), +150% (if debit strategy), and +300% (if debit strategy). Like all other entry criteria and triggers, you can filter the table down to backtests that only test a specific stop loss or profit target.

