200 - Volatility research
Volatility around earnings
Now that we've discussed term structure, skew, and the SMV process for calculating accurate IVs, it's time to discuss how we can utilize these factors to produce an effective forecasted volatility surface.
How earnings affects IV
You can't talk about implied volatility without also talking about earnings. Since an earnings announcement can send a stock soaring up or crashing down, this expected movement is reflected in the term structure. Let's talk about why this happens.
How it works
There is a technical explanation as to why implied volatility rises before earnings. Let's look at an example. If we have a stock trading at $100 with a 25% implied volatility, this means that there is a 68% chance that the stock will be trading between $75 and $125 exactly one year from now. Why 68%? That's the probability encompassed by 1 standard deviation of movement.
Now, imagine that the same stock had an earnings announcent in 11 months. There is a chance that it outperforms or underperforms expectations, which would lead to a larger than normal movement in the stock price. So, instead of the range being between $75 and $125, it might be between $70 and $130. Now, the implied volatility should be measured at 30% instead of 25%.
Keep in mind that this example is describing stock volatility, but the same principle applies to volatility in options pricing.
Why it's important
The phenomenon described above is called the earnings effect, or the tendency for implied volatility to increase heading into earnings. This is very important to recognize when creating a forecasted volatility surface. If we don't account for earnings, the valuable information baked into the IV may be lost.
Just as importantly, we wouldn't be able to compare the volatility surface to ETFs (which don't have earnings) or to its own history (because earnings dates can be inconsistent).
So, how do we measure the earnings effect?
Calculating ex-earnings IV
We measure both the earnings effect and the resulting ex-earnings IV (the residual IV after taking out the earnings effect). We've spent years fine tuning methods to calculate these indicators.
Calculating the earnings effect
To calculate the earnings effect for each expiration, we follow these steps:
- Make accurate implied volatility calculations by using inputs like interest, dividends and residual rates (this is our SMV process described in earlier lessons).
- Apply accurate earnings announcement dates to determine how many earnings apply to each expiration.
- Solve for an implied earnings effect that makes the most rational resultant monthly implied volatility relationships.
For example, consider a stock that announces earnings 8/30/2018 after the close. Presented below is the method for extracting earnings from IV. See the at-the-money IVs for each expiration, post removal of earnings effect IV, and the portion of the IV that is applicable to the earnings announcement move:
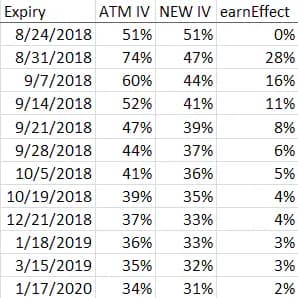
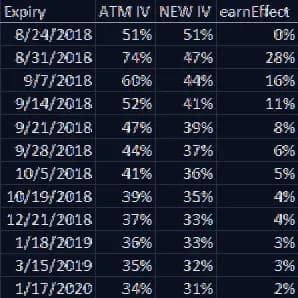
The 8/24/2018 expiry does not have an earnings effect. 8/31/2018 has the largest earnings effect (since the earnings effect will have a greater percentage of days relative to the number of days to expiration). Notice how the method solves for a new IV term structure. This new IV term structure is then summarized using interpolation described below.
Interpolating days
After calculating the earnings effect, we simplify the term structure down to a smooth surface across time. It's much easier to compare the IV of different expirations when they are boiled down to a digestable number. We use an interpolation process to calculate the 10, 20, 30, 60, 90, 180 and 365 day constant implied volatility.
For example, if we were looking at the 30-day implied volatility, we might use a 26 day and a 33 day expiration and weight the 33 day slightly more because it is 3 days away from target of 30 and the 26 is 4 away. Moreover, if the earnings announcement is in 28 days, the portion of the IV attributable to earnings will be removed from the IV of the 33 day expiration (the 26 day expiration would not have an earnings effect).
Interpolating deltas
Just as with expiration dates, we also interpolate the IVs across different deltas to further simplify the term structure. We present the 5, 25, 50, 75, and 95 delta IVs for each of the constant maturity expirations.
Implied earnings move
Note that the implied earnings effect is different than the implied earnings move. The implied move is a common term in options trading, and references the percentage move of the stock price implied by the at-the-money IV relationships. It is commonly used to help determine the viability of straddle and strangle strategies.
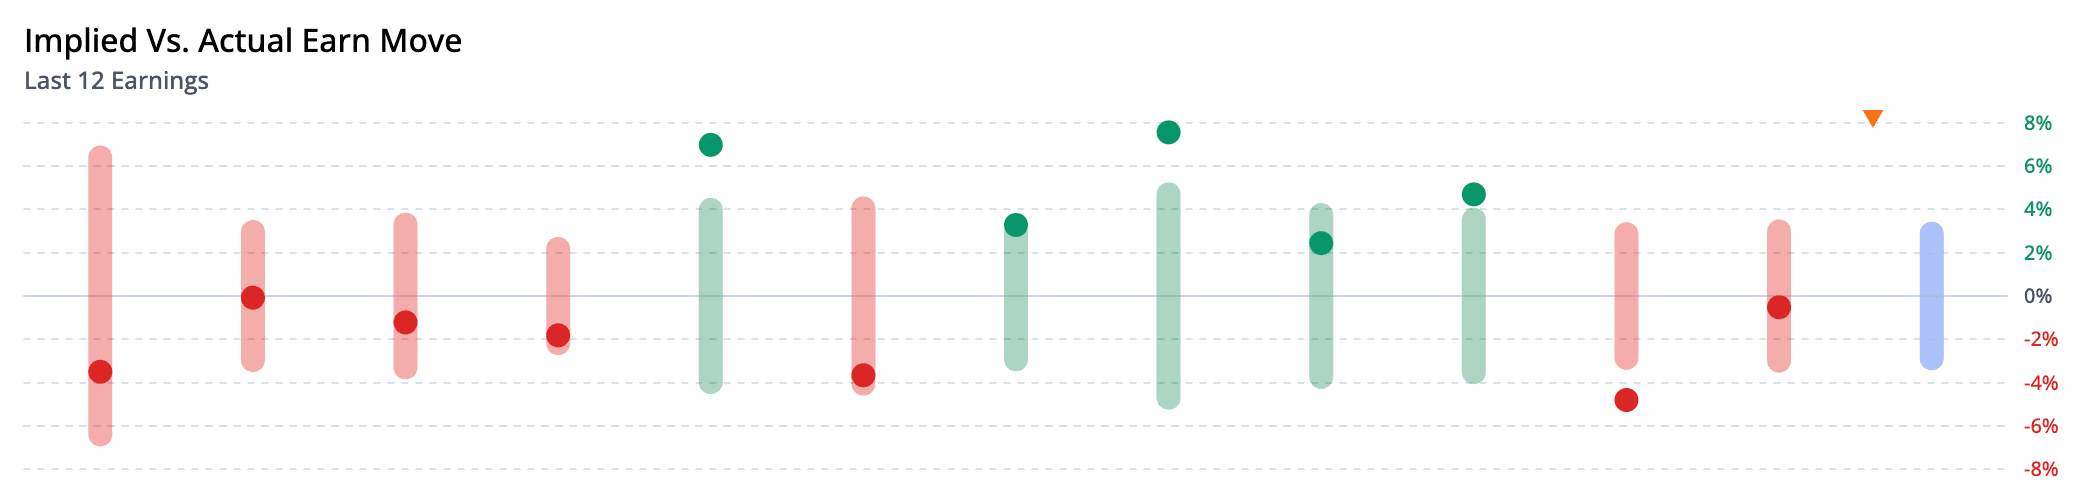
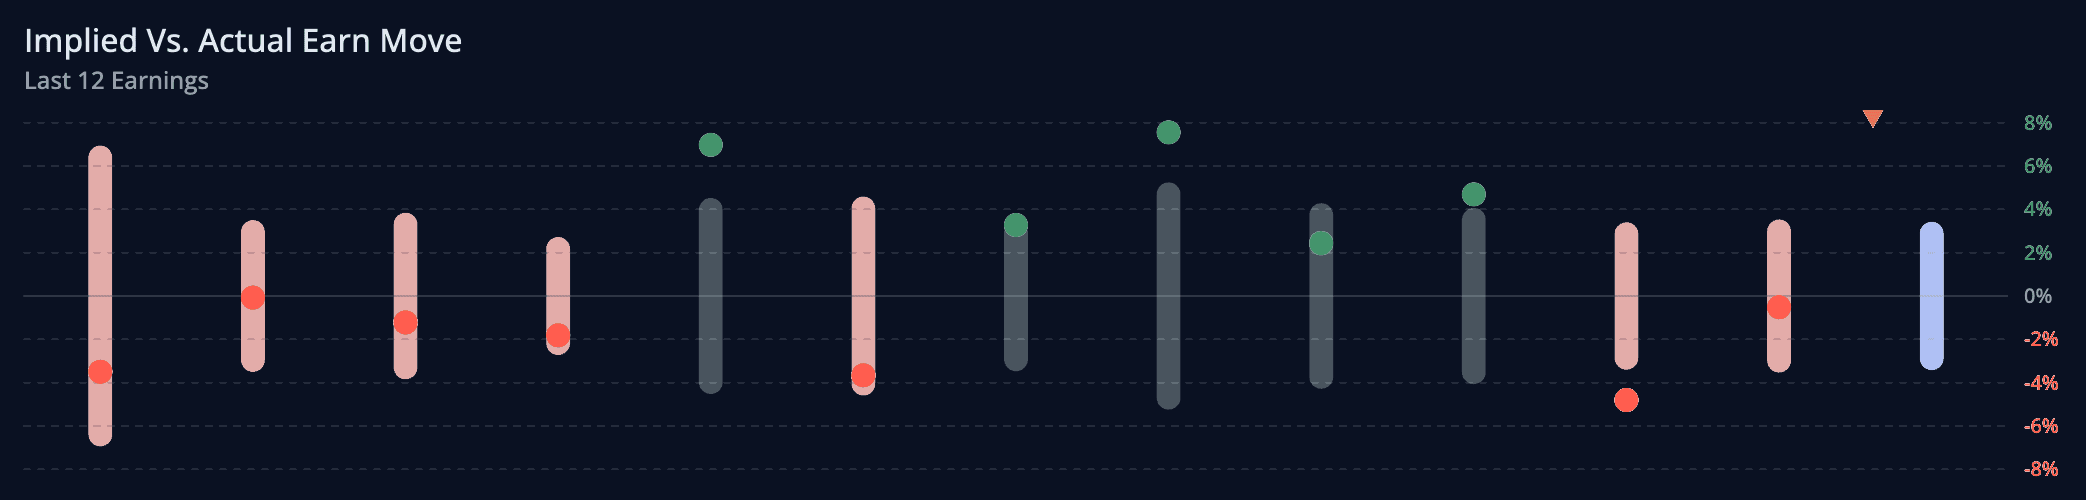
In the example below, we are looking at the implied earnings move (lighter bar) vs. the actual earn move (solid dot). When the actual move is outside the implied range, long straddles were profitable. When the actual move is inside the implied range, that is more profitable for short straddles.
Inter-earnings IV and HV
When analyzing earnings in the graphic above, we can also consider inter-earnings IV and HV. This relationship looks at the last three calendar months and compares the historical volatility (inter-earnings HV) to the IV for the upcoming quarter (inter-earnings IV). Both are measured directly after the announcement.
The goal of this calculation is to see if the upcoming IV is overshooting the HV for the period leading up to an announcement.
Forecasting the volatility surface
Now that we've accounted for the earnings effect and defined a smooth surface across time to expiration and delta, we are now ready to integrate historical data into our model to help produce a forecasted volatility surface.
Using historical data
ORATS stands out from its competitors because of our tremendous asset coverage for US equity options. We've been gathering end-of-day options data for over 5,000 tickers since the beginning of 2007, and one-minute options data since August 2020. We use all of this data to fine-tune our forecasts of the IV surface.
Forecast parameters
We produce an effective forecasted volatility surface using the following parameters:
- 20 business day (~1 month calendar) forecast of future statistical volatility - This forecast is based on observations often back to 2007 of historical volatility using a modified Parkinson method.
- Infinite forecast of statistical volatility - This forecast is based on observations of the IV term structure.
- Earnings forecast - We considers day of and day after earnings, seasonality, recentness, median and average of move divided by expected move.
- The steepness of the IV skew (slope)
- The curvature of the IV skew (deriv)
Given the at-the-money implied volatility, the slope and the deriv, an implied volatility can be calculated for each strike. We do this for different days to expiration by interpolating between the at-the-money values and the infinite values. We also produce metrics on the accuracy of these forecasts.
Bringing it all together
To find an edge, it's useful to compare theoretical values to market values to determine what is overvalued and undervalued. Our method of producing a forecast can be summarized into three steps that we've covered throughout our lessons so far:
- Use the SMV process to calculate accurate implied volatilites across all strikes and expirations.
- Calculate and omit the earnings effect and use interpolation to create a smooth surface across time to expiration and delta.
- Summarize the volatility surface into digestible indicators like slope, deriv, and contango.
By following these steps, we're finally ready to use the power of the indicators we've created to help develop a trading thesis.


