200 - Volatility research
Predictive indicators
In the last lesson, we touched on some of the forecasted parameters we calculated using our methods of summarizing and manipulating the volatility surface. Let's dive into detail on some of these indicators, and how we can compare them across time and related equities.
Ex-earnings IV
IV is negatively correlated to stock performance, meaning that high IV is usually a bearish signal for the stock. We isolate the IV related to the stock by taking out the earnings effect to get an ex-earnings measure of IV. We interpolate the time to expiration to get a 30-day ex-earnings IV, which we can compare across time and related equities.
In the MSFT example below, we are comparing this value to XLK, to our forecast, and to its percentile reading over the last year.
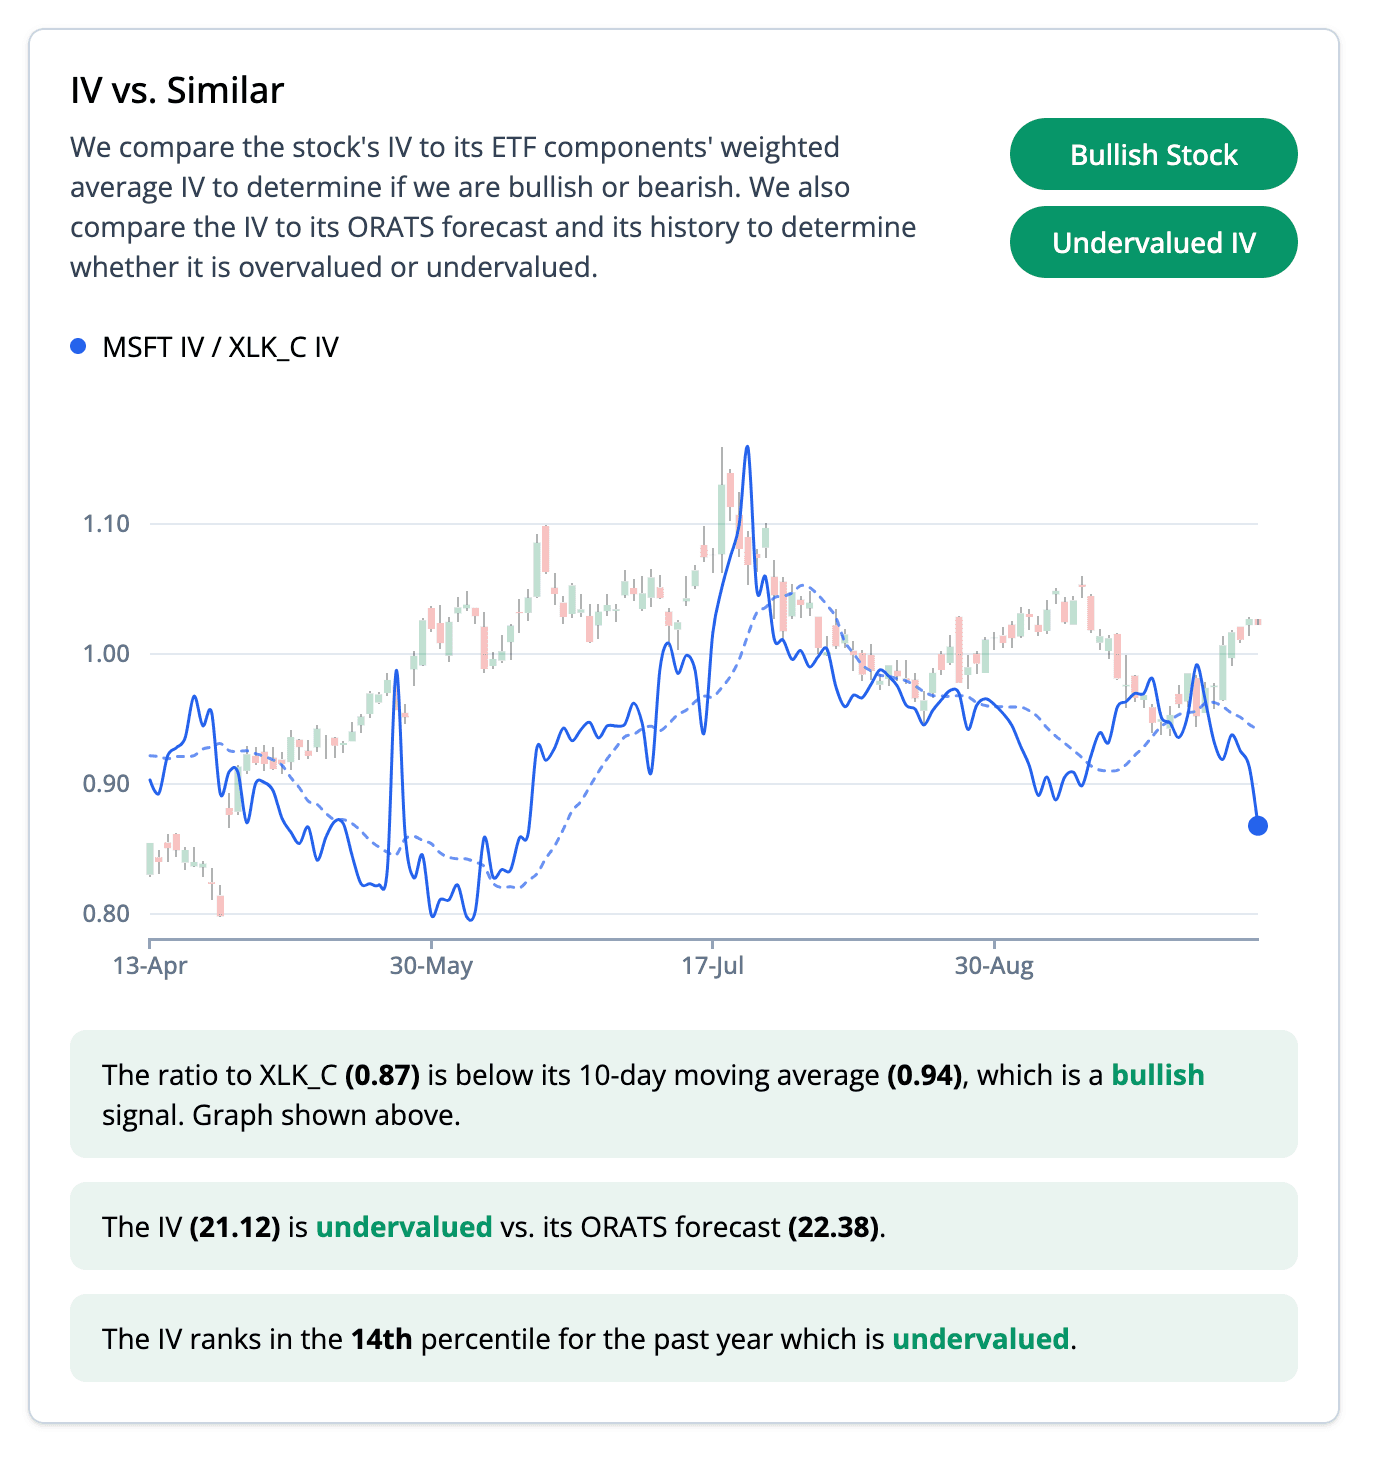
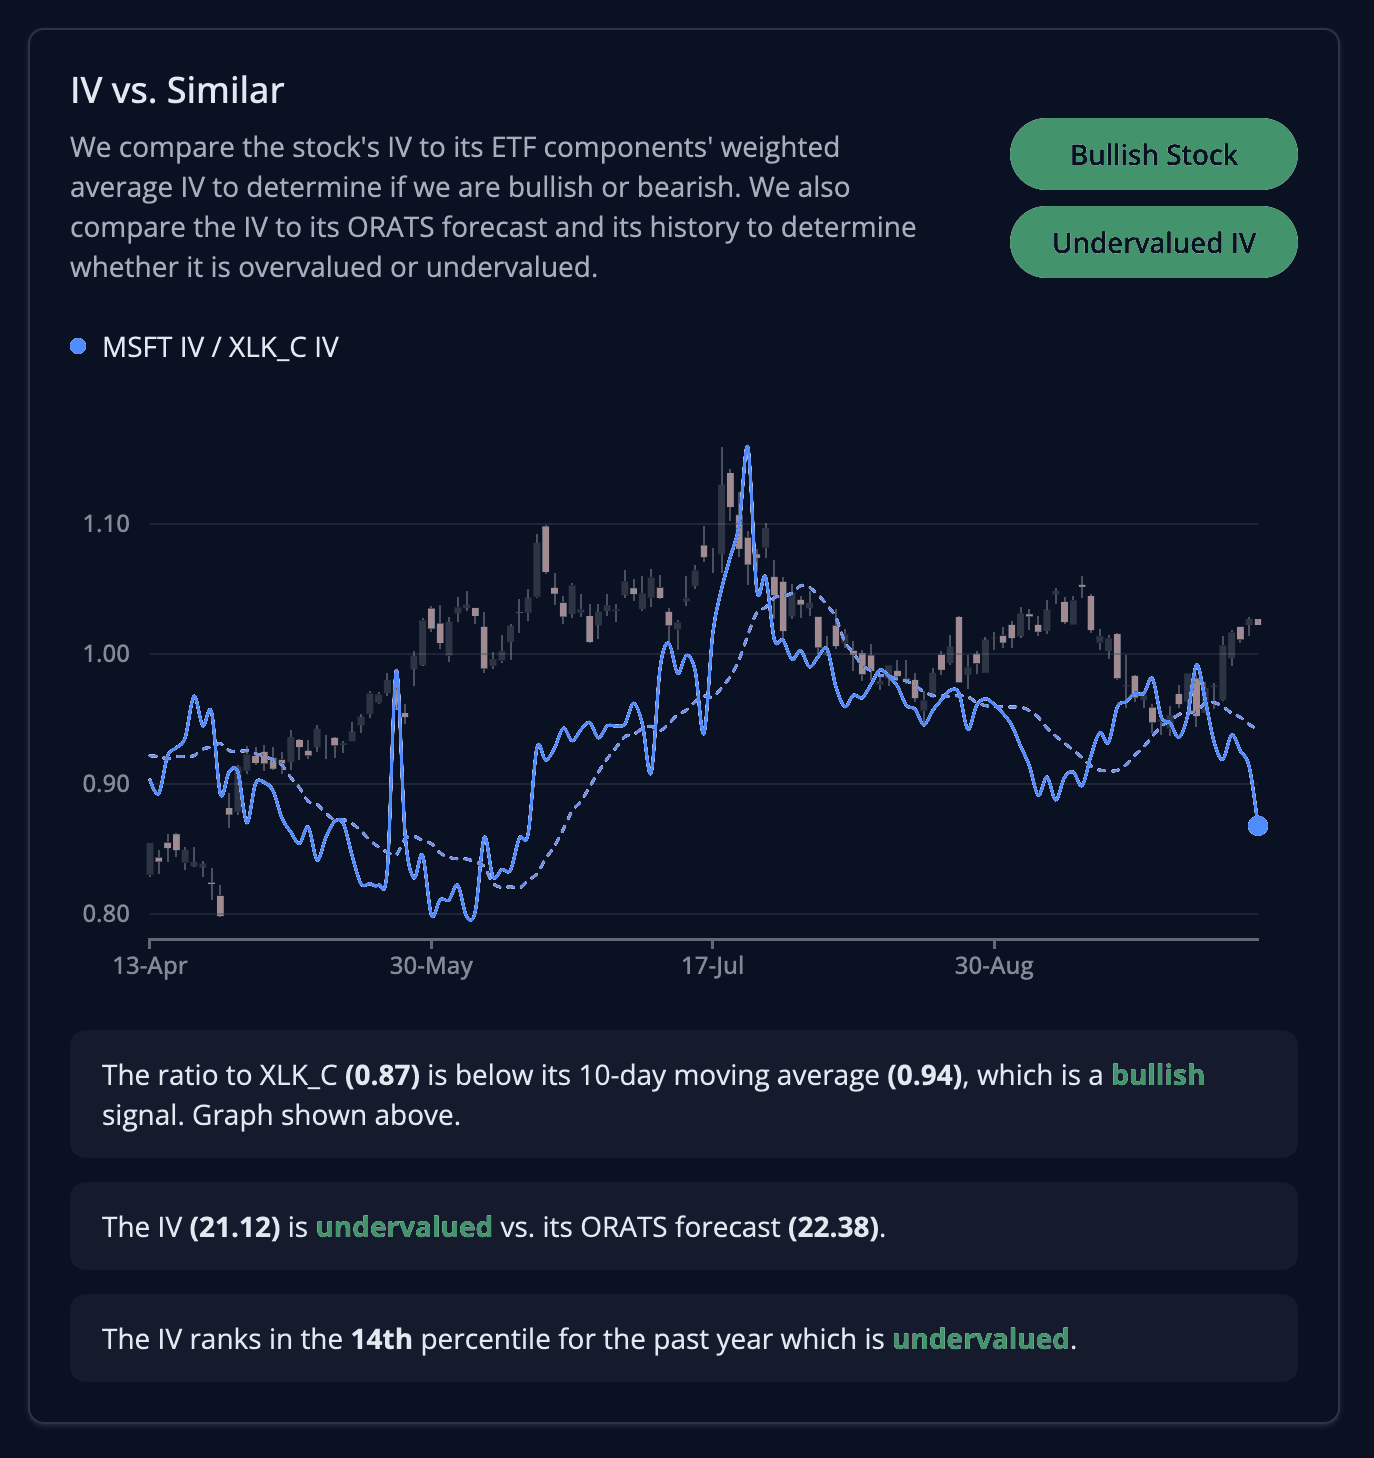
Vs. XLK_C: XLK is the technology sector, which is the closest SPDR sector ETF to MSFT. We offer a special ticker, XLK_C, that is a weighted average of all of the components in the ETF. We calculate the 30-day ex-earnings IV of XLK_C and compare it to MSFT to see if the IV trending up or down. If the ratio to XLK_C is below its 10-day moving average, then we say that this is a bullish signal, because IV is trending lower than the weighted average of components in the similar ETF.
Vs. Forecast: We compute the forecast of the 30-day ex-earnings IV by combining our vast historical data set with our advanced volatility surface summarization techniques. We compare this forecast of IV to the current IV to determine if it is over or undervalued. If our forecast is greater than the current IV, we say that the IV is undervalued.
Vs. Percentile: We look at the IV percentile of MSFT for the last year. This tracks the current IV relative to the values over the last year and ranks it accordingly. A low IV percentile indicates that IV is undervalued relative to its history.
Slope
Slope measures the steepness of the skew. Alone, it's not a very predictive, because it's just a reflection of how the IVs look from 0-100 delta.
One way we find if the slope is under or overvalued is to look at how the slope has changed recently. If the slope is higher than recent levels, lower strike puts are more expensive and the higher strike calls are cheaper than usual. If the slope is lower than recent levels, the lower strike puts are cheaper and the higher strike calls are more expensive than usual.
Thus, we can say that an overvalued skew is generally best for risk reversal strategies, and an undervalued skew is best for collar strategies. In the example for IWM below, we observe how the slope compares to the best ETF, to its forecast, and to its percentile ranking:
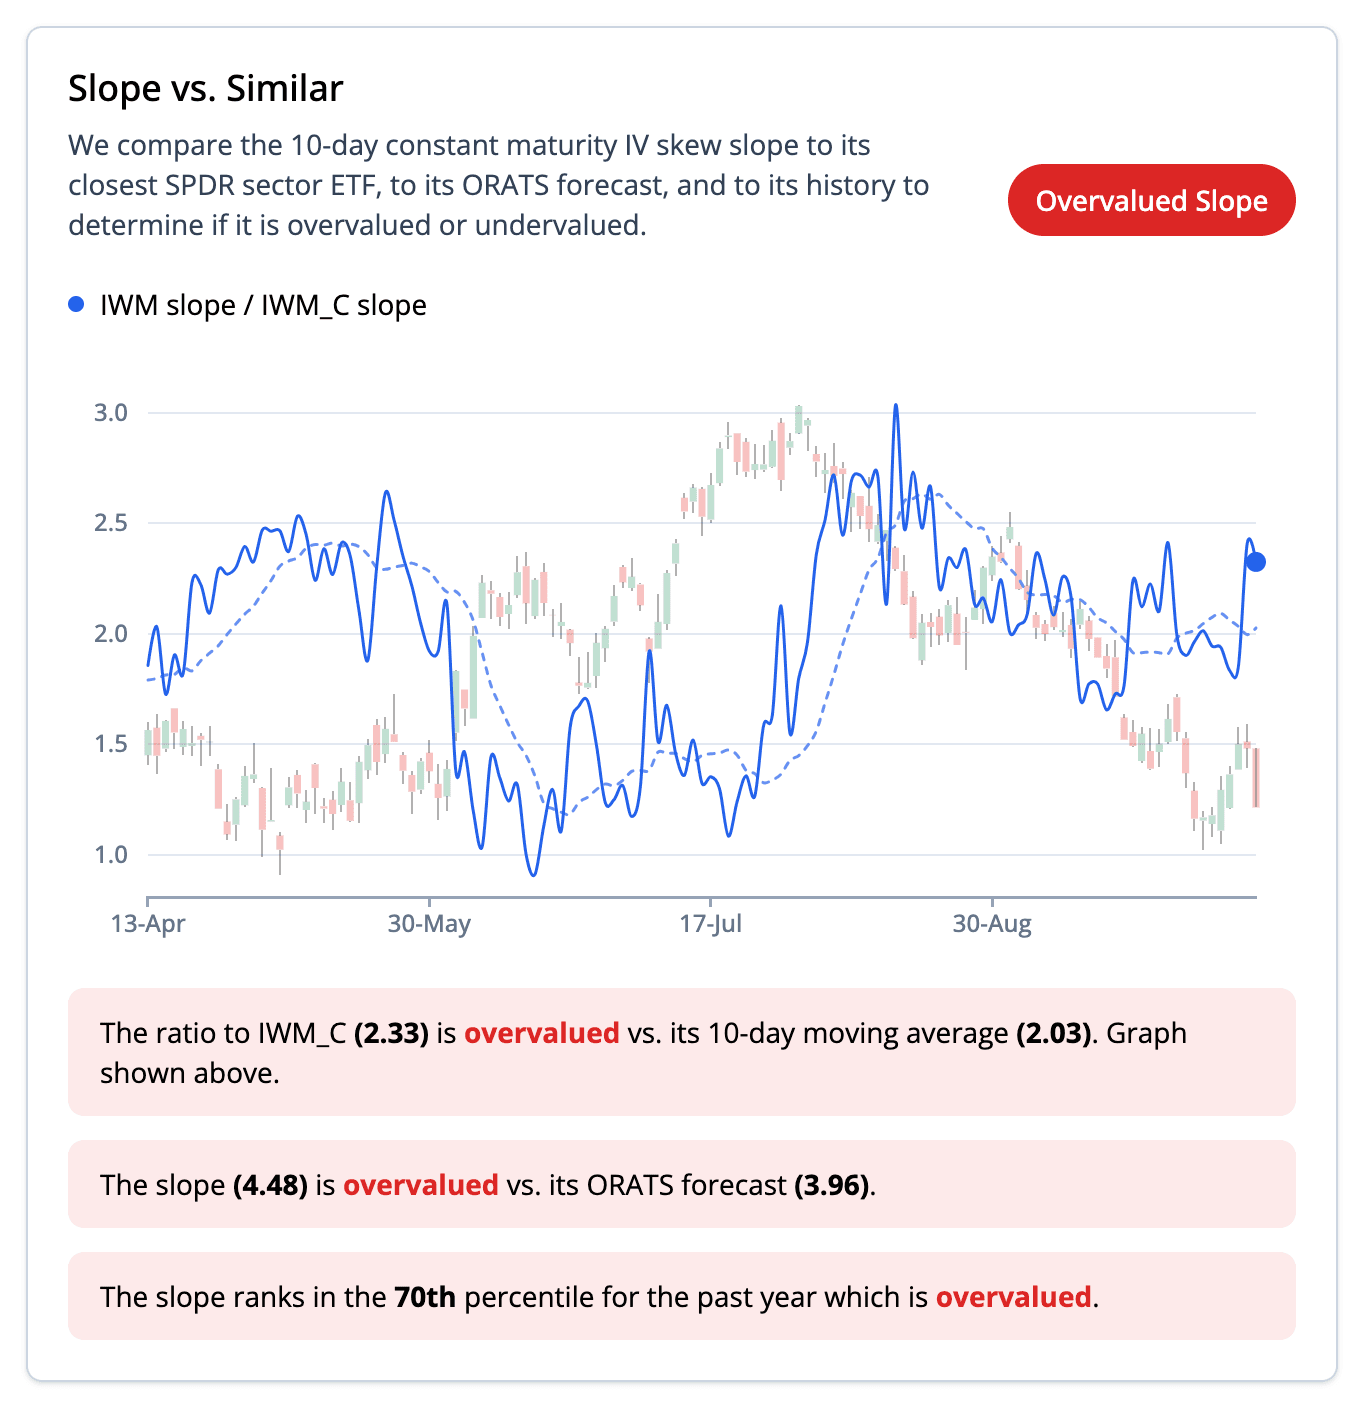
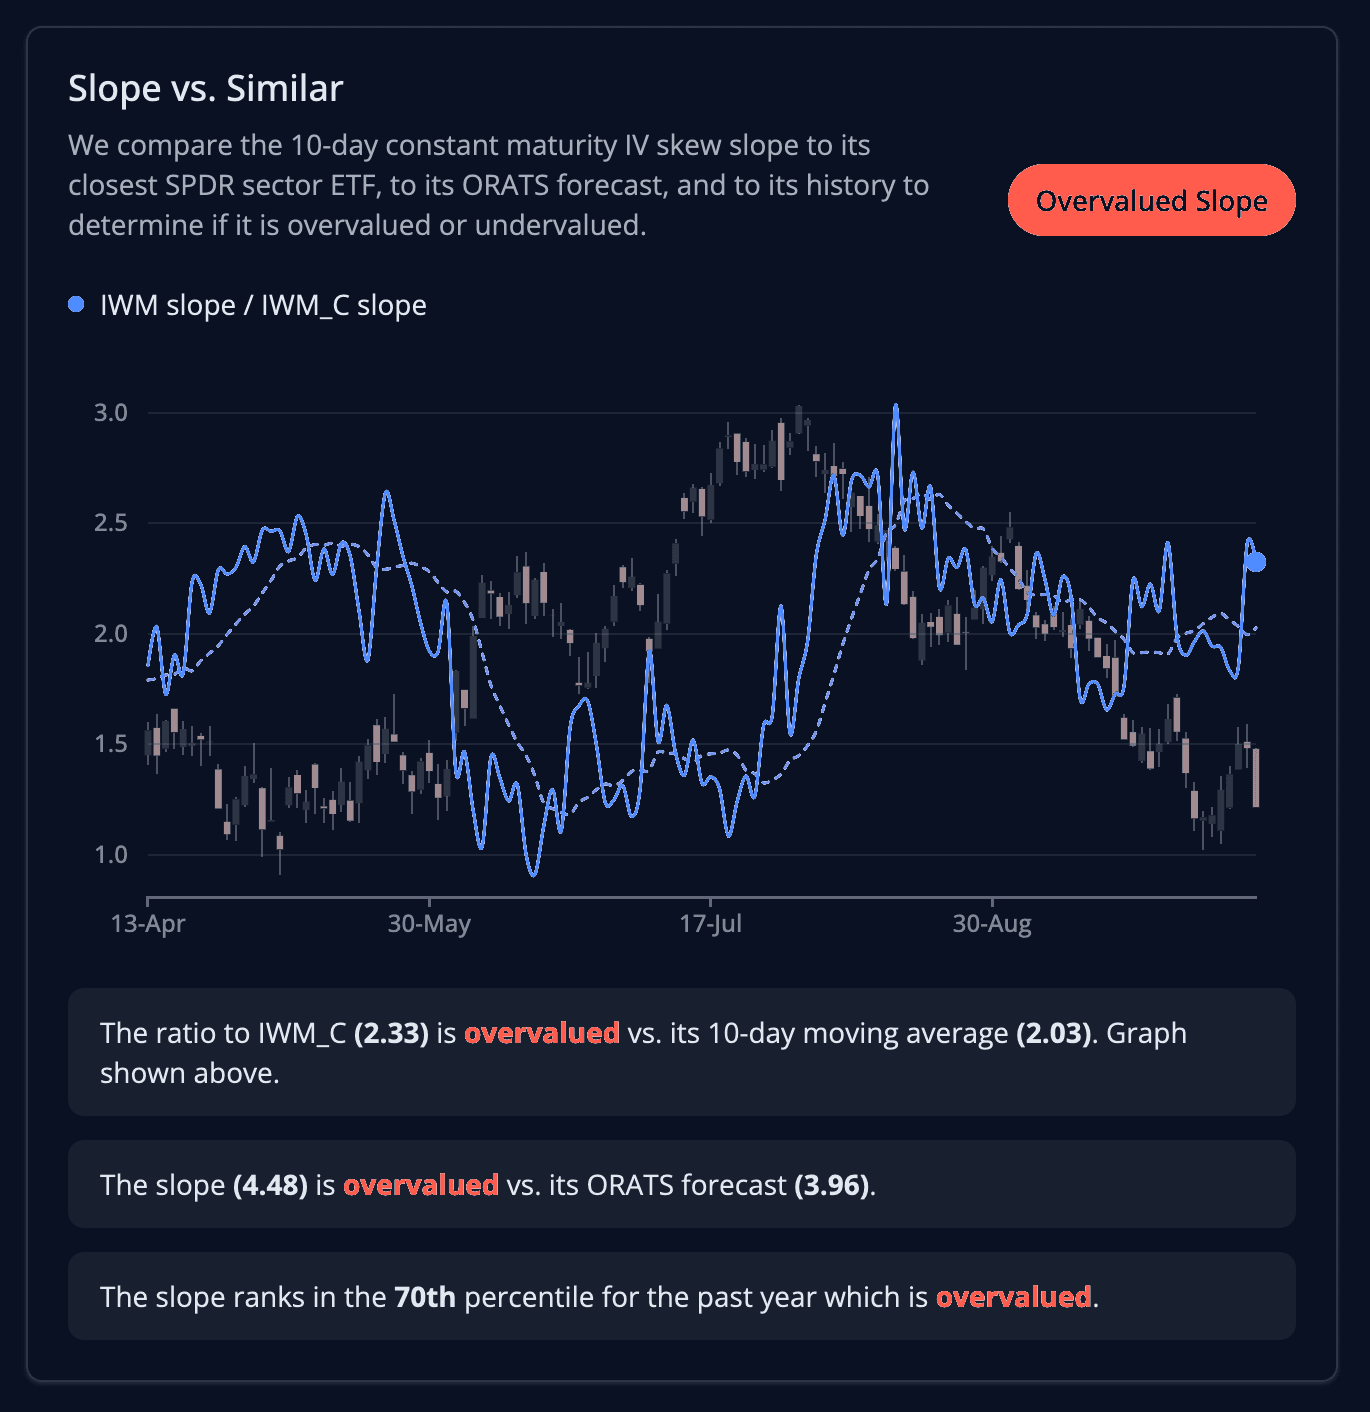
Vs. IWM_C. Since IWM is an ETF itself, we are comparing the slope to the weighted average of its own components' slopes. If we look at the ratio and compare it to the 10-day moving average, we can see that the ratio is trending higher, which indicates that the slope for IWM is overvalued.
Vs. Forecast: ORATS computes both a 30-day forecast of slope and an infinite forecast of slope using our historical data set and volatility summarization techniques. Comparing the current slope value to the forecast of slope can help determine if the slope is over or undervalued. If our forecast is less than the current slope, we say that the slope is overvalued.
Vs. Percentile. We measure the slope percentile for IWM over the last year. A high slope percentile indicates that slope is overvalued relative to its history.
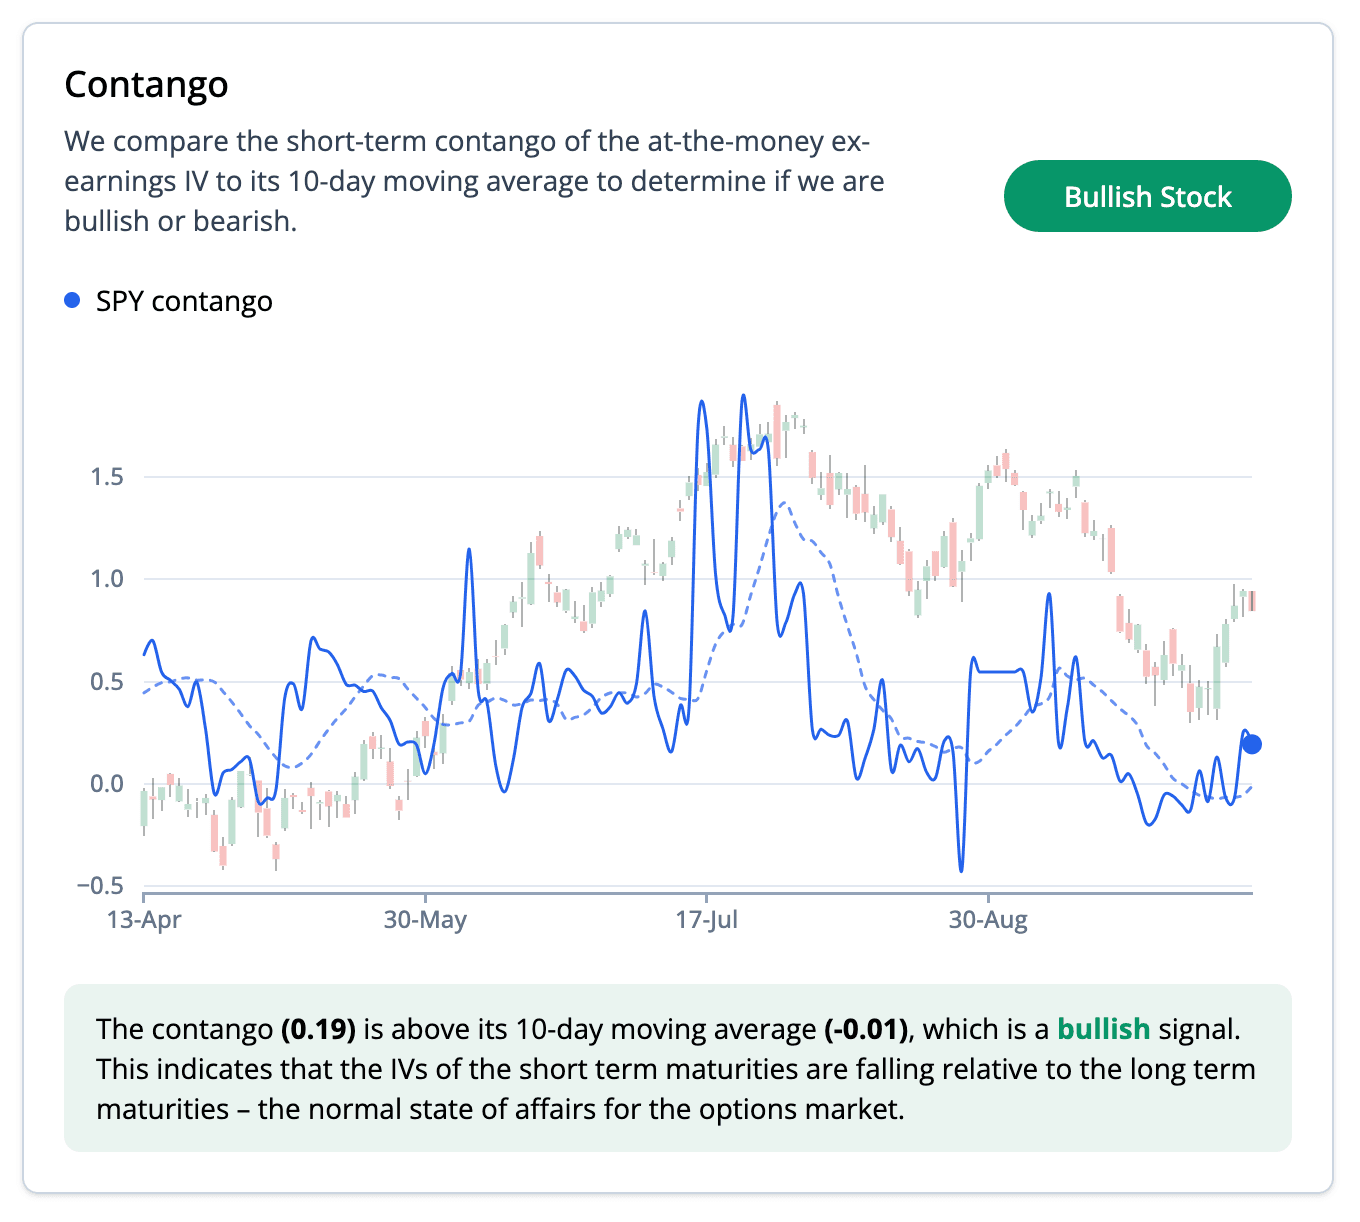
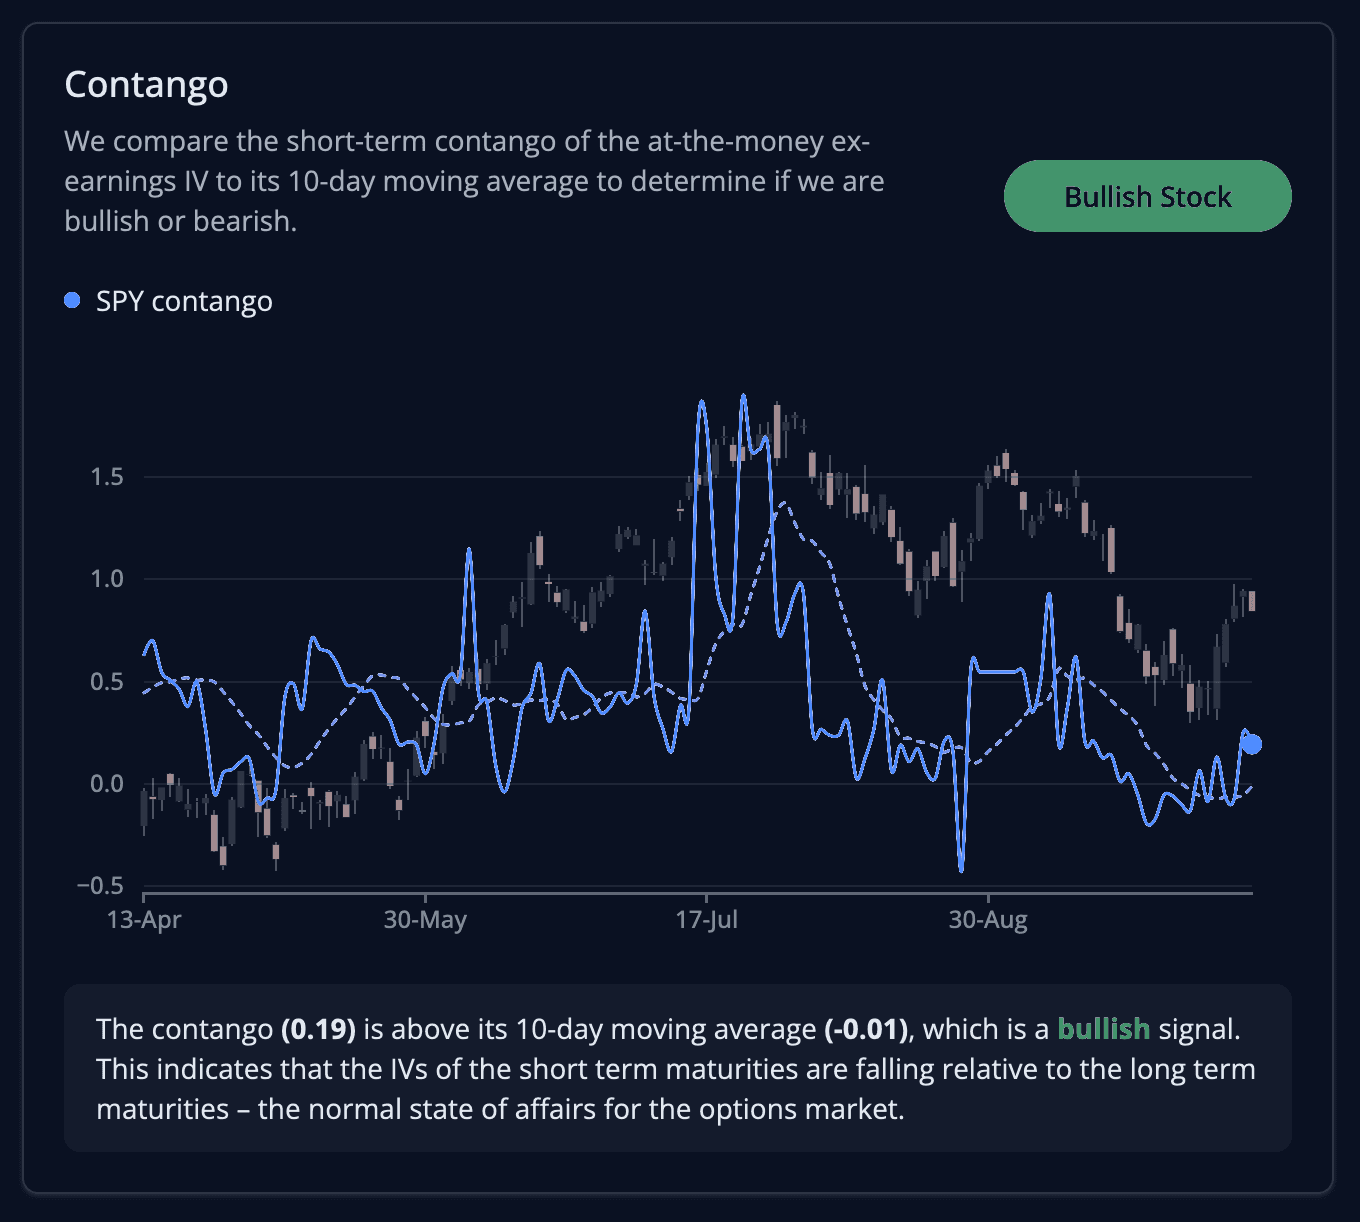
Contango
Contango is positively related to stock performance. It measures the slope of the at-the-money ex-earnings IVs from the shorter-term expirations (<45 days out). We've found that the term structure for 45 days out is an important signal because traders get more leverage using shorter term options.
When contango is positive, this indicates the shorter term IVs are lower than the longer term. This is the normal state of affairs for the options market. When it's negative, we call this backwardation. We see that when contango flips to backwardation, this can be a bad sign for the market.
Below is an example graph of contango for SPY, where we compare it to the 10-day moving average.
Forward vs. Flat Forward IV
We offer two additional measurements of IV for both the regular IV and the ex-earnings IV. These are the forward and flat forward calculations.
Forward volatility measures future implied volatility based on close observations of the term structure. These calculations help normalize calendar pricing, which can in turn expose anomalies in the term structure. Let's look at an example calculation:
- Assume the 20d IV is 9.1% and the 30d IV is 9.6%.
- Logically, if the volatility was 9.1% for 20 days, in order for the 30 days to be worth 9.6%, for the 10 days after the 20 days and before the 30 days the stock would have to move more than 9.6% in order to move the average up to that number.
- The calculation for the standard forward volatility finds this ten-day forward volatility to be 10.5%.
We measure forward volatility for five different time periods:
- 20d and 30d
- 30d and 60d
- 30d and 90d
- 60d and 90d
- 90d and 180d
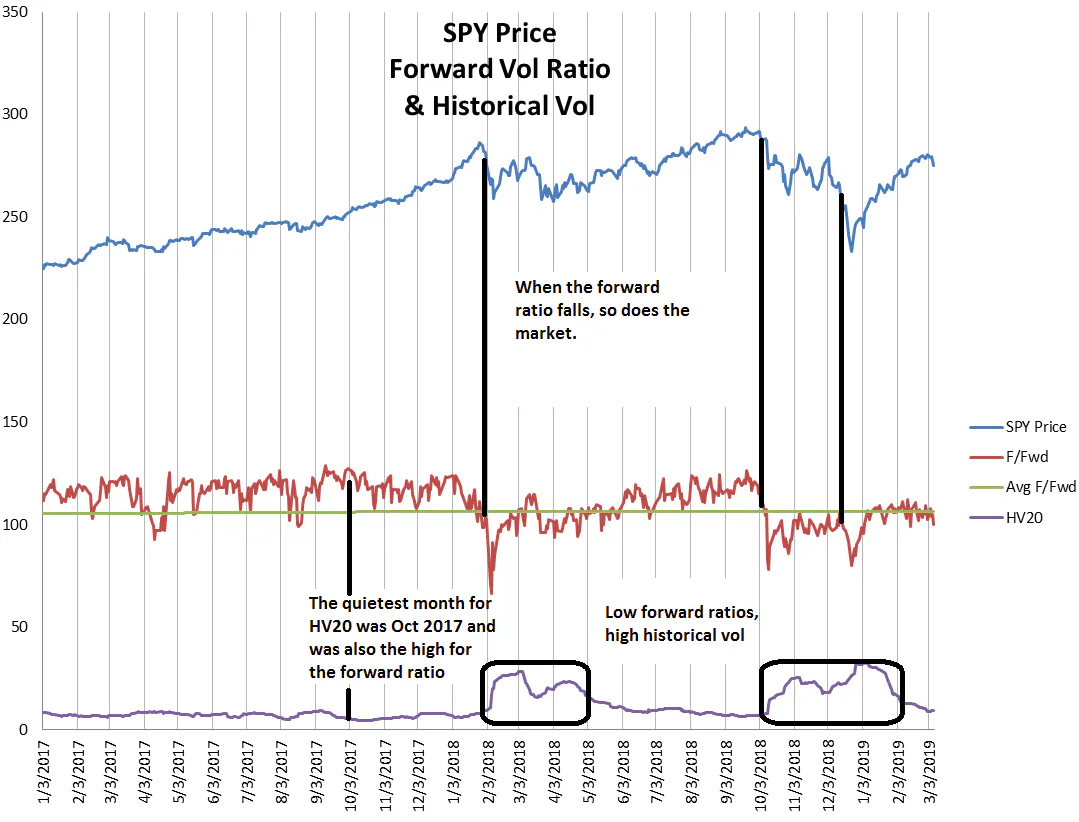
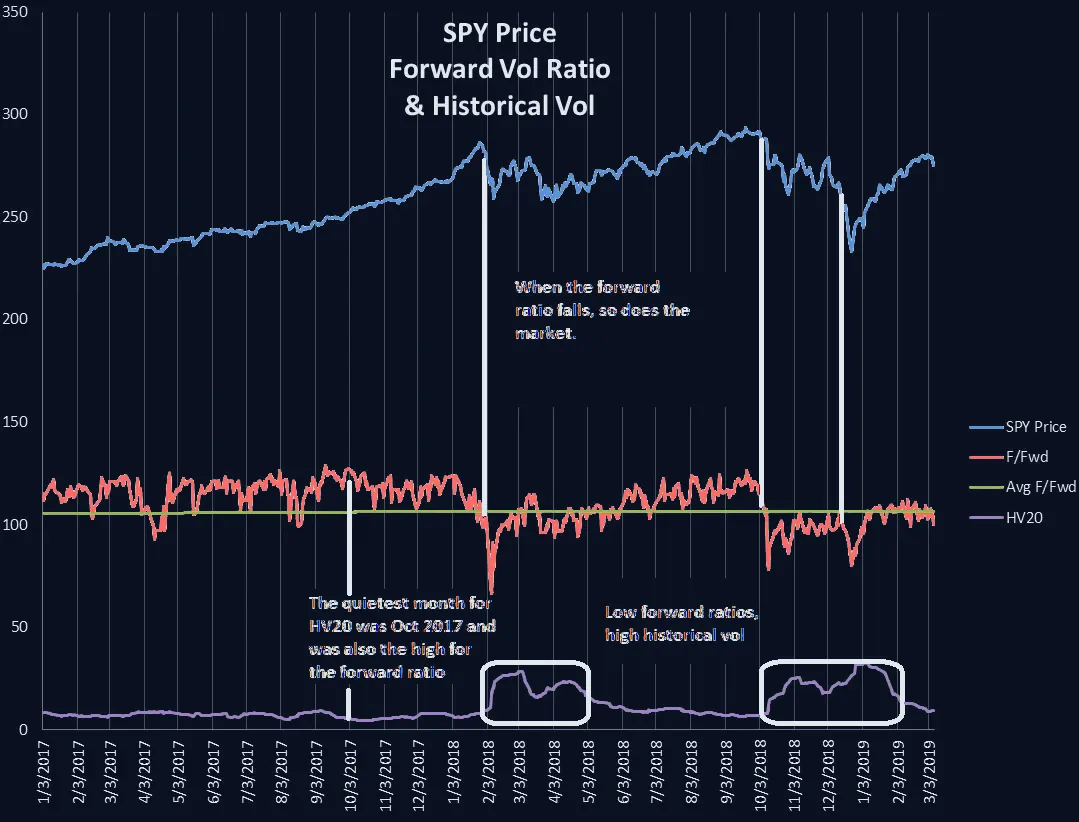
We also calculate a second measurement called flat forward. The calculation is a bit more involved, so we won't discuss it here. But, we've found the ratio of flat forward to forward to be a good signal for foreshadowing movement in the underlying instrument.
In our studies, extremes in the ratio of the flat forward and regular forward led to extremes in the underlying stock movement.
Let's look at two very different scenarios, the quiet 2017 and the volatile February 2018. The quietest month of 2017 was October (ironically) with a historical volatility of 5.4%. Oct 2017 was also the high of the forward ratio. The volatile February 2018 was preceded by a drop in the forward ratio. And so was the volatile October 2018 and December 2018.
Other Indicators
We measure several other important indicators like historical volatility, confidence, borrow rate, and deriv. The ratios of these indicators to other indicators also hold predictive value, and are used in tools like our backtester, stock scanner, and option scanner to help you make better trades.
Our proprietary indicators are rooted in our vast set of historical options data. In the next lesson, we'll go over the different types of historical data available to you.


