300 - Backtesting
Optimizing your strategy
After creating or finding backtests, the natural next step is optimization. The ORATS Strategy Optimizer is a powerful tool that enhances your trading strategies by intelligently adding proprietary indicators and technical analysis to improve entry timing and overall performance.
The power of data-driven optimization
Many traders fall into the trap of over-optimizing their strategies based on gut feelings or random parameter adjustments. This often leads to curve-fitting - creating a strategy that performs exceptionally well on historical data but fails in live trading. The ORATS Optimizer takes a different approach by using statistical validation and permutation testing to ensure your improvements are real, not random.
The key differentiator in our optimization approach is the P-value calculation. This statistical measure tells you the probability that your strategy improvements occurred by chance. A P-value below 0.05 means there's less than a 5% chance the improvement is random - giving you confidence that the optimization is meaningful and likely to persist in future trading.
How the Optimizer works
The Optimizer follows a systematic three-step process to enhance your trading strategies:
Step 1: Choose your foundation strategy
Start by selecting a strategy to optimize. You have three flexible options:
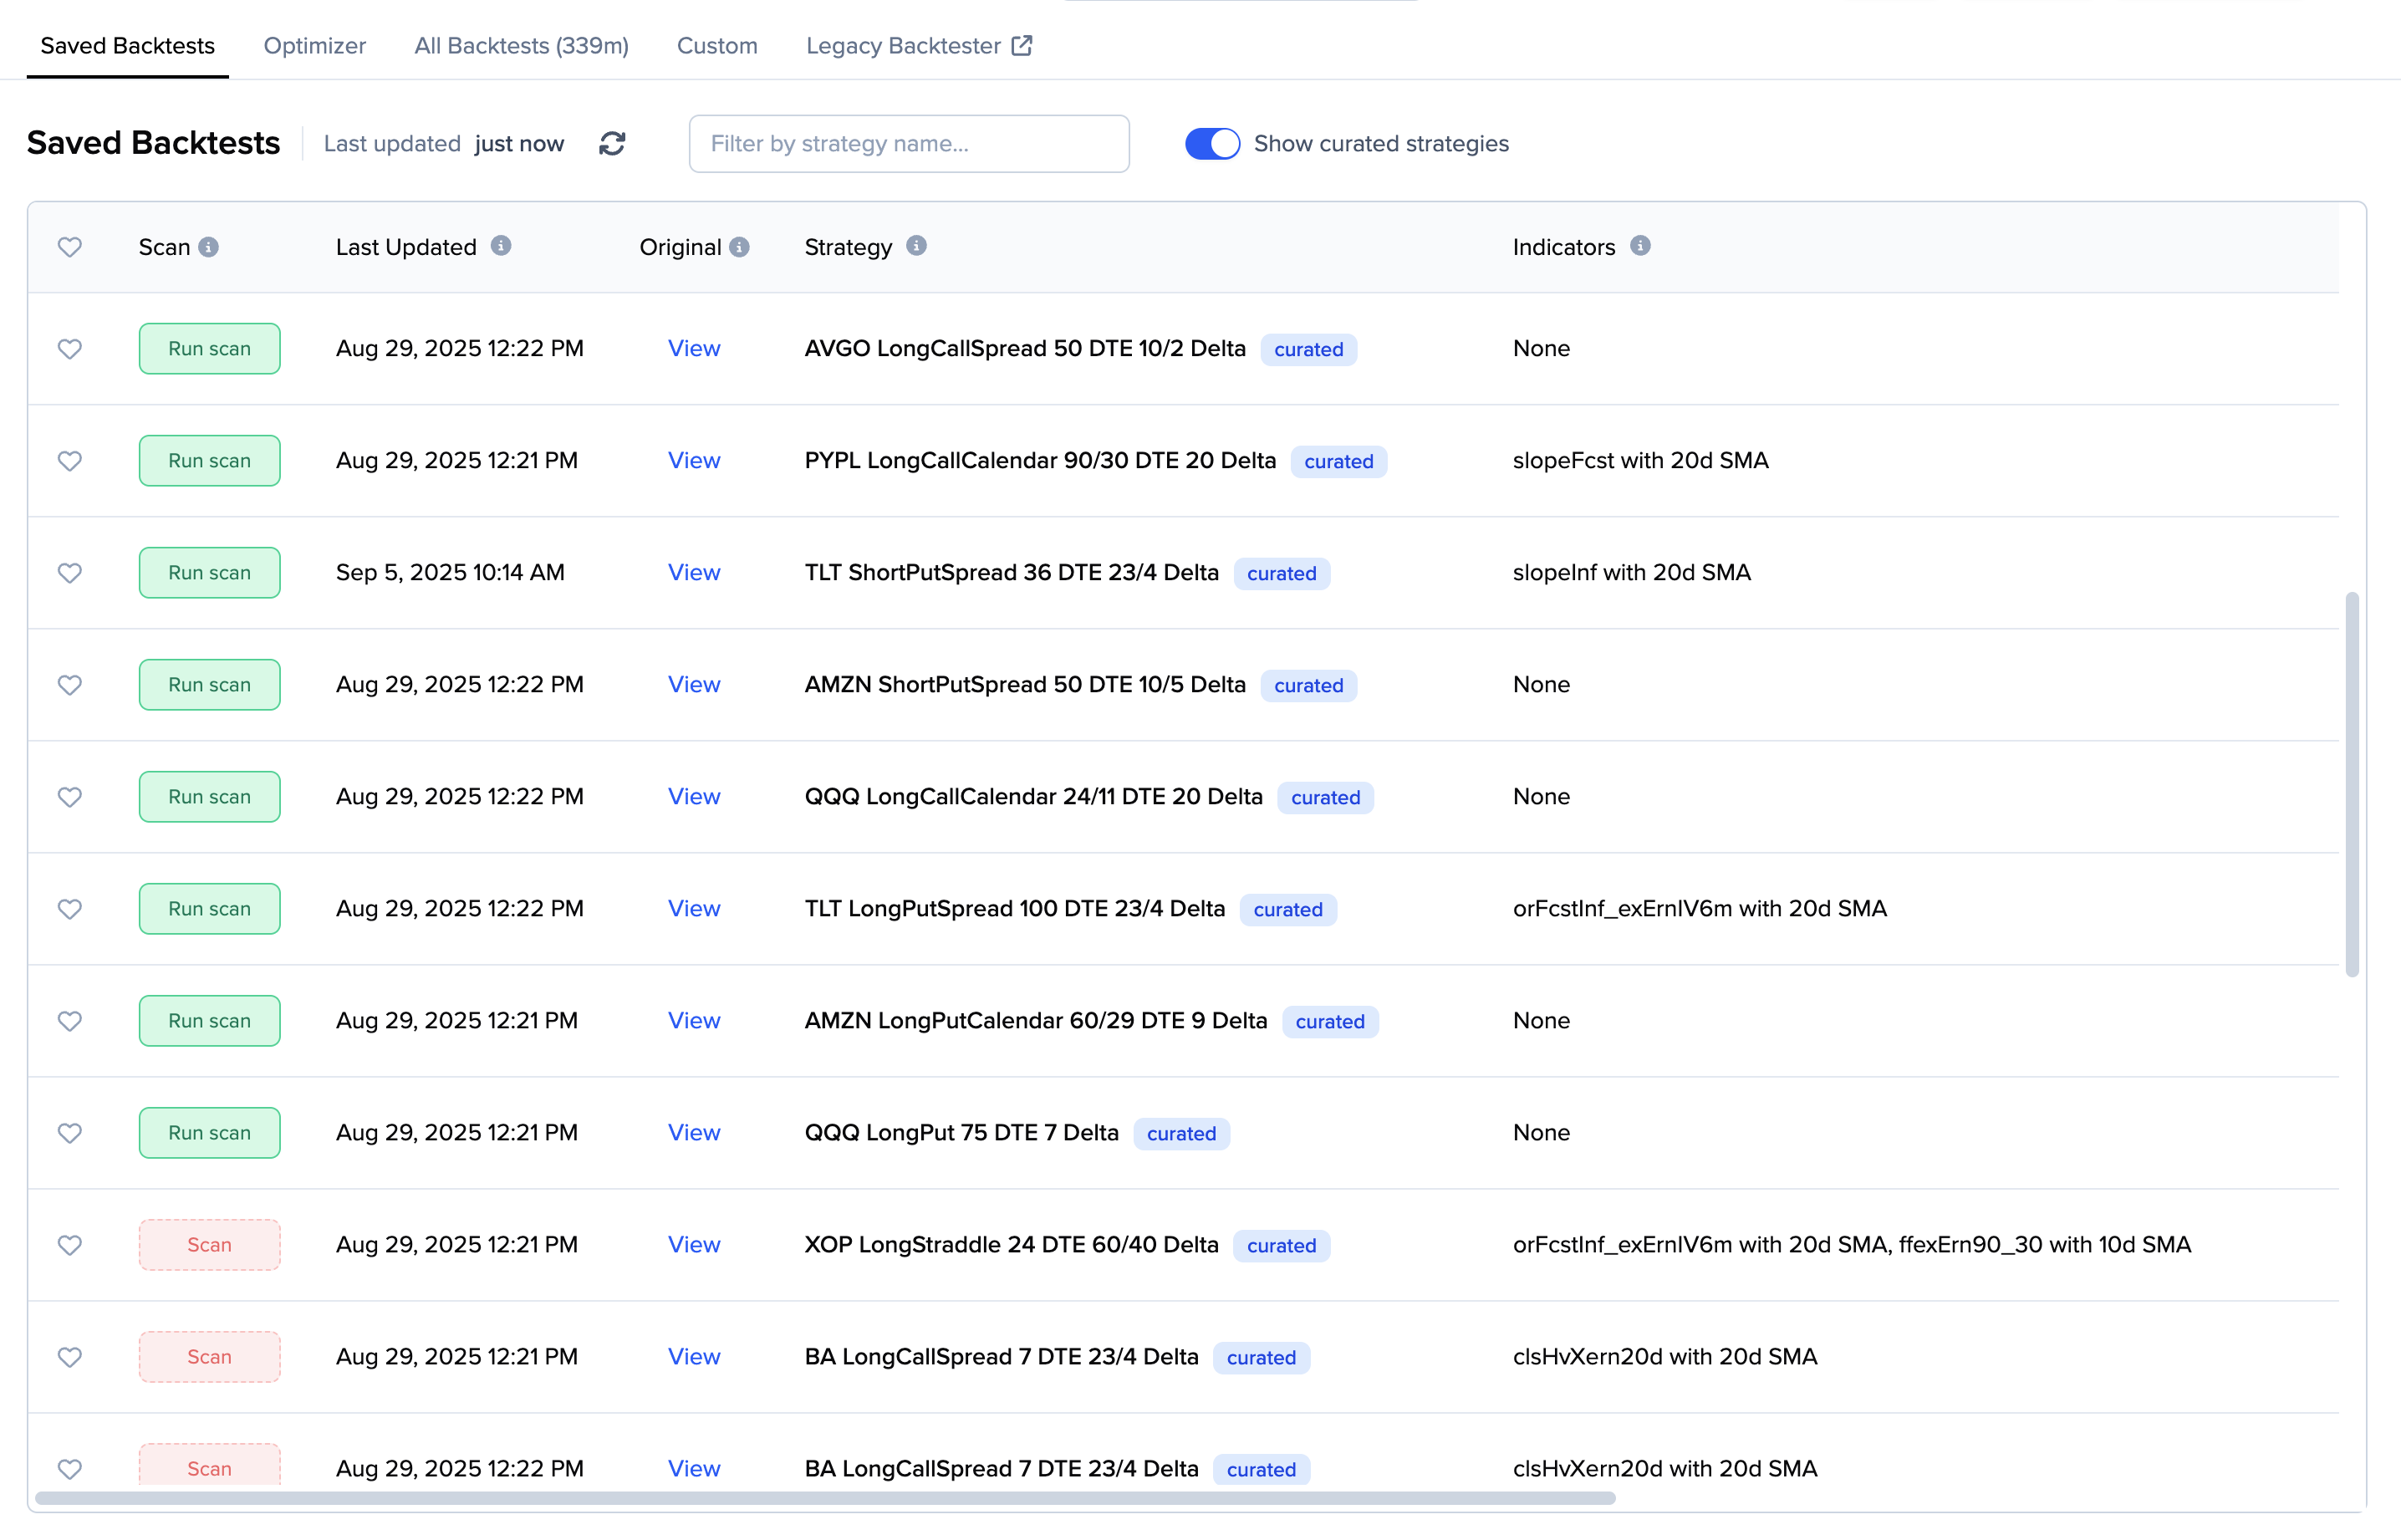
- Your saved backtests: Use any of your previously created and saved backtest strategies as the starting point. The Optimizer will load all the original parameters including entry/exit rules, DTE ranges, and delta targets.
- Browse existing backtests: Choose from over 300 million pre-calculated backtests across 100+ symbols and 15 strategies. Use the backtest finder to filter by strategy type, performance metrics, or specific symbols.
- Create a simple strategy: Start with a basic long or short stock position and build from there. Simply enter a symbol (like AAPL or SPY) and choose long or short direction.

Each strategy serves as the foundation that the Optimizer will enhance with additional indicators and rules. The system automatically loads historical performance data to establish a baseline for comparison.
Step 2: Add intelligent indicators
This is where the magic happens. The Optimizer gives you access to:
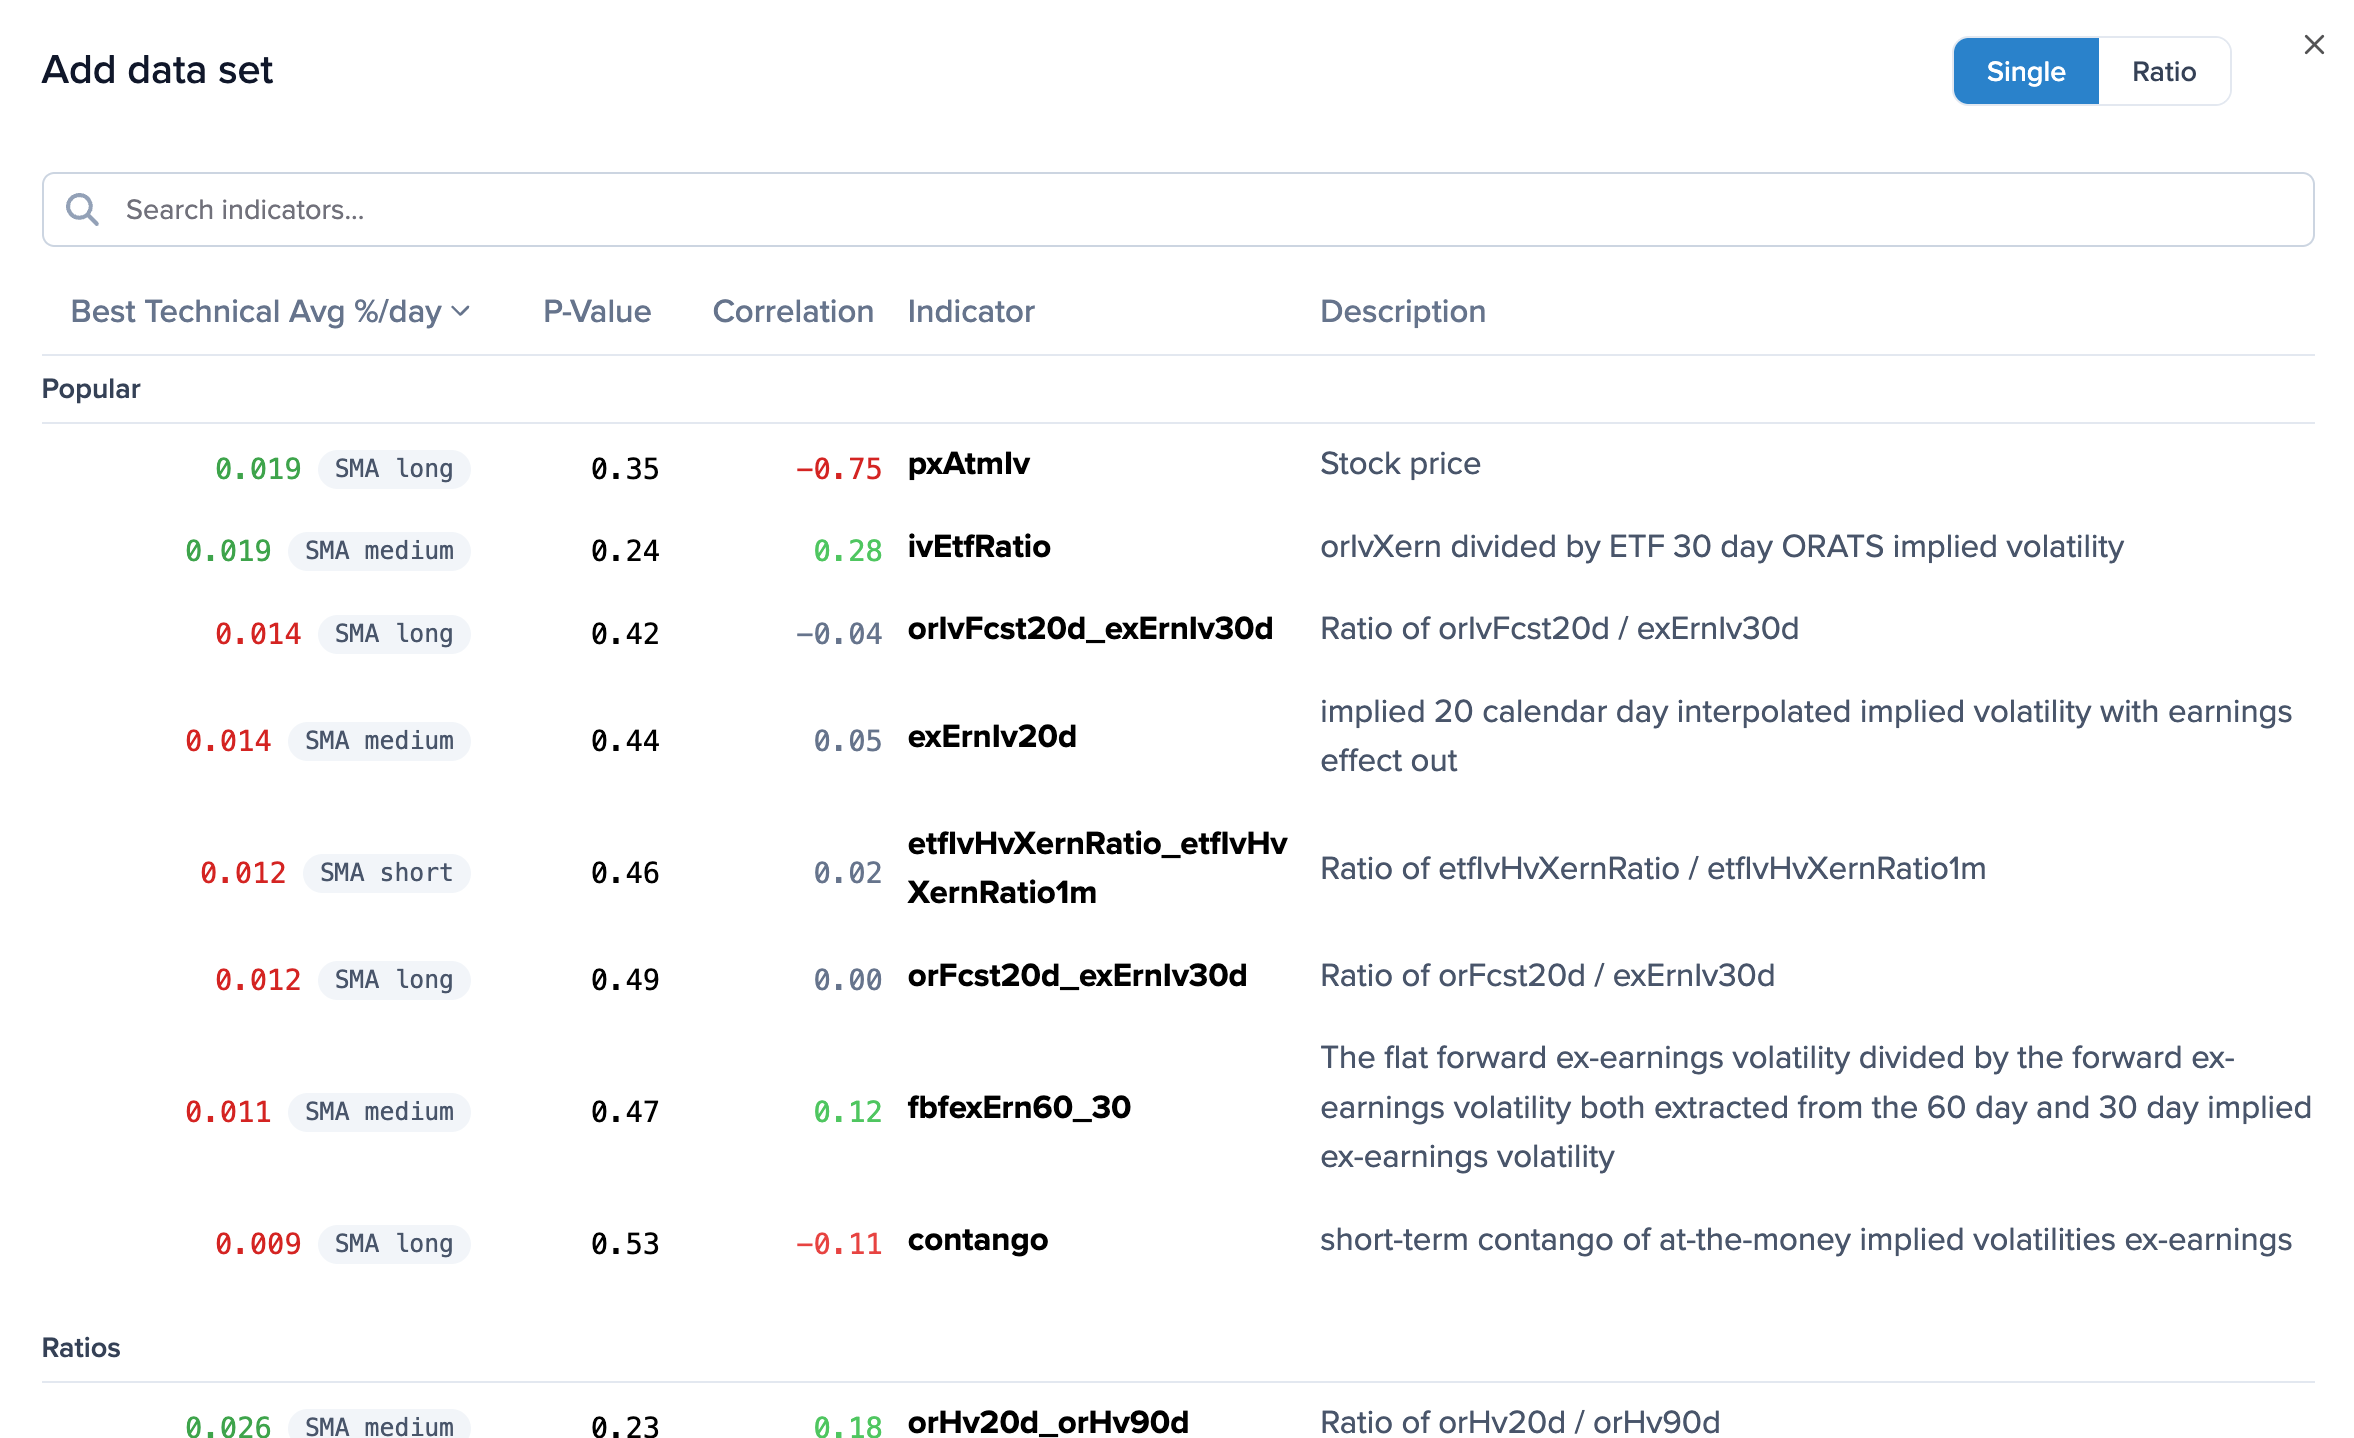
98 Proprietary ORATS Indicators including:
- Implied volatility metrics: Ex-earnings IV at multiple timeframes (10d, 20d, 30d, 60d, 90d, 6m), IV percentiles, IV rank
- ORATS forecasts: 20-day volatility forecast (orFcst20d), 20-day IV forecast (orIvFcst20d), infinite IV forecast (orFcstInf)
- Historical volatility: Intraday HV (1d, 5d, 20d, 90d), ex-earnings HV, close-to-close HV
- Market structure: Slope, derivative/curvature, contango, market width in vol points
- Correlation metrics: SPY correlation, ETF correlation, beta measurements
- Ratio indicators: IV/HV ratios, forward volatility ratios, ETF relative value ratios
- Confidence and R-squared: Forecast accuracy metrics, implied confidence scores
Technical Indicators with Pre-built Presets:
- Simple Moving Average (SMA): Multiple period comparisons with crossover strategies
- Bollinger Bands: Upper/lower band breakout strategies
- Relative Strength Index (RSI): Overbought/oversold conditions
- Commodity Channel Index (CCI): Mean reversion signals
Each ORATS indicator comes with pre-calculated performance metrics showing:
- Average %/day: The historical daily performance when this indicator's conditions were met
- P-value: The statistical significance of the performance improvement
- Correlation: The correlation between the indicator's values and the backtest's equity curve, helping identify which indicators have historically moved with strategy performance
Technical indicators offer multiple preset configurations:
- Short-term (5-15 periods): For capturing quick momentum changes
- Medium-term (10-30 periods): For balanced signal generation
- Long-term (20-50 periods): For trend-following strategies
Each preset includes pre-configured criteria that define when the indicator is "active" (allowing trades) versus "inactive" (blocking trades). These can be customized with AND/OR logic and wait periods.

Step 3: Analyze and validate results
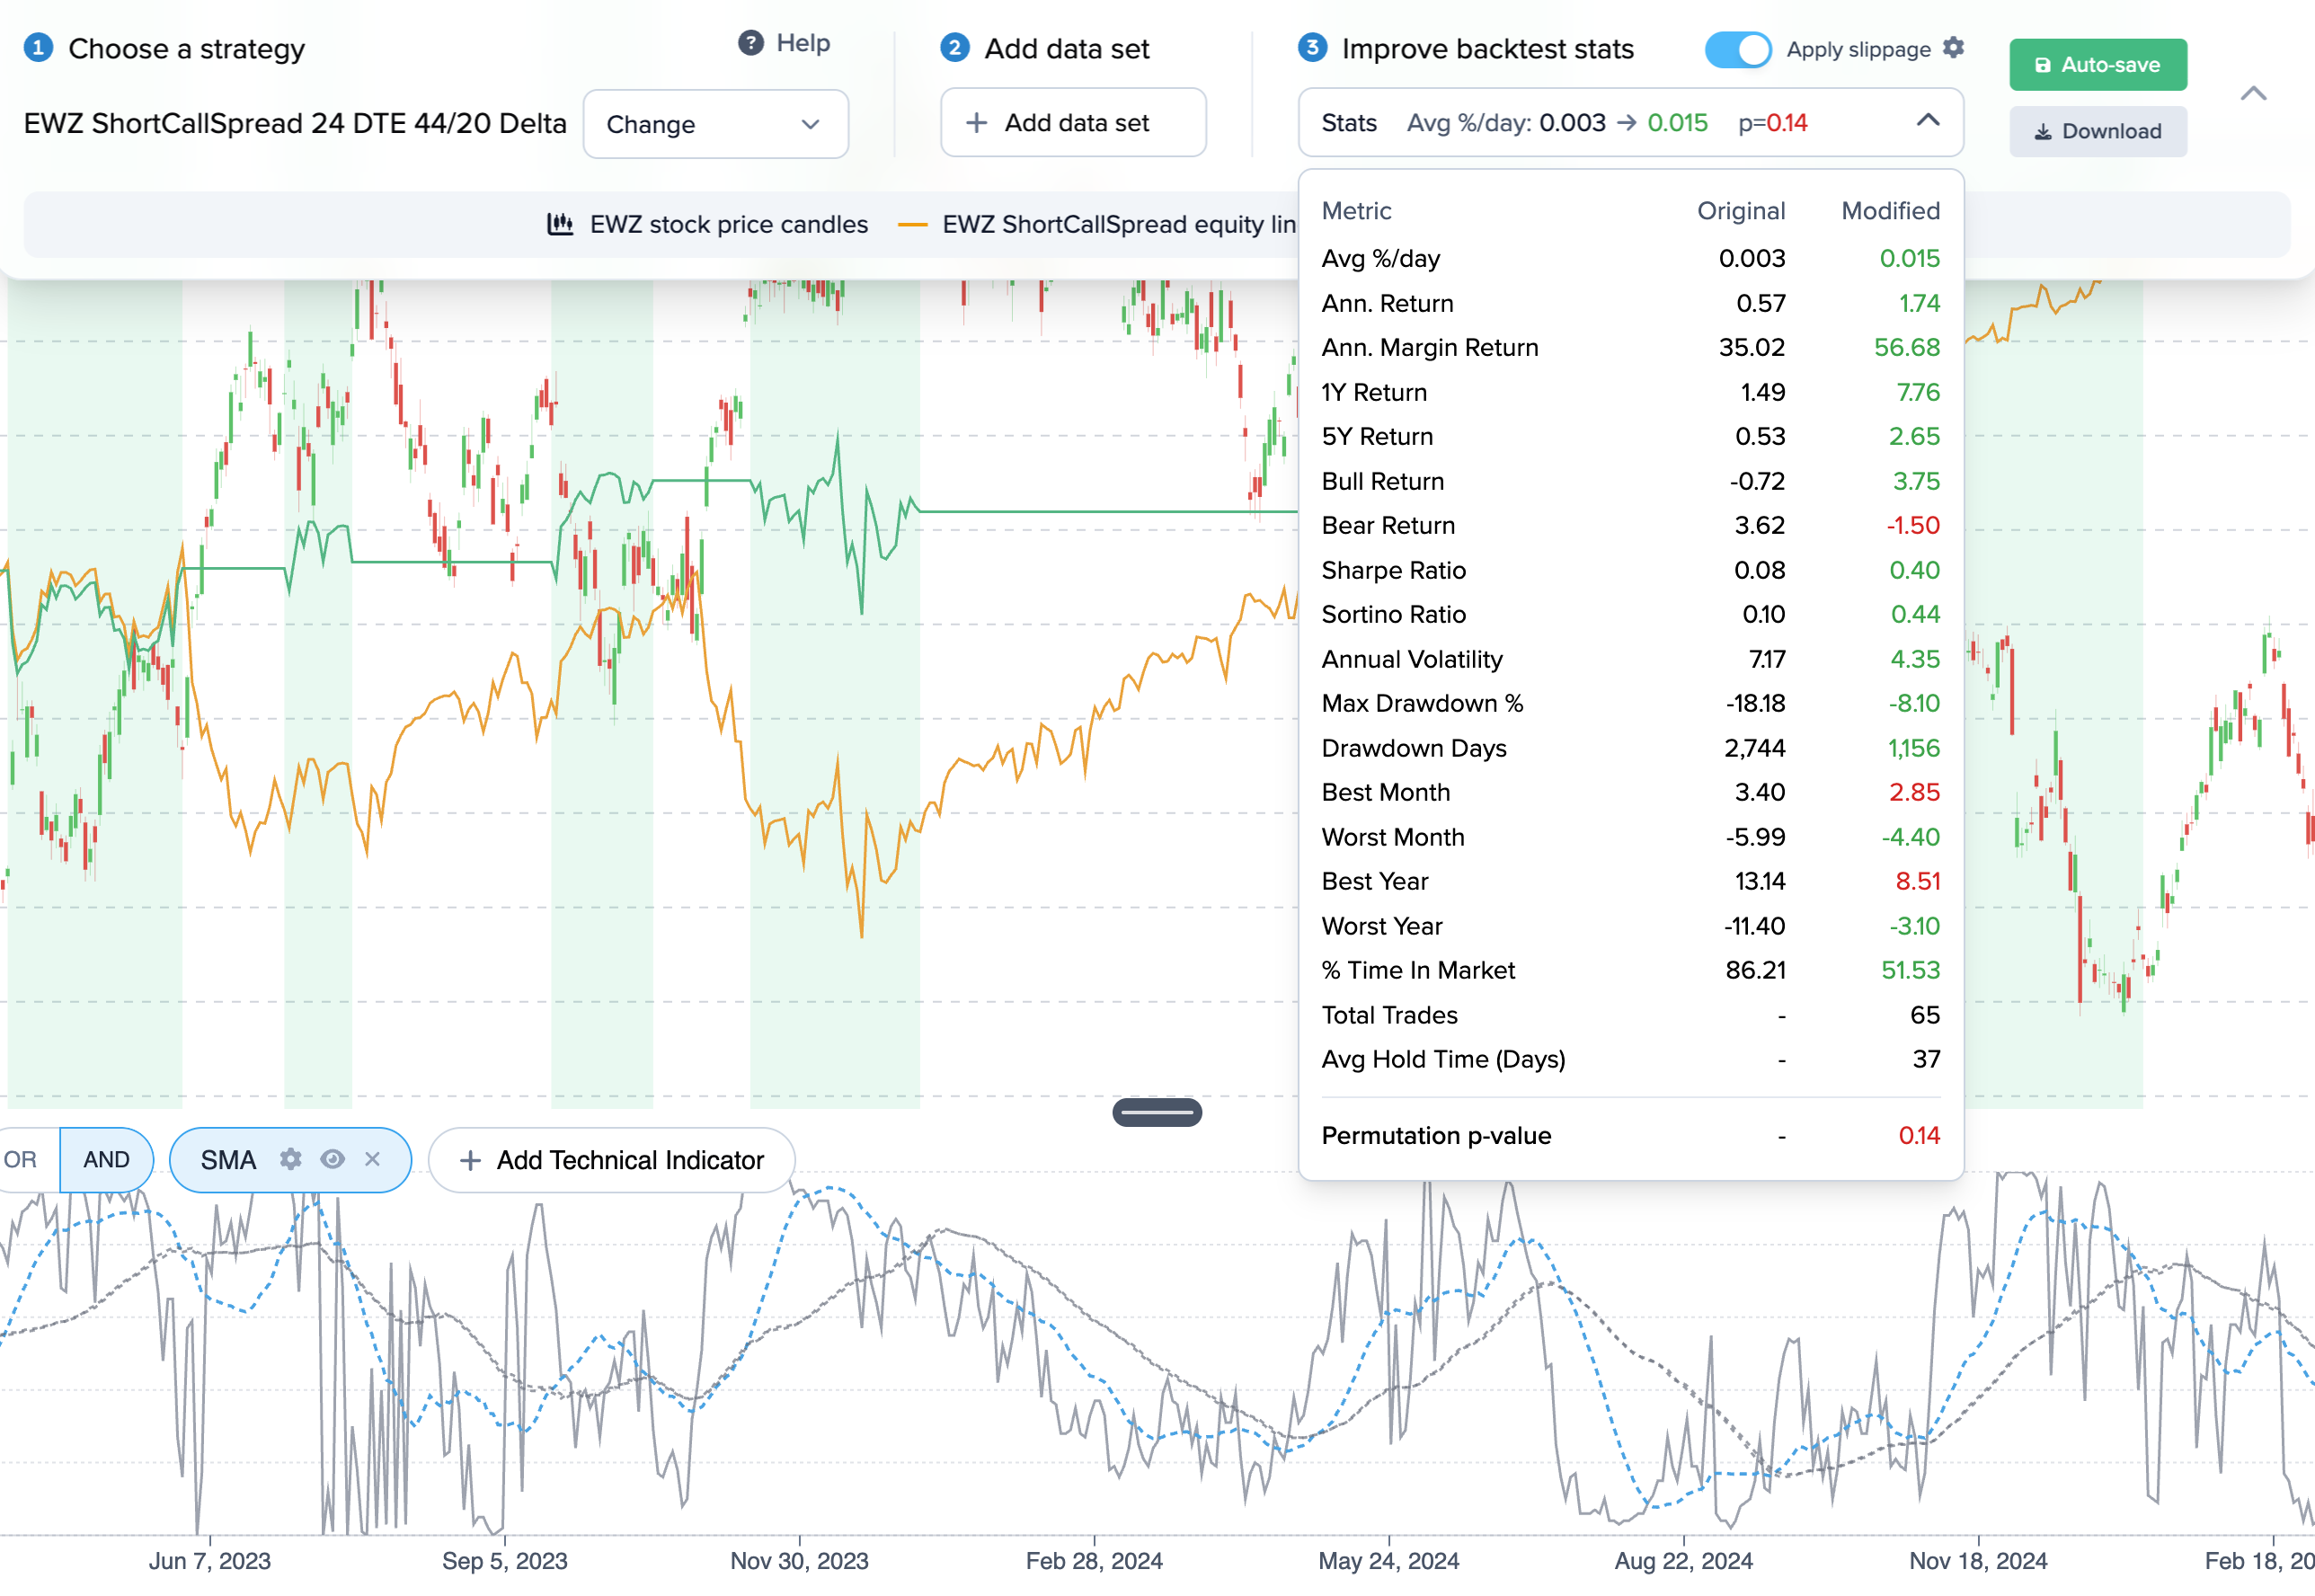
As you add indicators, the Optimizer provides real-time performance updates comparing your original strategy to the optimized version. Key metrics include:
- Return improvement: How much the annual return increased
- Sharpe ratio: Risk-adjusted performance enhancement
- Max drawdown: Whether the strategy became more or less risky
- Win rate: Changes in the percentage of profitable trades
- P-value validation: Statistical confirmation that improvements aren't random

The system continuously recalculates these metrics as you modify rules, helping you find the optimal balance between return enhancement and risk management.
Avoiding common optimization pitfalls
The most dangerous pitfall in optimization is over-fitting - creating rules so specific to historical data that they fail in real trading. The Optimizer helps combat this through:
- P-value calculation: Statistical measure showing the probability that improvements occurred by chance
- Permutation testing: Runs 10,000 modified Monte Carlo simulations to validate that your performance improvements are statistically significant, not random
More indicators don't always mean better performance. Keep these principles in mind:
- Start with one or two indicators and add gradually
- Focus on indicators with low P-values (< 0.05)
- Monitor whether additional indicators actually improve risk-adjusted returns
Advanced features
Slippage and commission modeling
The Optimizer includes sophisticated slippage modeling to ensure realistic performance expectations:
- Default slippage: Automatically calculated based on option bid-ask spreads and market conditions
- Custom slippage: Override with your own assumptions based on actual trading experience
- Commission settings: Factor in per-leg commission costs for accurate net returns
Indicator logic combinations
Combine multiple indicators using flexible logic operators:
- AND logic: All conditions must be true (more selective, fewer trades)
- OR logic: Any condition can trigger (more opportunities, more trades)
- Mixed logic: Use AND for entry and OR for exit, or vice versa
- Wait periods: Set minimum bars between entry/exit to avoid whipsaws
Visual performance analysis
The Optimizer provides comprehensive visualization tools:
- Real-time chart updates: See when indicators are active/inactive overlaid on price charts
- Performance comparison: Side-by-side metrics showing original vs. optimized strategy
- Indicator overlays: Display SMA lines, Bollinger Bands, RSI, and CCI values directly on charts
- Trade highlighting: Visual markers showing when your optimized conditions would have triggered
Integration with Trade Ideas
Once you've optimized a strategy, simply click "Save" and it automatically saves to your backtests table with any updates applied. Your saved strategies then appear in the Trade Ideas "My Strategies" section, where the system continuously runs option scans for every strategy that currently meets its entry criteria, automatically finding and ranking the best available trades throughout the day.
In your saved backtests table, you'll also find Curated Strategies tagged and developed by the ORATS team using this same optimizer tool. These professionally-built, statistically-validated strategies provide proven trading approaches to help you get started while you develop your own optimized strategies.
Next steps
The Strategy Optimizer bridges the gap between backtesting and finding profitable trades. By adding statistically validated improvements to your strategies, you're not just hoping for better performance - you're engineering it with data-driven precision.
After optimizing your strategies and saving them for use in Trade Ideas, it's time to explore the second pillar of successful options trading - implementation. In the following lessons, we'll look at the stock scanner, option scanner, and trade ideas tabs to explore how we can utilize proprietary theoretical values and hundreds of indicators to find good trades in real-time.
