400 - Implementation, risk, review
Charting and trade analysis
Numbers tell you what a trade costs; charts tell you how it behaves. The ORATS dashboard pairs every step of analysis with a visual, so you can see a position before you commit capital and watch risk across your whole book afterward. Most of these tools live under Ticker Analysis (Trade Builder, Options Chain, Outlook); portfolio risk lives under Positions (Risk Profile).
The Trade Builder
The Trade Builder is the default tab of Ticker Analysis and the central charting workspace. It plots a single ticker's price over a window that extends into the future, then lets you place option legs directly on that chart and watch the trade's economics update live.
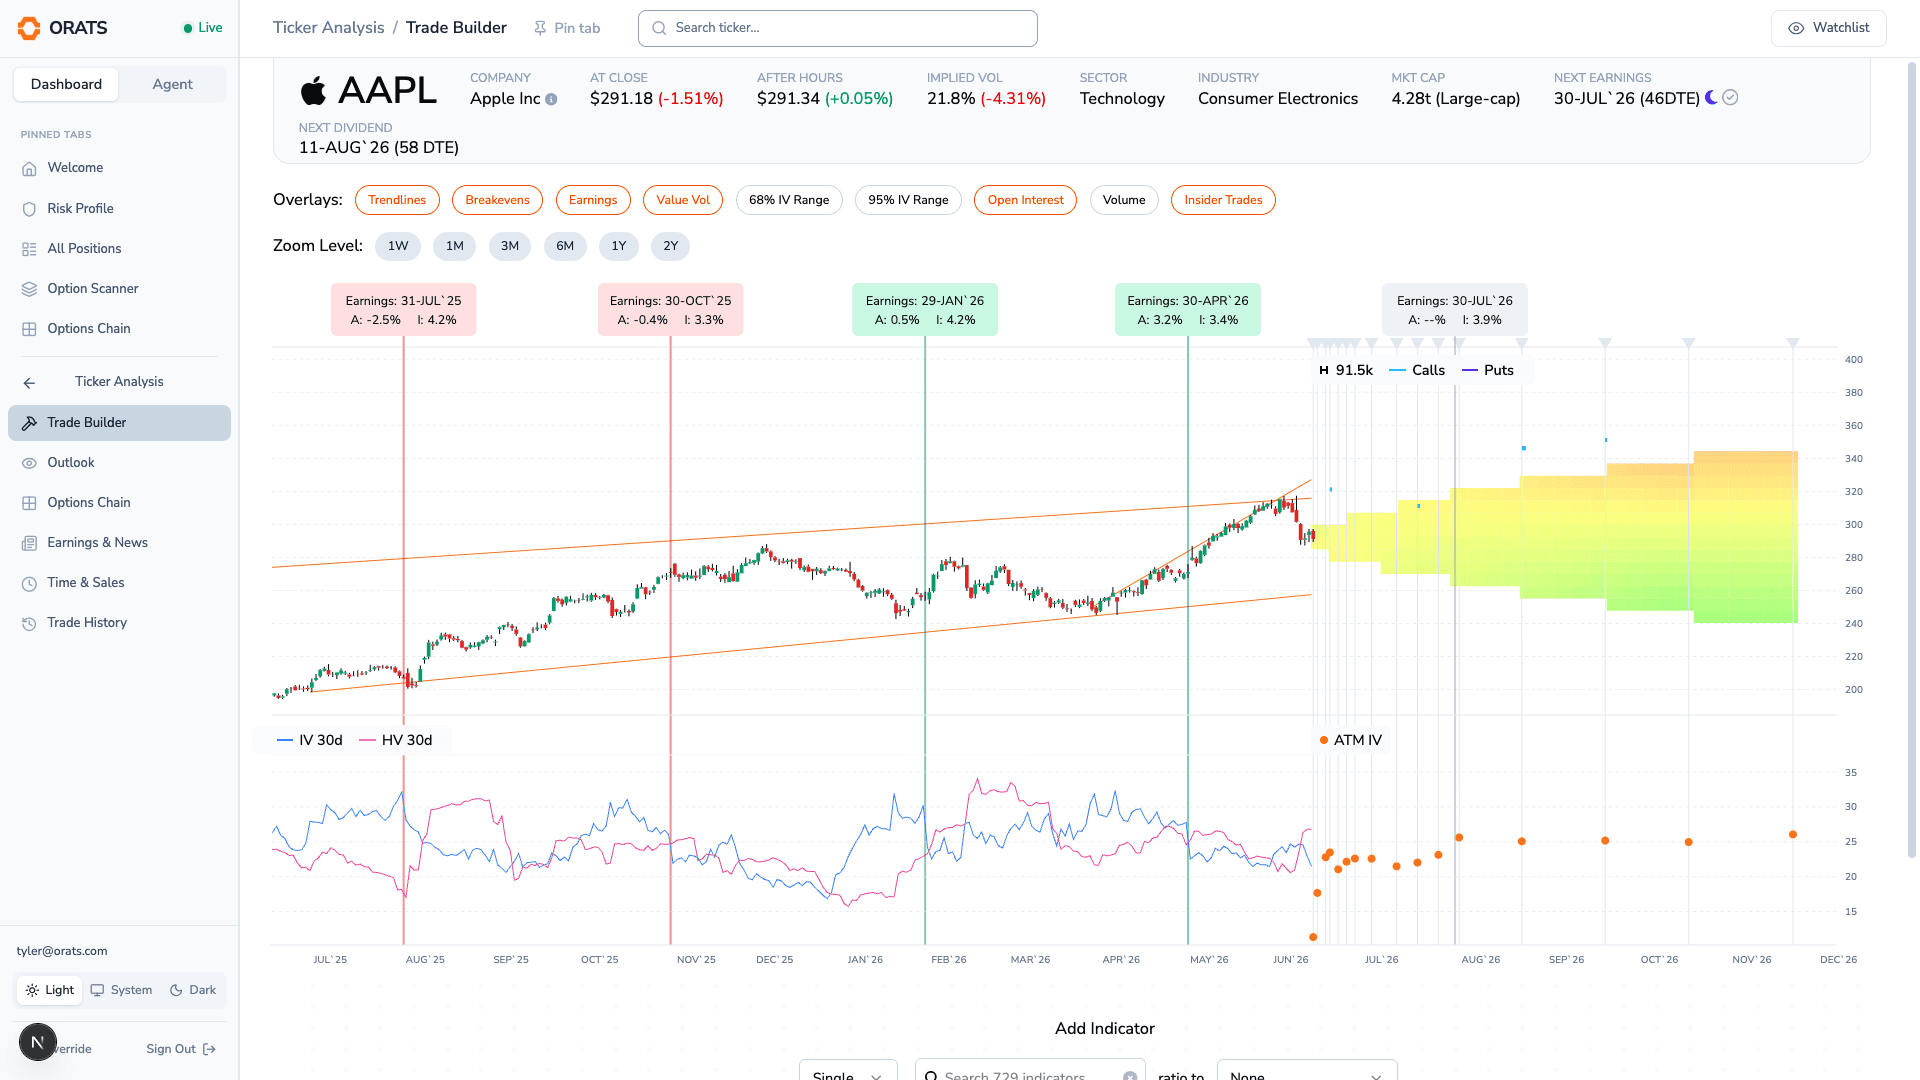
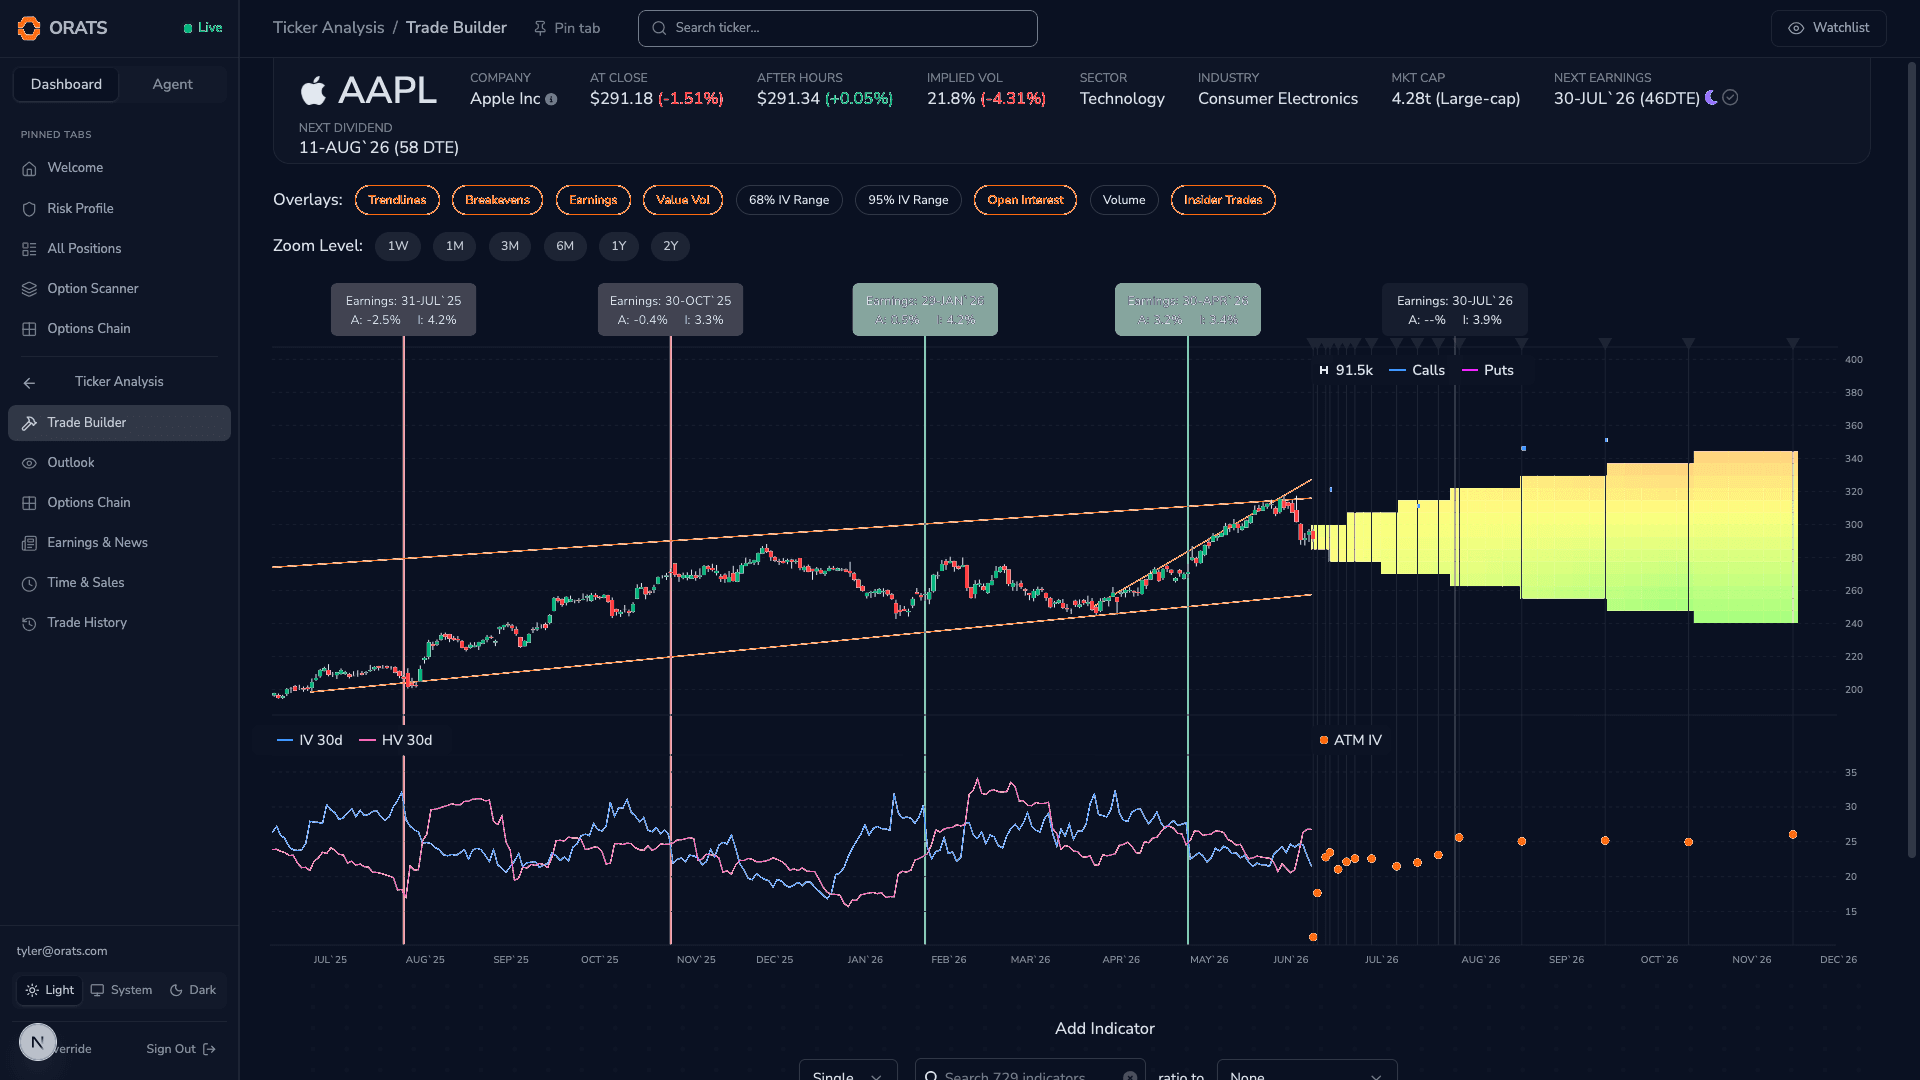
You add legs from the Options Chain: clicking a contract's Ask buys it (a long leg, drawn in green), and clicking its Bid sells it (a short leg, drawn in red). Each leg appears as a draggable marker labeled like "$150 Call Exp. 6/20". Drag it, or use the arrow keys, to walk the strike up and down and the expiration left and right; the chart re-prices as you go.
Several overlays can be toggled on and off:
- Trendlines: auto-drawn support and resistance levels.
- Breakevens: the breakeven price line(s) for the trade you have built.
- Earnings: markers for upcoming earnings dates on the timeline.
- Value Vol: a fair-value cone projected forward from the volatility surface.
- 68% IV Range and 95% IV Range: one and two standard-deviation implied-move cones.
- Open Interest or Volume: per-strike bars at future expirations (one at a time).
- Insider Trades: insider buy and sell markers on the price history.
The price panel, an implied-volatility sub-chart (30-day IV, 20-day historical volatility, and forward volatility), and vertical expiration lines are always shown, and you can add a custom secondary indicator beneath the chart.
A sidebar reports the trade's live economics: Distribution, Forecast, and Smoothed edge; POP (probability of profit); breakeven(s); reward-to-risk; max gain and max loss; and net cost as a debit or credit. A per-leg table breaks out each leg's price, ORATS theoretical value (SMV), implied volatility, and delta. The full position Greeks live in the Risk Profile, covered below.
The Options Chain
The Options Chain tab presents the full chain two ways at once: a graph on top (which you can collapse with Show Graph and Hide Graph) and a table below.
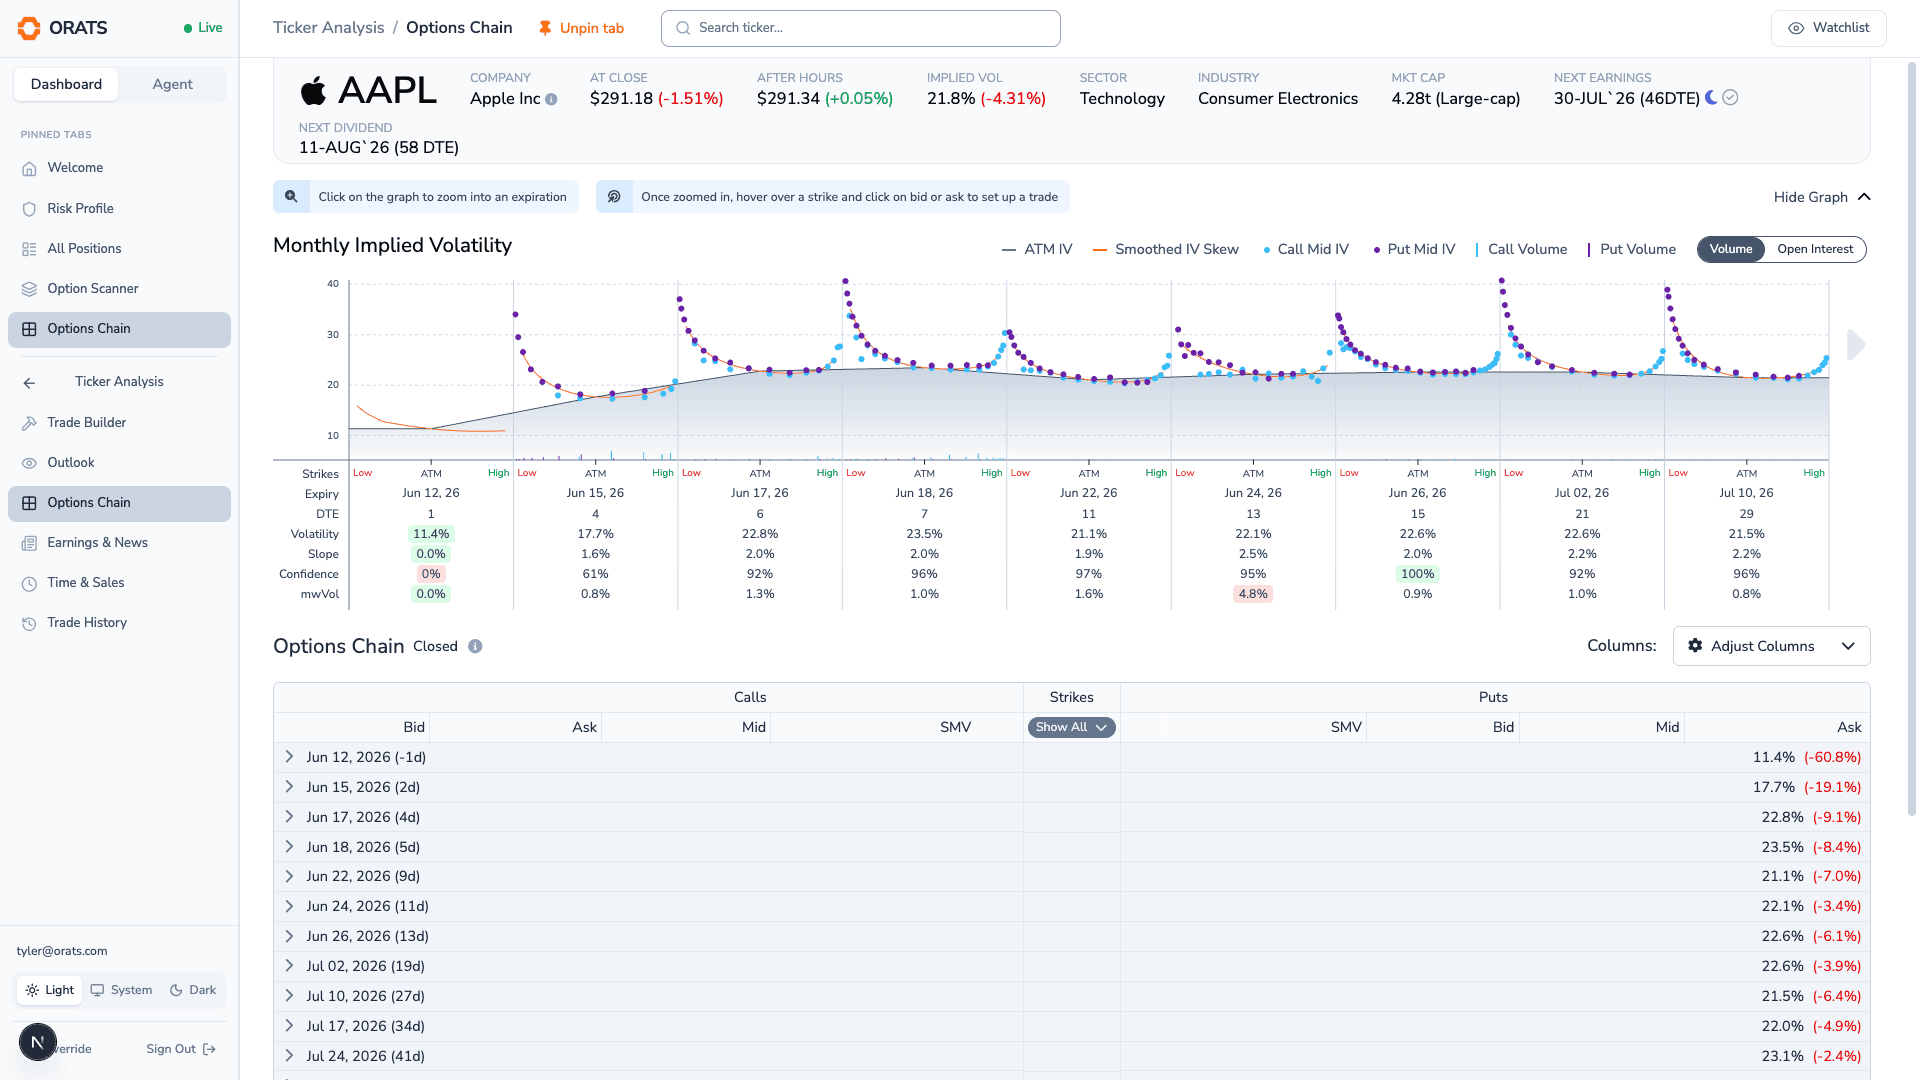
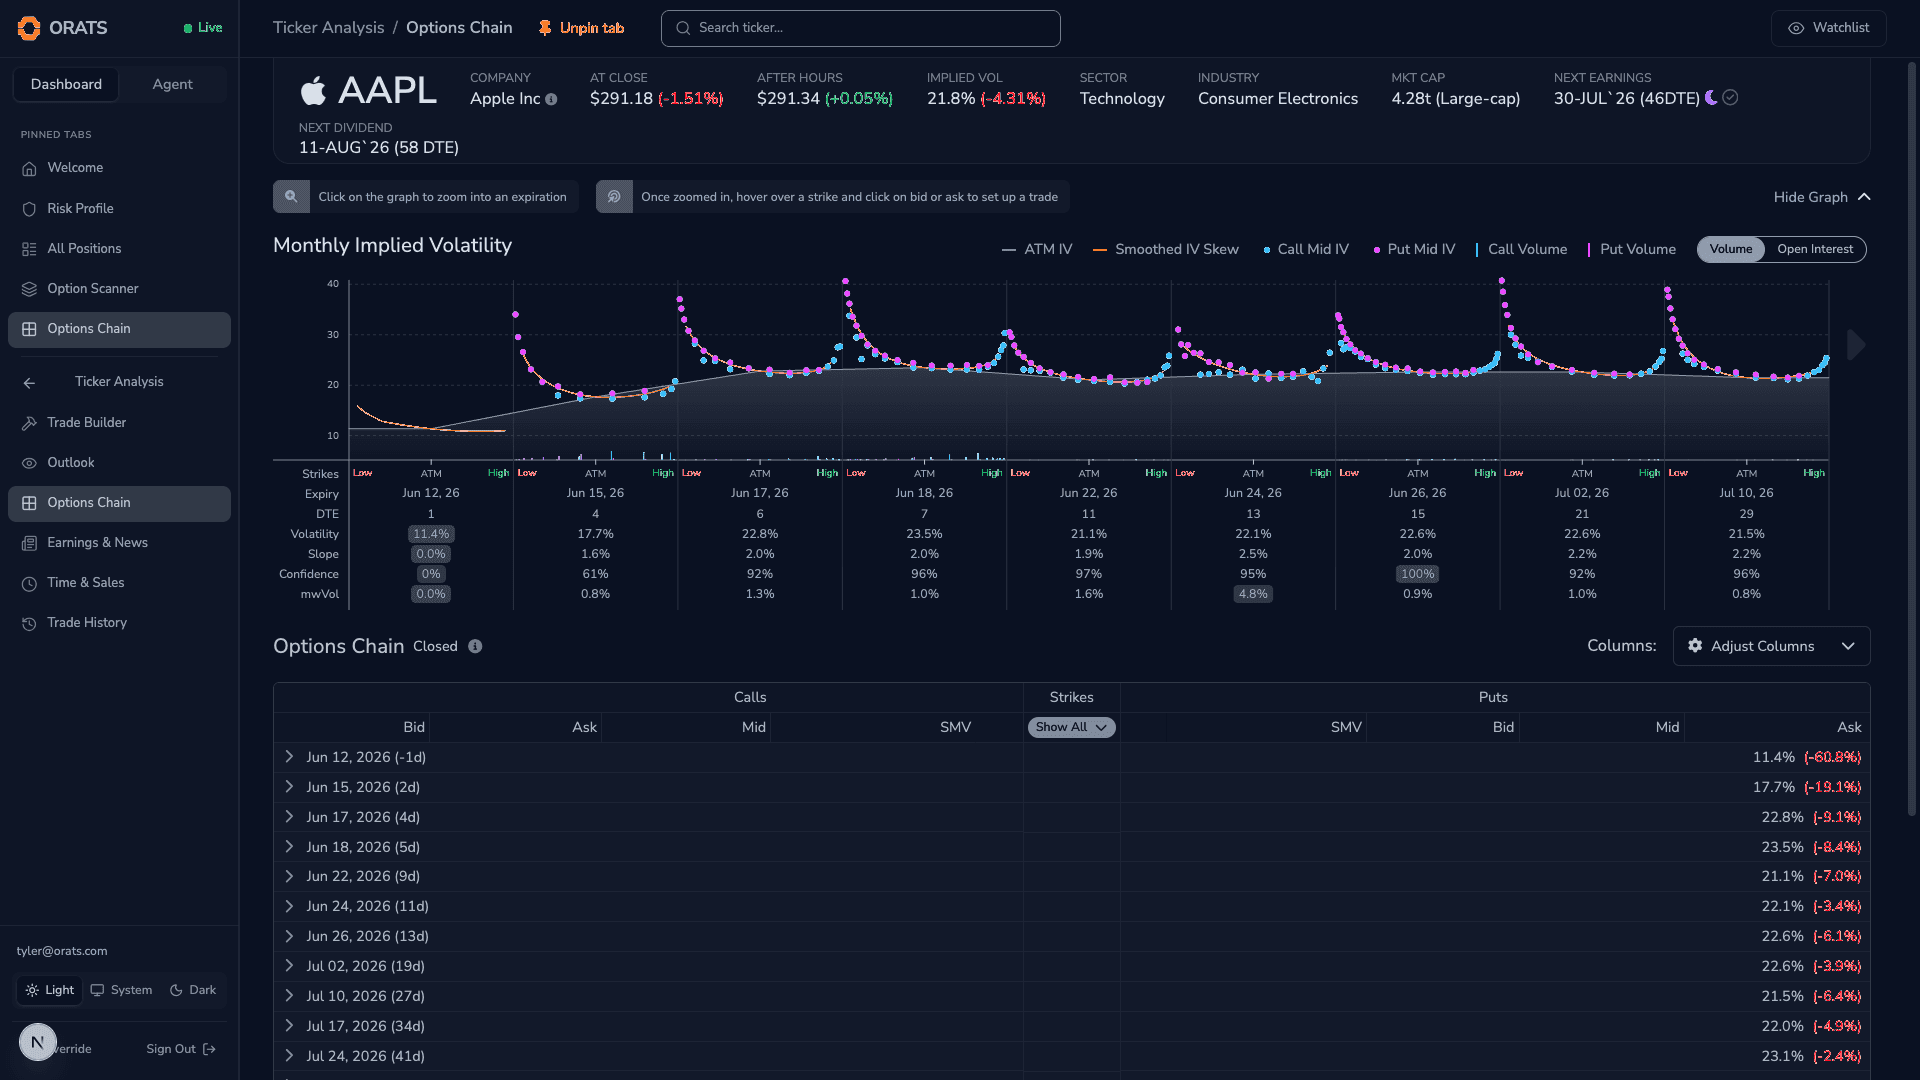
The Chain Graph plots implied volatility across strikes for each expiration. On it you will find the ATM IV line, a smoothed IV skew curve, call and put mid-IV points, and a bar series you can switch between Volume and Open Interest. Page through expirations, hover any strike to read its bid, ask, SMV, volume, open interest, and IV, and click a Bid (to sell) or an Ask (to buy) to drop that contract straight into the Trade Builder.
The Chain Table lays out Calls, Strikes, and Puts side by side. Bid, Mid, Ask, and SMV are shown by default; the Adjust Columns control lets you add forecast value, delta, gamma, theta, vega, the implied-volatility columns, volume, and open interest, and reorder them to taste. As on the graph, clicking a bid or ask adds a leg to your trade.
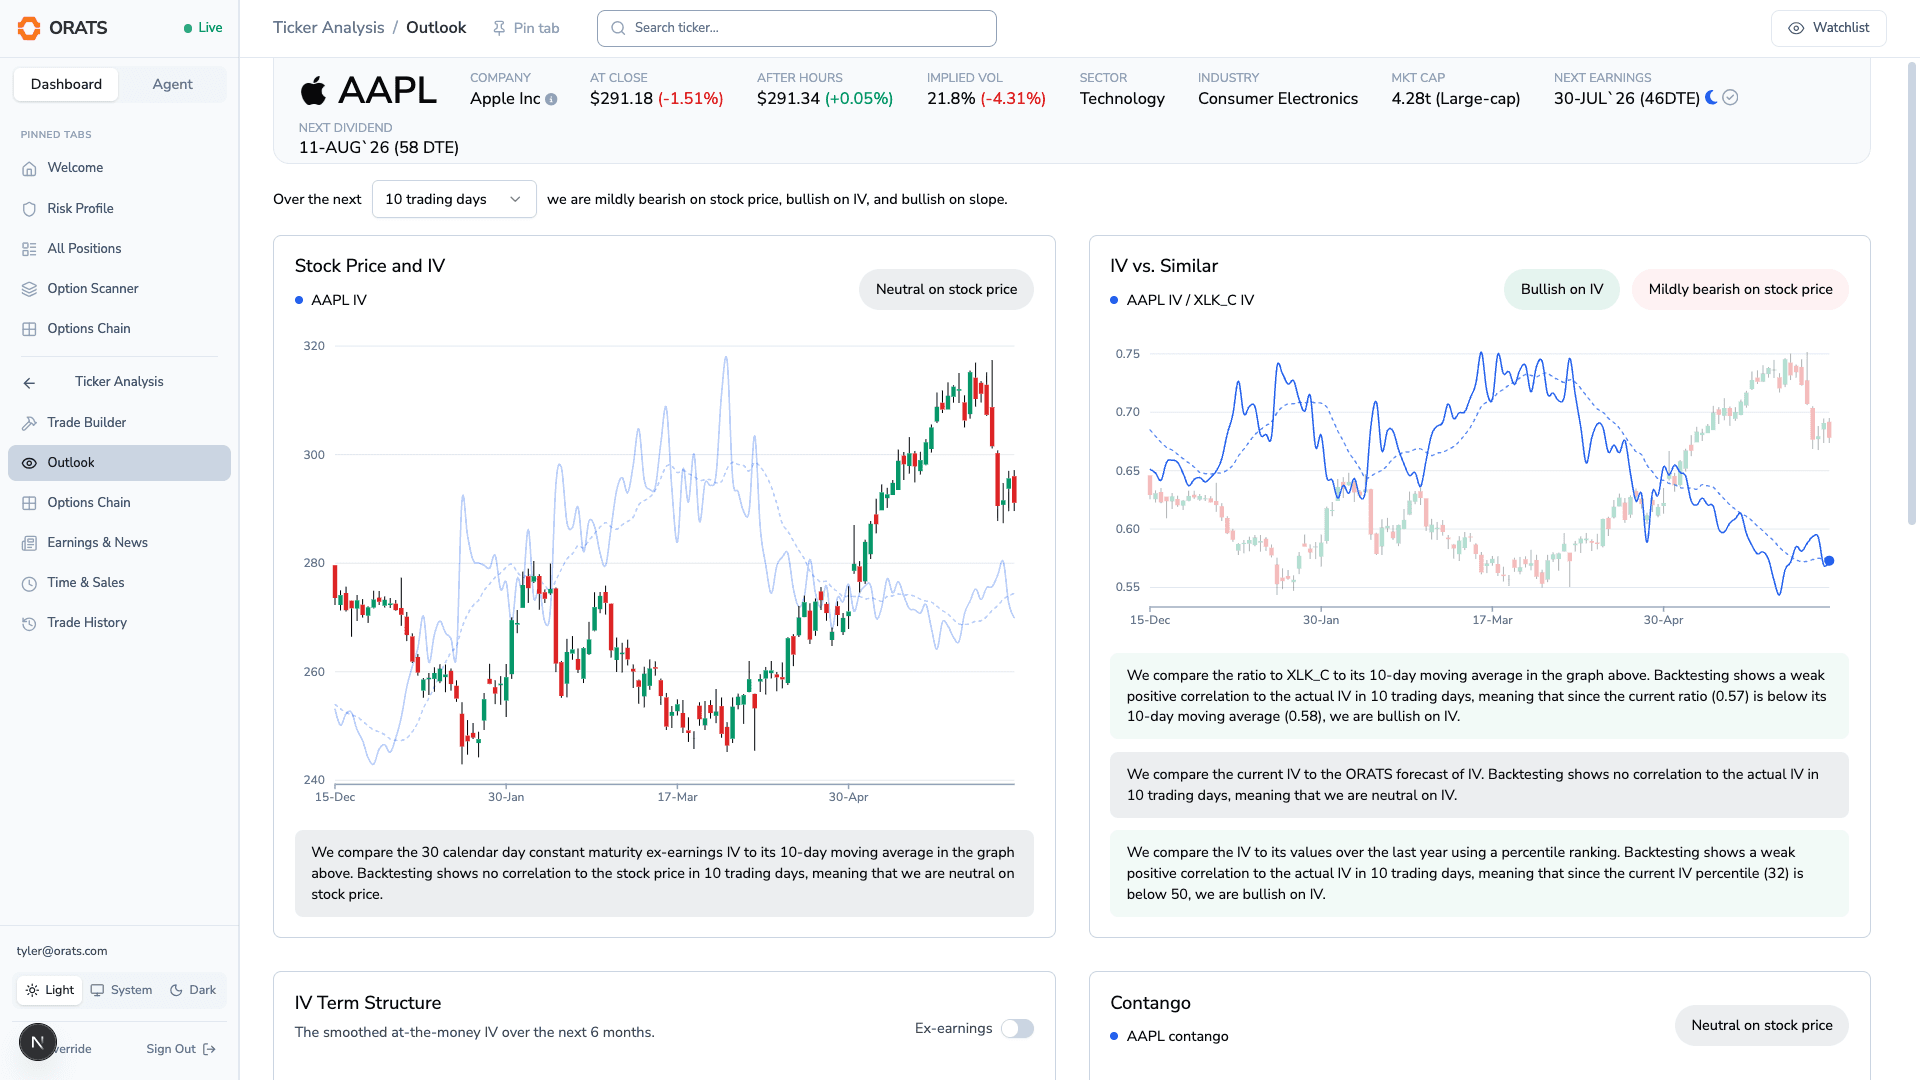
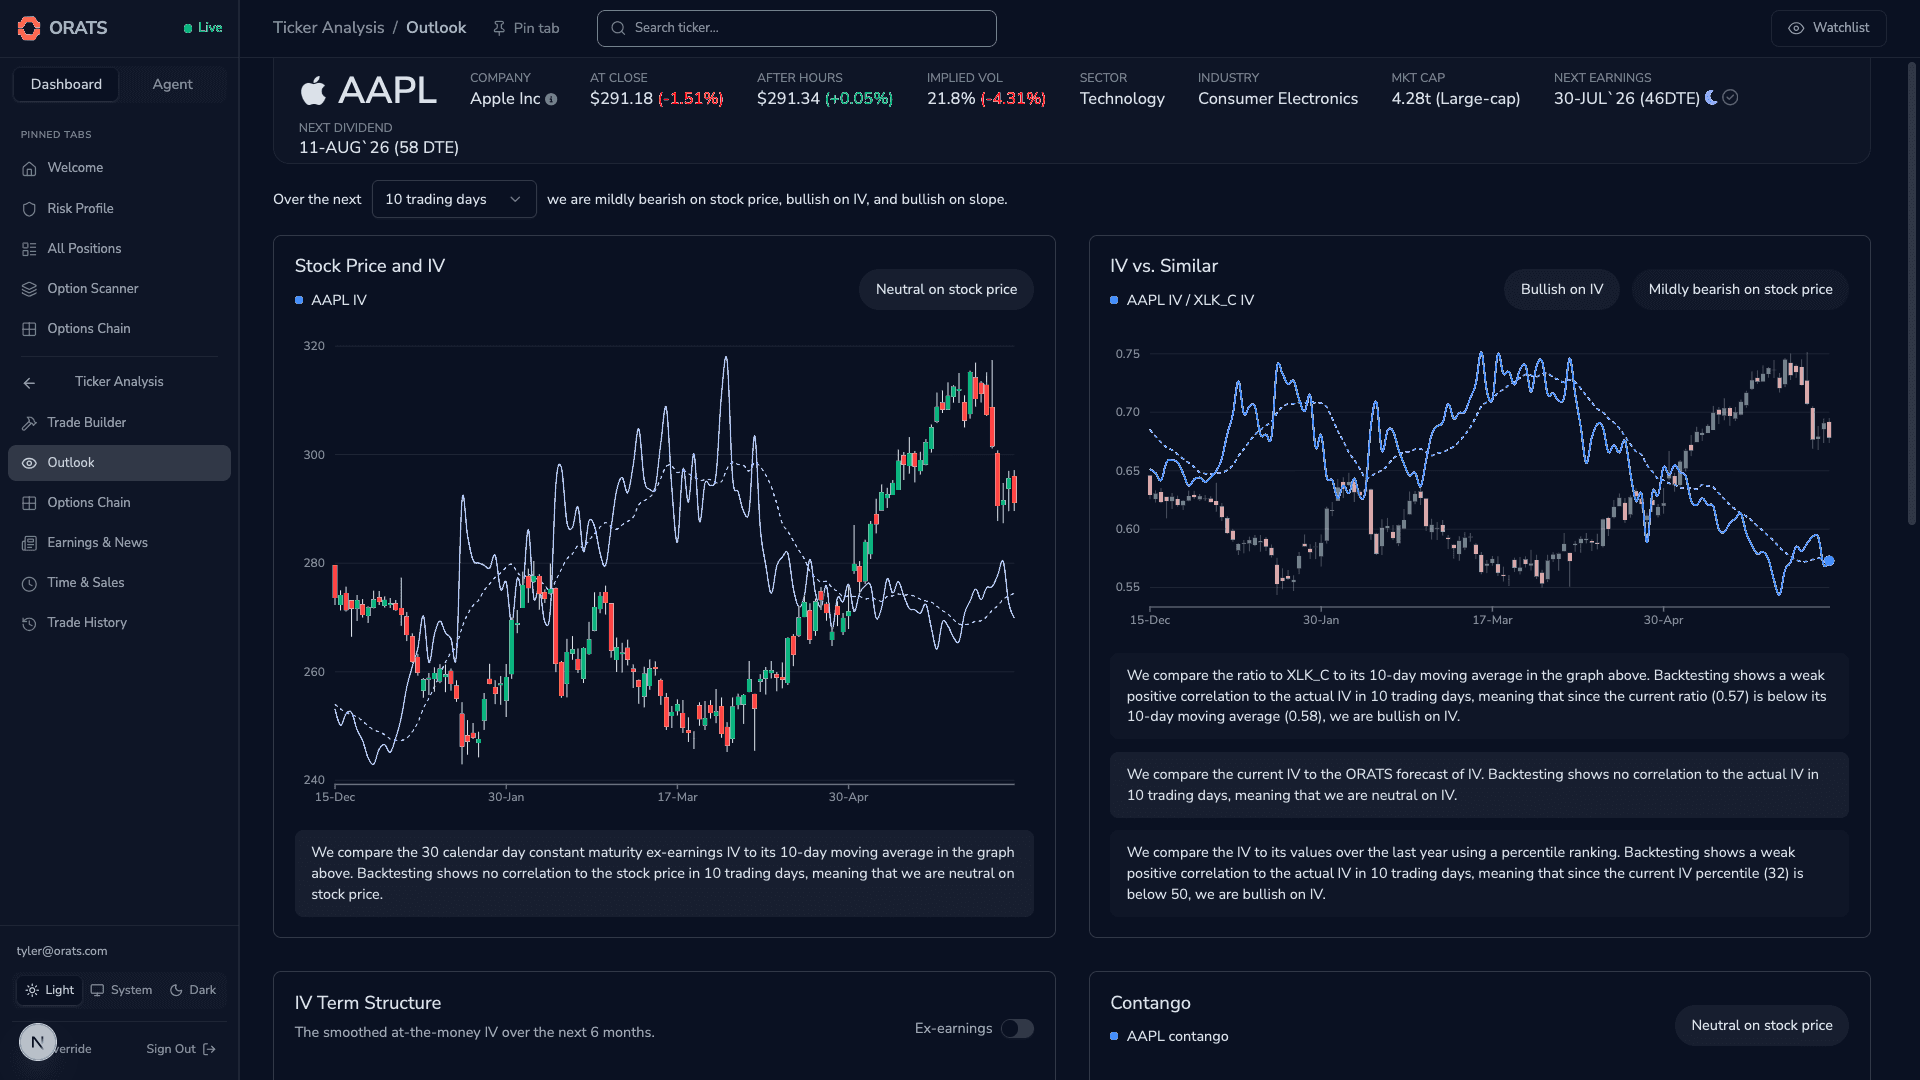
The Outlook
The Outlook tab translates the current options surface into a directional read. A backtested correlation engine scores the ticker bullish, bearish, or neutral over a horizon you choose (the next 3, 5, 10, or 20 trading days), and lays out its reasoning as a two-column grid of cards:
- Stock Price and IV: price candles with 30-day ex-earnings IV and its recent trend.
- IV vs. Similar: the ticker's implied volatility relative to its best-fit sector or index ETF, with forecast and one-year percentile context.
- IV Term Structure: ATM implied volatility across expirations.
- Contango: the relationship between shorter and longer-dated IV over time.
- Expiration IV Skew: the implied-volatility-by-delta curve for a chosen expiration.
- Slope vs. Similar: the ticker's skew slope relative to its best-fit ETF, with forecast and percentile context.
The IV, Slope, Stock Price, and Contango cards carry a directional pill; Term Structure and Skew are descriptive views of the surface.
The Risk Profile
The Risk Profile (under Positions, marked New) is where payoff analysis lives. For a single trade it draws the payoff diagram: profit and loss across underlying prices, with POP, max gain, max loss, and reward-to-risk. Its "What if?" controls let you shift implied volatility and days to expiration and watch today's theoretical value respond, so you can stress a position before you ever place it.
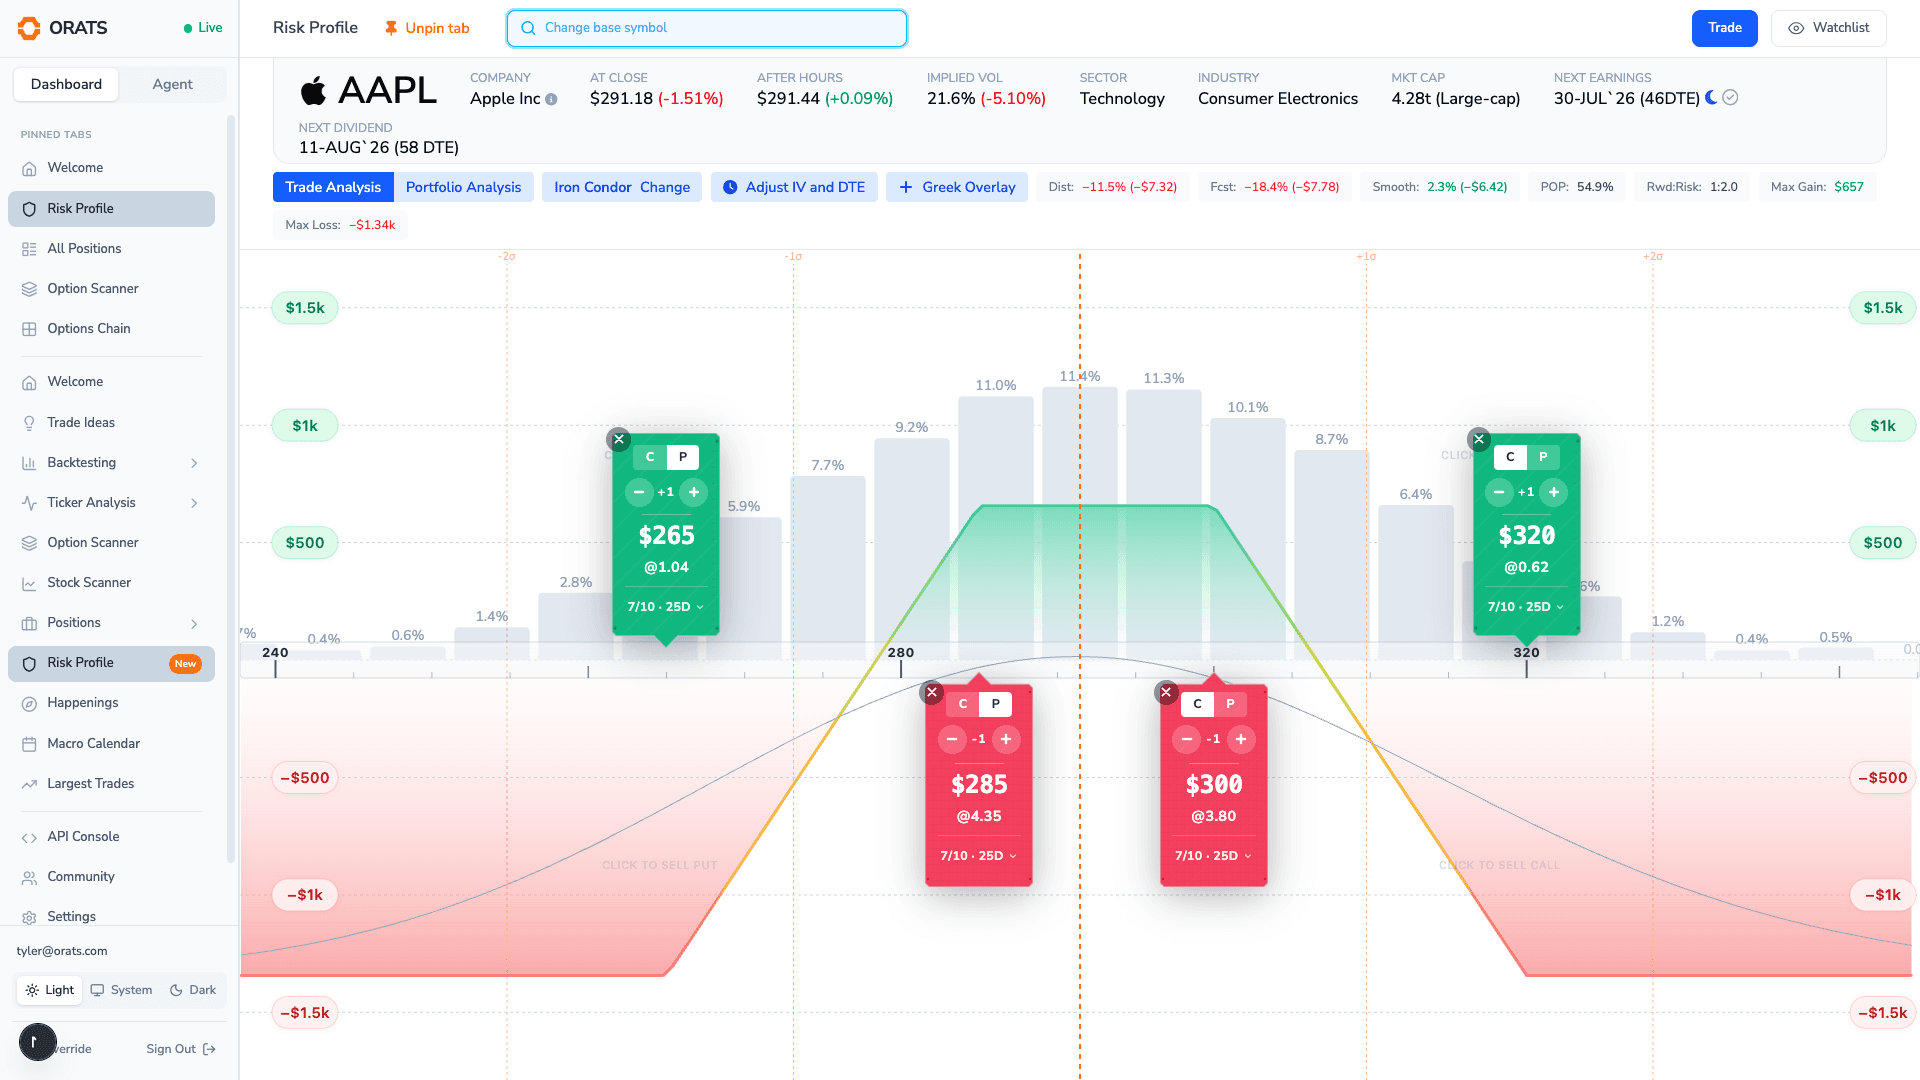
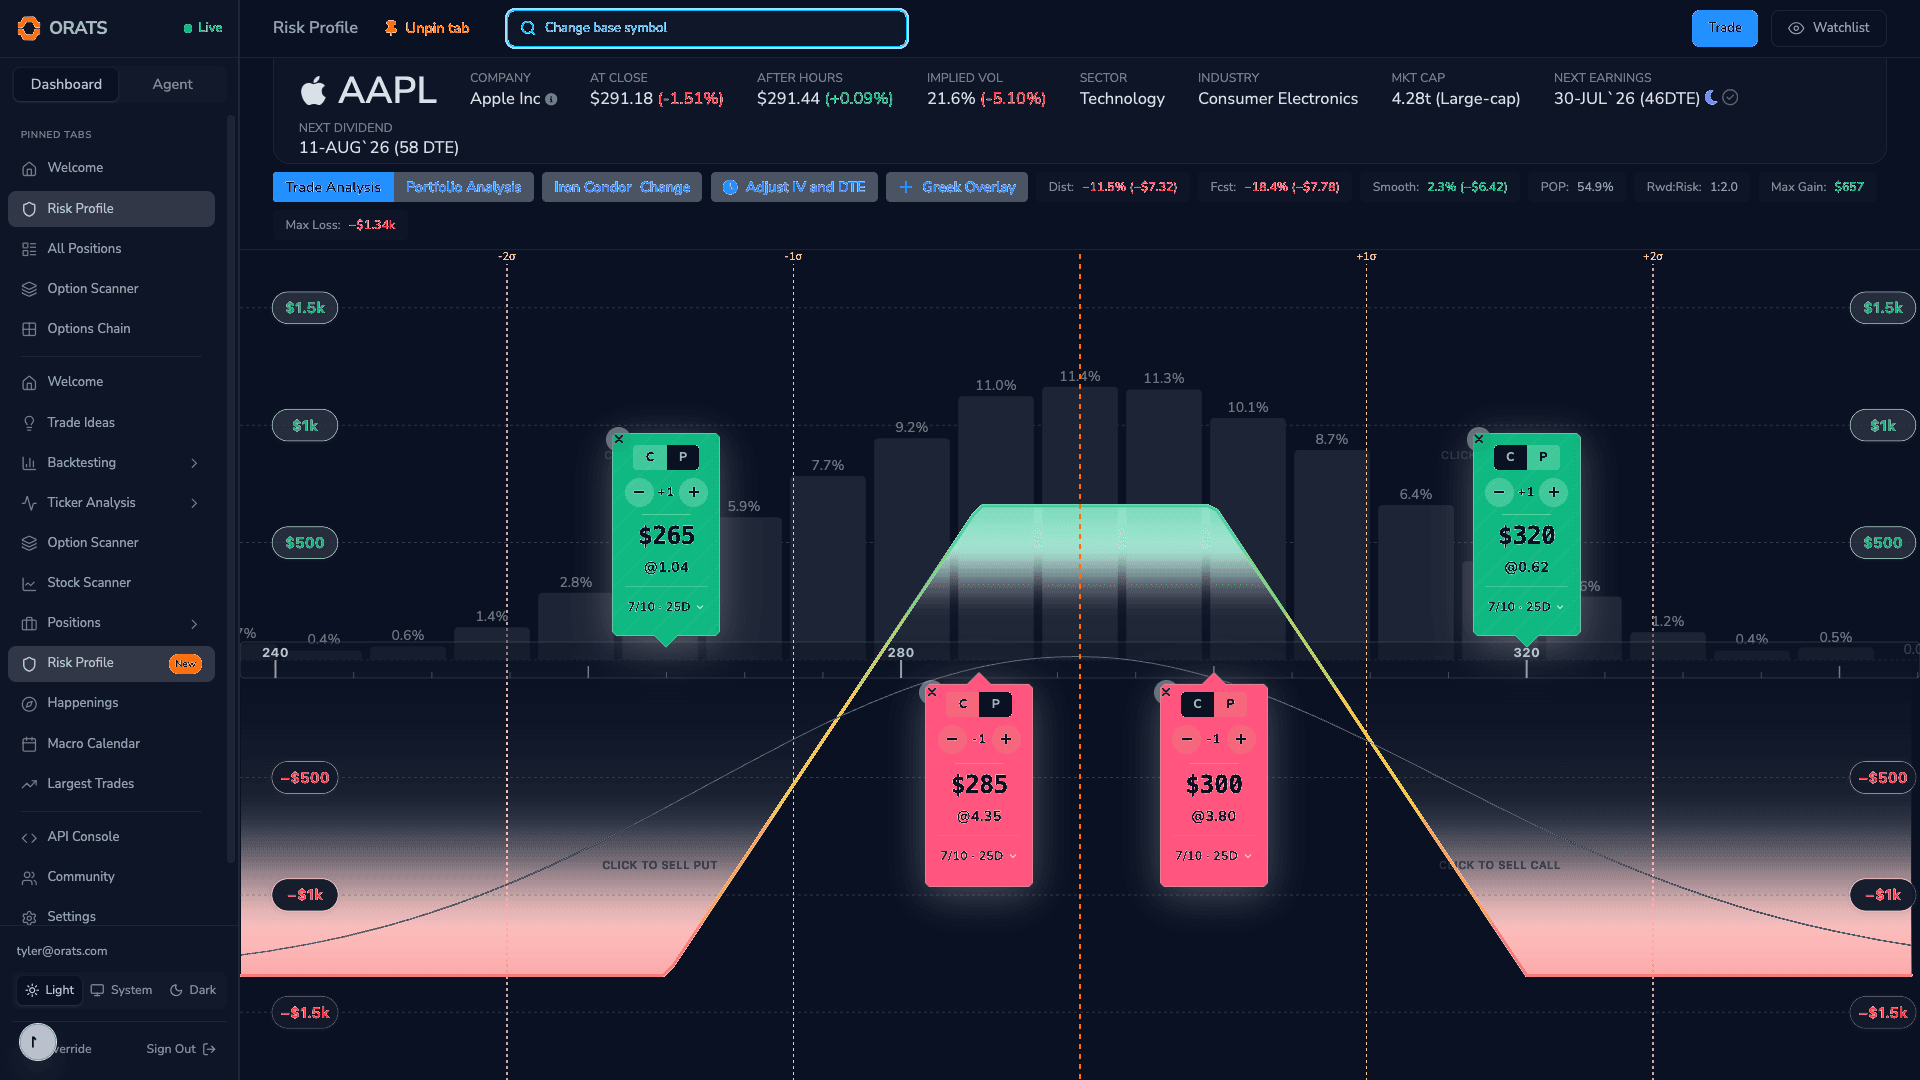
Its real differentiator is Portfolio mode. Switch it on and the Risk Profile pulls in your broker positions and combines them into a single portfolio profit-and-loss curve. Rather than plotting against one stock's price, it maps every position onto a shared scale of standard-deviation moves (from minus three to plus three sigma) using historical three-day price distributions, then sums the P&L across all positions and underlyings on one chart. A probability histogram sits behind the curve, and the legend reports net Profit, Delta, and Theta for the entire book. It is the one view that shows what your whole portfolio does when the market moves, not just a single trade.
Bringing it all together
These tools turn raw options data into something you can read at a glance: the Trade Builder to shape a position on the chart, the Options Chain to see pricing and skew across strikes, the Outlook to gauge the market's lean, and the Risk Profile to understand payoff for one trade and risk for the whole portfolio.
With your trade analyzed and your risk understood, the next step is execution. In the following lesson, we'll cover placing orders: setting exit alerts, choosing an execution approach, and connecting your broker.


